. 2019 May;7(5):759-772.
doi: 10.1158/2326-6066.CIR-18-0466. Epub 2019 Mar 19.

IL15 Enhances CAR-T Cell Antitumor Activity by Reducing mTORC1 Activity and Preserving Their Stem Cell Memory Phenotype

Affiliations

IL15 Enhances CAR-T Cell Antitumor Activity by Reducing mTORC1 Activity and Preserving Their Stem Cell Memory Phenotype

Darya Alizadeh et al. Cancer Immunol Res. 2019 May.

Abstract

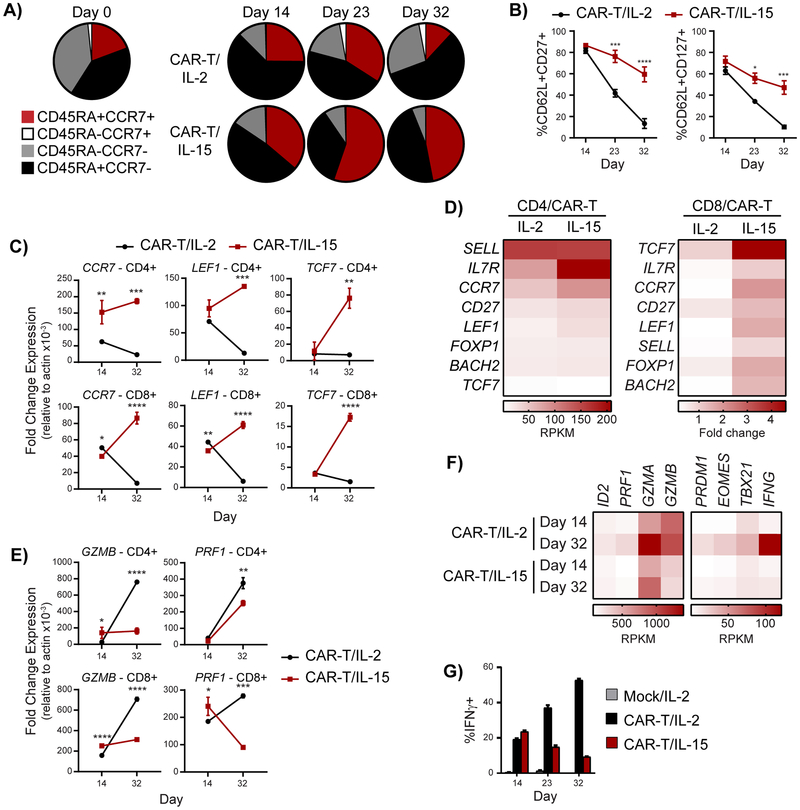
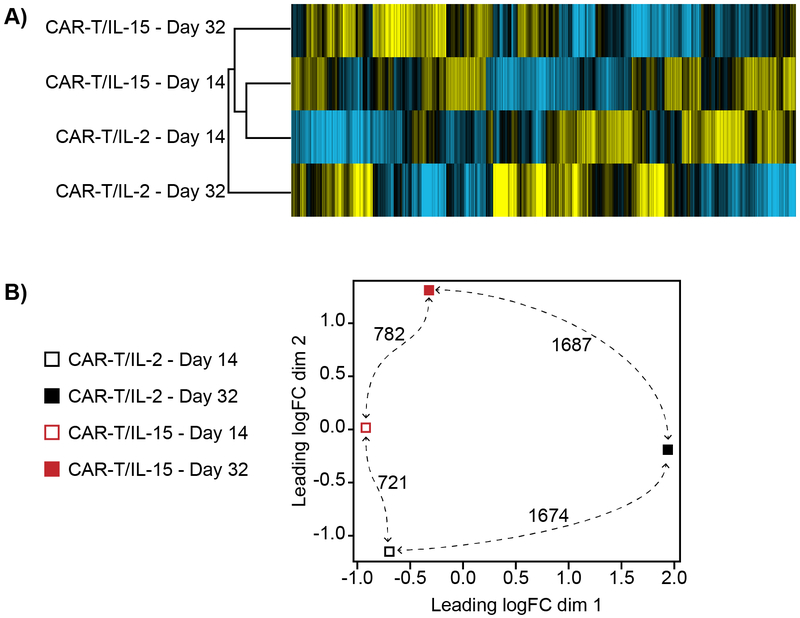
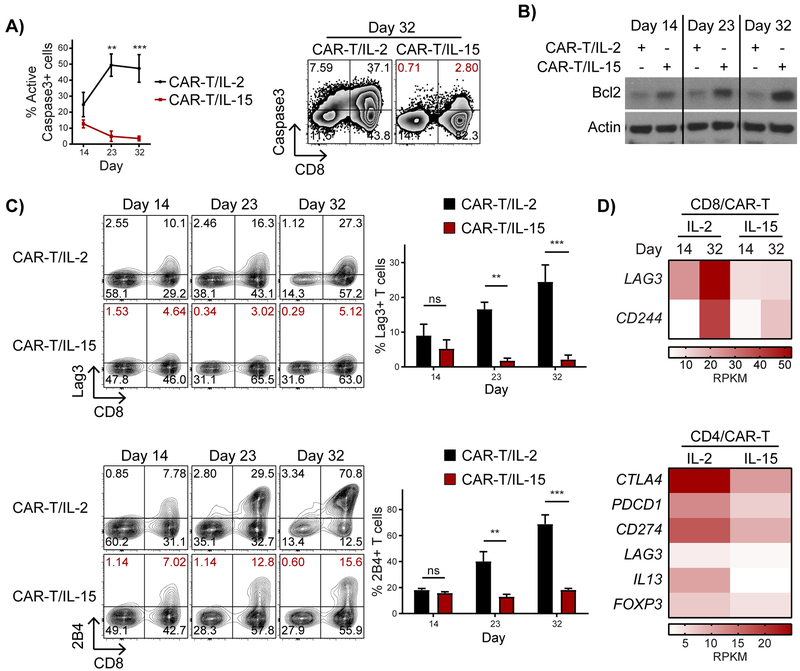
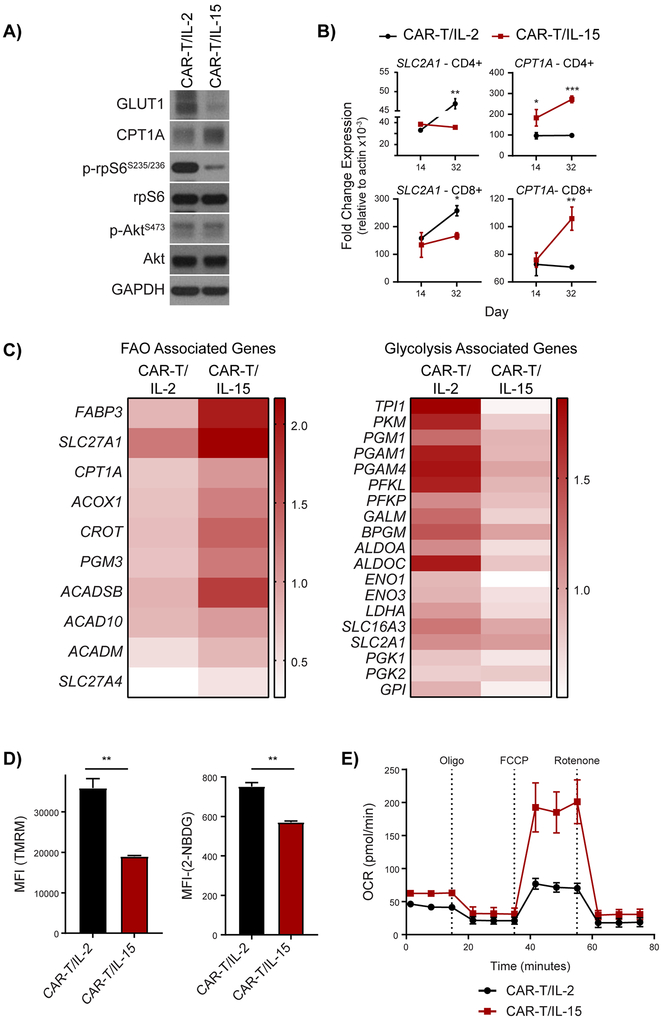
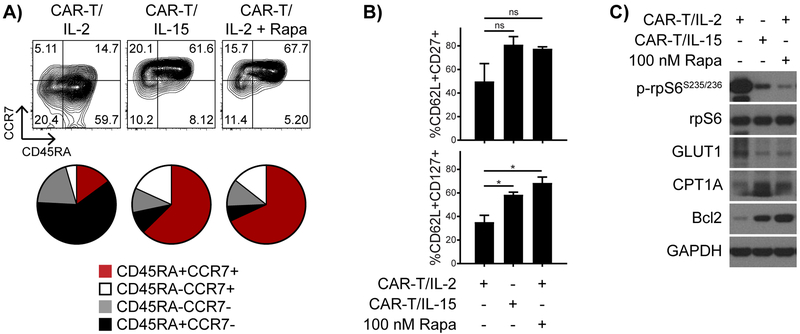
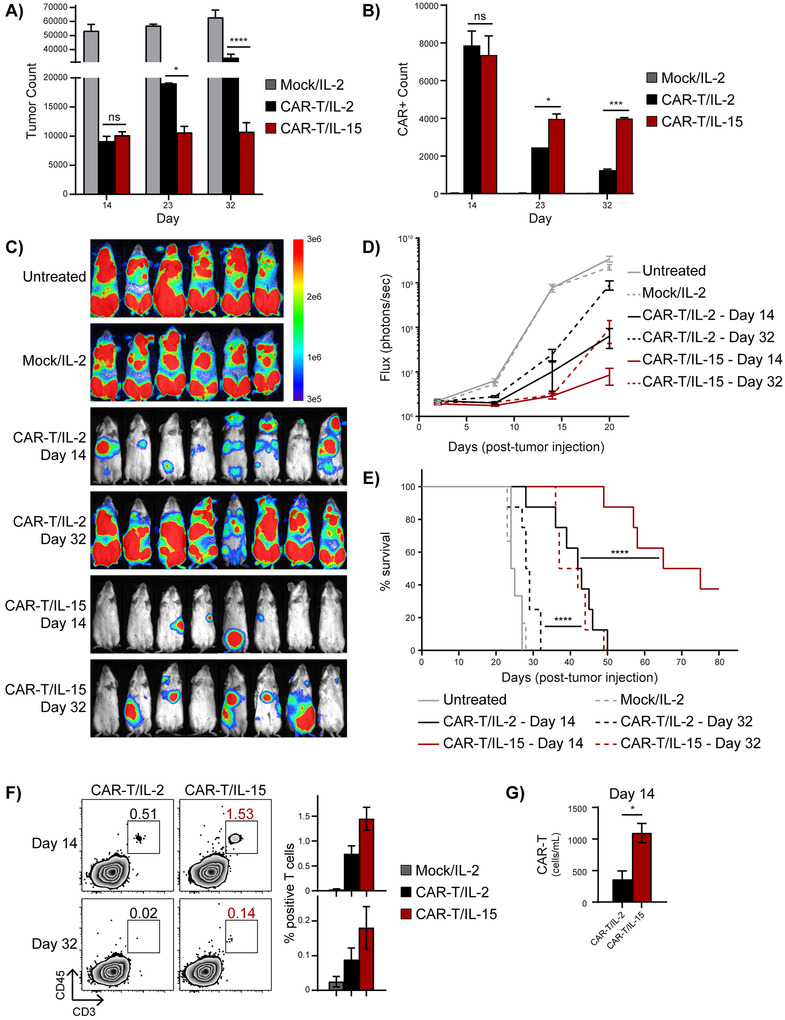
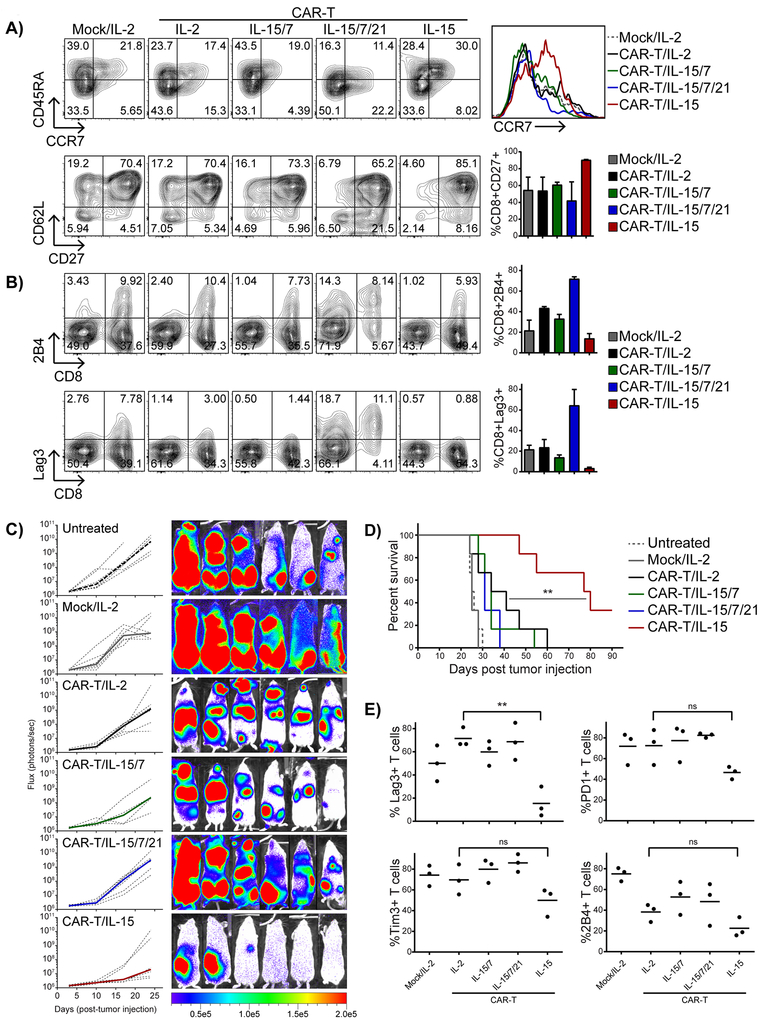
Improvements in the quality and fitness of chimeric antigen receptor (CAR)-engineered T cells, through CAR design or manufacturing optimizations, could enhance the therapeutic potential of CAR-T cells. One parameter influencing the effectiveness of CAR-T cell therapy is the differentiation status of the final product: CAR-T cells that are less-differentiated and less exhausted are more therapeutically effective. In the current study, we demonstrate that CAR-T cells expanded in IL15 (CAR-T/IL15) preserve a less-differentiated stem cell memory (Tscm) phenotype, defined by expression of CD62L+CD45RA+ CCR7+, as compared with cells cultured in IL2 (CAR-T/IL2). CAR-T/IL15 cells exhibited reduced expression of exhaustion markers, higher antiapoptotic properties, and increased proliferative capacity upon antigen challenge. Furthermore, CAR-T/IL15 cells exhibited decreased mTORC1 activity, reduced expression of glycolytic enzymes and improved mitochondrial fitness. CAR-T/IL2 cells cultured in rapamycin (mTORC1 inhibitor) shared phenotypic features with CAR-T/IL15 cells, suggesting that IL15-mediated reduction of mTORC1 activity is responsible for preserving the Tscm phenotype. CAR-T/IL15 cells promoted superior antitumor responses in vivo in comparison with CAR-T/IL2 cells. Inclusion of cytokines IL7 and/or IL21 in addition to IL15 reduced the beneficial effects of IL15 on CAR-T phenotype and antitumor potency. Our findings show that IL15 preserves the CAR-T cell Tscm phenotype and improves their metabolic fitness, which results in superior in vivo antitumor activity, thus opening an avenue that may improve future adoptive T-cell therapies.


Conflict of interest statement

Conflict of Interest

Patents associated with IL13Rα2-CAR-T have been licensed by Mustang Bio., Inc., for which S.J.F. and C.E.B. receive royalty payments. All other authors declare no potential conflicts of interest.

Figures

Figure 1:
Figure 1:. IL15 enriches for CAR-T cells with Tscm phenotype.
Flow cytometric analysis compares frequency of Tscm population over time in CD19-CAR-T cells cultured in IL2 or IL15 as A) CD45RA+ CCR7+ T cells summarized in pie charts and B) CD62L+CD27+ and CD62L+CD127+ shown in graphs. Data shown is representative of three independent donors. C) Quantitative RT-PCR analysis of key genes upregulated in T cells with Tscm phenotype for CD4+ and CD8+ CAR-T cells. D) Heat map depicts global changes in expression of genes regulating T cell differentiation shown as robust multichip analysis (RPKM)-normalized intensity for CD4+ T cells on day 14 (left panel) and fold change from day 14 to day 32 for CD8+ T cells (right panel). E) Quantitative RT-PCR analysis of indicated effector genes in CD4+ and CD8+ T cells. F) Robust multichip analysis (RPKM)-normalized intensity of genes involved in effector function in CD8+ T cells. G) Effector function measured by flow cytometric analysis of IFNγ+ CAR-T cells after co-culturing CAR-T cells with target cells (CD19+; Raji,) at a 1:1 Effector:Target ratio for 5 hours. Data is representative of two independent studies. Data are presented as mean ± SEM and *p < 0.05; **p < 0.01; ***p < 0.001; ****p < 0.0001.
Figure 2:
Figure 2:. IL15-cultured T cells represent a distinct, less-differentiated T cell subset.
A) Hierarchical clustering shows global gene expression changes in CD8+ T cells between the two culture conditions (P< 0.01, false discovery rate <5%, Benjamini-Hochberg’s method). Yellow and blue colors indicate increased and decreased expression, respectively. B) Multidimensional scaling (MDS) analysis depicts number of genes differentially regulated in CD8+ T cells cultured in IL2 or IL15. (P< 0.01 (t test), false discovery rate <5%; twofold change in expression).
Figure 3:
Figure 3:. IL15 promotes T-cell survival and prevents up-regulation of inhibitory receptors associated with T cell exhaustion.
A) Intracellular active caspase-3 was measured by flow cytometry in CD19-CAR-T cells cultured in IL2 or IL15. Graph displays percent of CD3+ cells expressing active caspase-3 from three different donors (left), and one representative density plot of intracellular caspase-3 staining on day 32 (right). B) Western blot analysis shows amount of anti-apoptotic protein Bcl2 in CAR-T cells cultured in IL2 or IL15 over time. C) Flow cytometric analysis shows frequency of CAR-T cells positive for inhibitory receptors Lag3 (top) and 2B4 (bottom). Flow cytometry plots over time from one representative donor are shown (left), and bar graphs are presented as mean ± SEM from three independent donors. D) Robust multichip analysis (RPKM)-normalized intensity of LAG3 and 2B4 (CD244) genes in CD8+ T cells at Day 14 or Day 32 (top panel) and genes involved in inhibitory and suppressive function in CD4+ T cells on Day 14 (bottom panel). Data is representative of three independent studies. *p < 0.05; **p < 0.01; ***p < 0.001.
Figure 4:
Figure 4:. IL15 reduces mTORC1 activity and decreases expression of glycolytic enzyme genes with a concomitant increase in fatty acid oxidation genes.
A) Immunoblot analysis of indicated proteins in CD19-CAR-T cells cultured in IL2 or IL15 on day 23. GAPDH was used as a loading control. B) Quantitative RT-PCR analysis of Glut1 (SLC2A1) and CPT1a expression in CD4+ and CD8+ T cells. Results are presented relative to actin gene. C) Heat map of RNA-sequencing analysis of sorted CD8+ T cell subsets, highlighting changes in the canonical genes associated with fatty acid oxidation (FAO) (left) or glycolysis (right) represented as fold change between days 14–32. Red indicates greatest increase and white indicates no change. D) OCR of CD19-CAR-T/IL2 and CD19-CAR-T/IL15 cells in response to indicated mitochondrial modulators: oligomycin; FCCP; rotenone. E) Bar graph represents the differences in mean fluorescent intensity (MFI) of mitochondria potential (TMRM) (left panel) and glucose uptake (2-NBDG) measurements in CAR-T cells. Data is representative of two independent studies.
Figure 5:
Figure 5:. Reduced mTORC1 activity is responsible for IL15 maintenance of a Tscm phenotype.
A) Flow cytometry analysis shows changes in CD45RA+ CCR7+ CD19-CAR-T cells cultured in IL2, IL15 or IL2 + rapamycin (100nM) (top), summarized in a pie chart (bottom). B) Bar graph shows changes in the frequency of CD62L+CD27+ and CD62L+CD127+ T cells cultured in above conditions. Data presented are mean ± SEM of two experiments. C) Immunoblot analysis of p-rpS6, rpS6, Glut1, CPT1a, and Bcl2 proteins confirms reduced mTORC1 and phenotypic similarities in T cells cultured in IL15 and IL2 + rapamycin. GAPDH was used as a loading control. Data is representative of two independent studies.
Figure 6:
Figure 6:. CAR-T cells cultured in IL15 exhibit enhanced proliferative capacity with superior antitumor activity:
A) CD19-CAR-T cells were co-cultured with tumor cells (CD19+; Raji) at a 1:1 Effector:Target ratio for 7 days, then number of A) tumor cells and B) CAR-T cells were counted by flow cytometry and graphed. Mice bearing Raji-ffLuc lymphoma (0.5×10⁶) were untreated or treated with 1×10⁶ mock or CD19-CAR-T cells three days after tumor engraftment. T cells were thawed and injected i.v. after cryopreservation at the indicated number of days in ex vivo culture. C) Bioluminescent images compare tumor progression 19 days after adoptive transfer of T cells (n=6–8 mice per group). D) Bioluminescent flux plot quantifying tumor burden in response to different treatment groups over time. Data is shown as mean ± SEM. E) Kaplan-Meier survival curve depicts overall survival. F) Frequency of circulating CAR-T cells 10 days post CAR-T cell therapy identified by flow cytometry using anti-human CD3 and CD45 (left) and bar graph summarizes the frequency of human T cells identified in each group (right). G) Bar graph summarizes the number of CAR-T cells/ml of blood from day 14 groups. Data are presented as mean ± SEM of 6–8 individual animals and two independent studies. *p < 0.05; **p < 0.01; ***p < 0.001; ****p < 0.0001.
Figure 7:
Figure 7:. Inclusion of additional γc cytokines with IL15 reduces antitumor activity.
A) Flow cytometric analysis of CD19-CAR-T cells cultured in different cytokine combination 18–20 days after initiation of culture showing frequency of CD45RA+ CCR7+ and CD27+ CD62L+ CAR-T cells (left). Histogram plot showing CCR7 expression in total CD8+ T cells (right). Bar graph shows percentage of CD27 expressing CD8+ T cells. B) Flow cytometric analysis of indicated inhibitory molecules gated on CAR-T cells (left). Bar graphs showing frequency of CD8+ T cells expressing 2B4 (top) and Lag3 (bottom). C) Bioluminescent flux plot (left) and images (right) and D) Kaplan-Meier survival curves compares tumor progression over time in treated and untreated groups (n=6–8 mice per group). Representative of two independent experiments. E) Comparison of inhibitory receptor expressions on CAR-T cells harvested from animals 17 days post therapy (n=3–5 mice per group). Data is representative of two independent studies.

Similar articles

Cited by

References

    1. Kawalekar OU, OC RS, Fraietta JA, Guo L, McGettigan SE, Posey AD Jr., et al. Distinct Signaling of Coreceptors Regulates Specific Metabolism Pathways and Impacts Memory Development in CAR T Cells. Immunity 2016;44:712 - PubMed
    1. Xu Y, Zhang M, Ramos CA, Durett A, Liu E, Dakhova O, et al. Closely related T-memory stem cells correlate with in vivo expansion of CAR.CD19-T cells and are preserved by IL-7 and IL-15. Blood 2014;123:3750–9 - PMC - PubMed
    1. Zhang H, Snyder KM, Suhoski MM, Maus MV, Kapoor V, June CH, et al. 4–1BB is superior to CD28 costimulation for generating CD8+ cytotoxic lymphocytes for adoptive immunotherapy. Journal of immunology (Baltimore, Md : 1950) 2007;179:4910–8 - PMC - PubMed
    1. Song DG, Ye Q, Carpenito C, Poussin M, Wang LP, Ji C, et al. In vivo persistence, tumor localization, and antitumor activity of CAR-engineered T cells is enhanced by costimulatory signaling through CD137 (4–1BB). Cancer research 2011;71:4617–27 - PMC - PubMed
    1. Wang D, Aguilar B, Starr R, Alizadeh D, Brito A, Sarkissian A, et al. Glioblastoma-targeted CD4+ CAR T cells mediate superior antitumor activity. JCI insight 2018;3 - PMC - PubMed

Publication types

Substances