

Comment
doi: 10.1073/pnas.1818033116.
Epub 2019 Mar 19.
A squared standard error is not a measure of individual differences
Affiliations
- PMID: 30890640
- PMCID: PMC6452686
- DOI: 10.1073/pnas.1818033116
Item in Clipboard
Comment
A squared standard error is not a measure of individual differences
Proc Natl Acad Sci U S A.
.
No abstract available
Conflict of interest statement
The authors declare no conflict of interest.
Figures
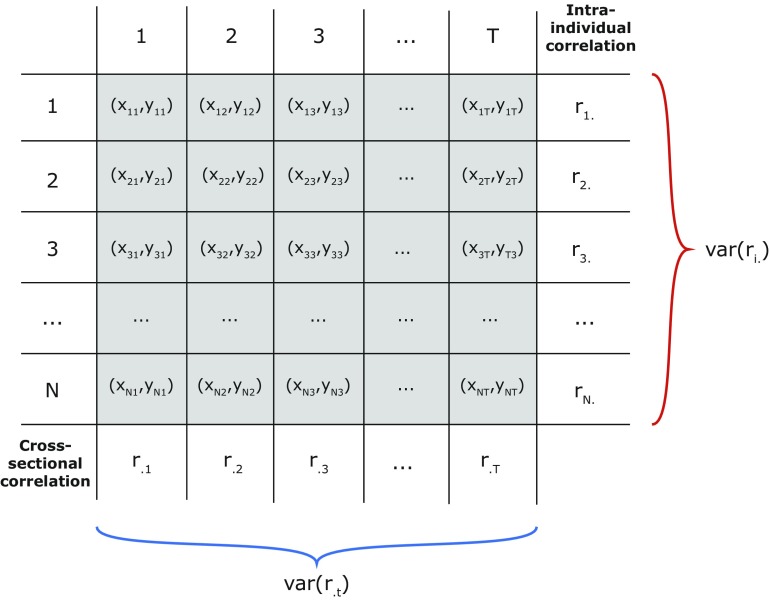
Each cell in the data matrix contains a bivariate observation for person i at occasion t, with i = 1, …, N and t = 1, …, T. The right-hand margin contains intraindividual correlations per person, ri.. The variance of this consists of (i) the variance of the true intraindividual correlations, ρi. (i.e., random effect), and (ii) the variance of sampling error, ri.−ρi.. The latter goes to zero as the number of occasions, T, increases. The bottom margin contains the cross-sectional correlation estimates per occasion, r.t. Under the assumption of stationarity (ρ.t = ρ..), the variance of this consists of sampling error variance only and will go to zero as the number of individuals, N, increases.
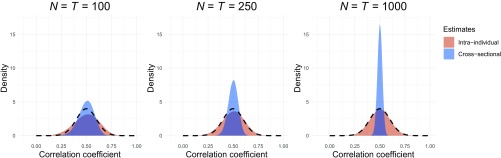
The effect of sample size (number of persons, N, and number of time points, T) on the distributions of (i) intraindividual correlation estimates, ri. (pink), and (ii) cross-sectional correlation estimates, r.t (blue). For simplicity, the cross-sectional correlation and the average within-person correlation are both 0.5; the dashed density represents the random effect (i.e., true individual differences in intraindividual correlation). As sample size increases, sampling variance goes to 0 so that (i) the pink distribution coincides with the true dashed density, and (ii) the blue distribution becomes increasingly narrow. The var(ri.)/var(r.t) ratio changes from 2.62 to 5.21 to 17.
Comment in
-
Reply to Hamaker and Ryan: Within-sample temporal instability in cross-sectional estimates.Proc Natl Acad Sci U S A. 2019 Apr 2;116(14):6546-6547. doi: 10.1073/pnas.1820222116. Epub 2019 Mar 19. Proc Natl Acad Sci U S A. 2019. PMID: 30890639 Free PMC article. No abstract available.
Comment on
-
Lack of group-to-individual generalizability is a threat to human subjects research.Proc Natl Acad Sci U S A. 2018 Jul 3;115(27):E6106-E6115. doi: 10.1073/pnas.1711978115. Epub 2018 Jun 18. Proc Natl Acad Sci U S A. 2018. PMID: 29915059 Free PMC article. Clinical Trial.
References
-
- Hamaker EL. Why researchers should think “within-person”: A paradigmatic rationale. In: Mehl MR, Conner TS, editors. Handbook of Research Methods for Studying Daily Life. Guilford Press; New York: 2012. pp. 43–61.
-
- Molenaar PCM. A manifesto on psychology as idiographic science: Bringing the person back into scientific psychology, this time forever. Measurement. 2004;2:201–218.
-
- Schmitz B. Auf der Suche nach dem verlorenen Individuum: Vier Theoreme zur Aggregation von Prozessen. Psychol Rundsch. 2000;51:83–92. German.
-
- Everitt BS, Skrondal A. The Cambridge Dictionary of Statistics. 4th Ed Cambridge Univ Press; New York: 2010.
Publication types
MeSH terms
LinkOut - more resources
Full Text Sources
