. 2019 Apr 30;132(9):jcs224311.
doi: 10.1242/jcs.224311.

XMAP215 promotes microtubule-F-actin interactions to regulate growth cone microtubules during axon guidance in Xenopuslaevis

Affiliations

XMAP215 promotes microtubule-F-actin interactions to regulate growth cone microtubules during axon guidance in Xenopuslaevis

Paula G Slater et al. J Cell Sci. .

Abstract

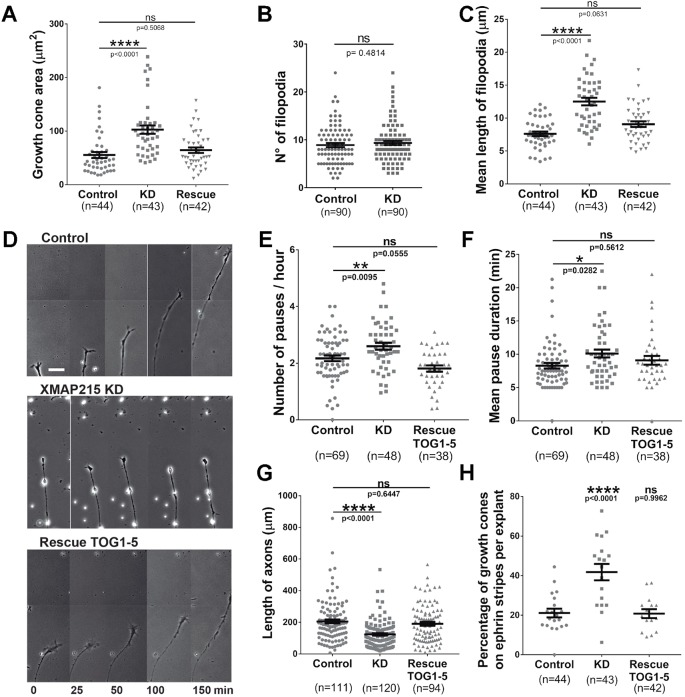
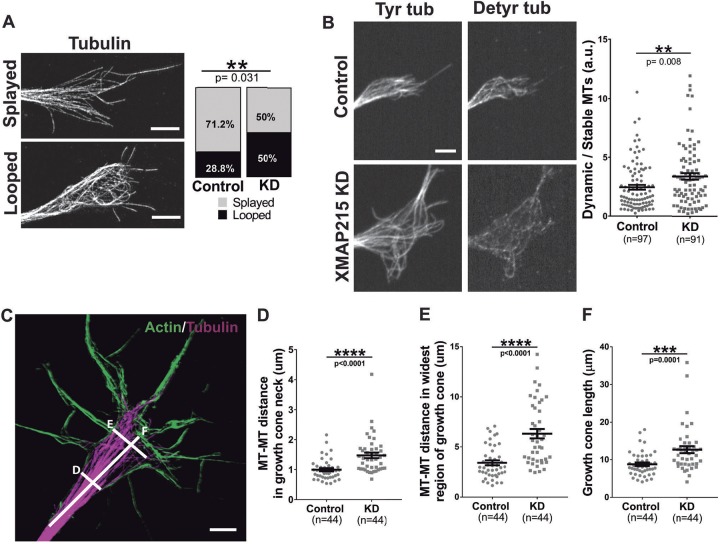
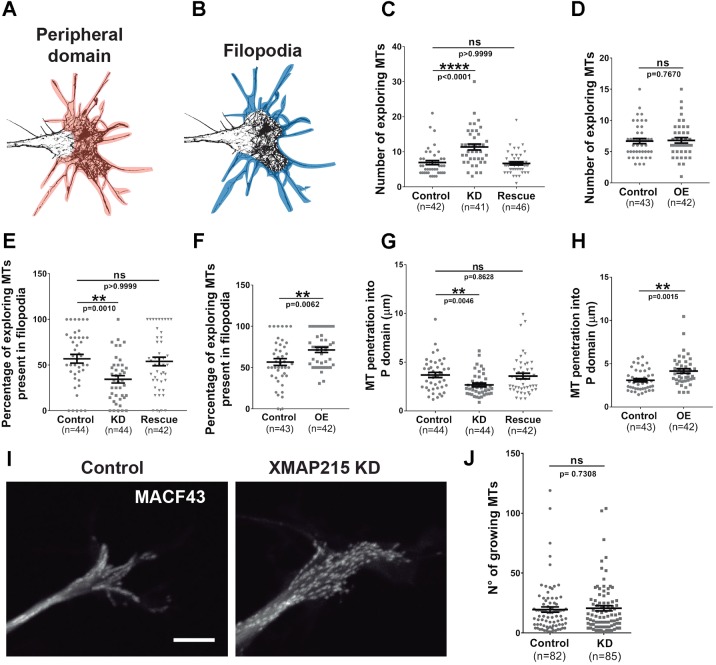
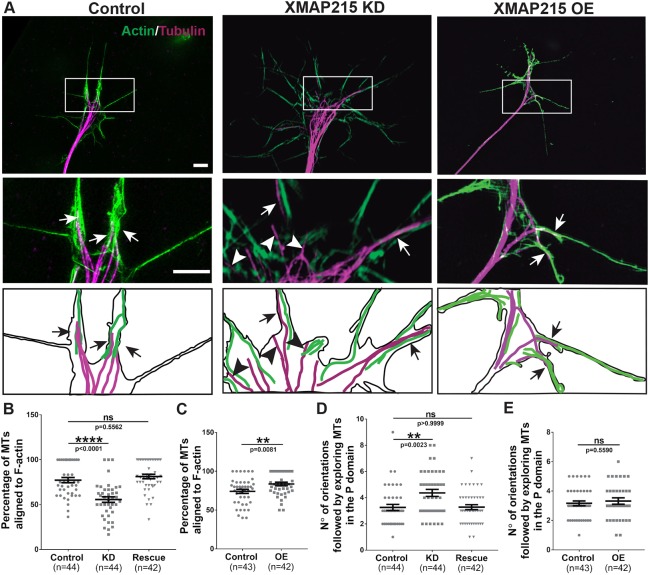
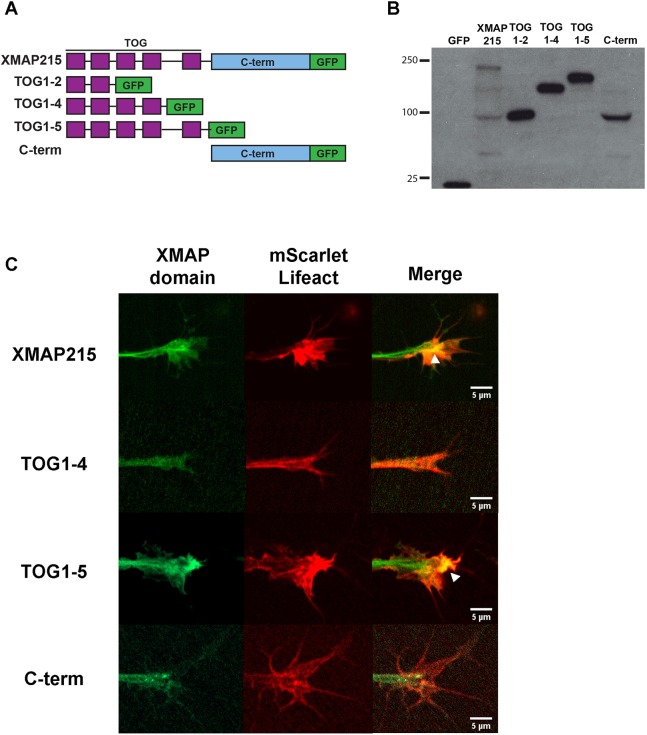
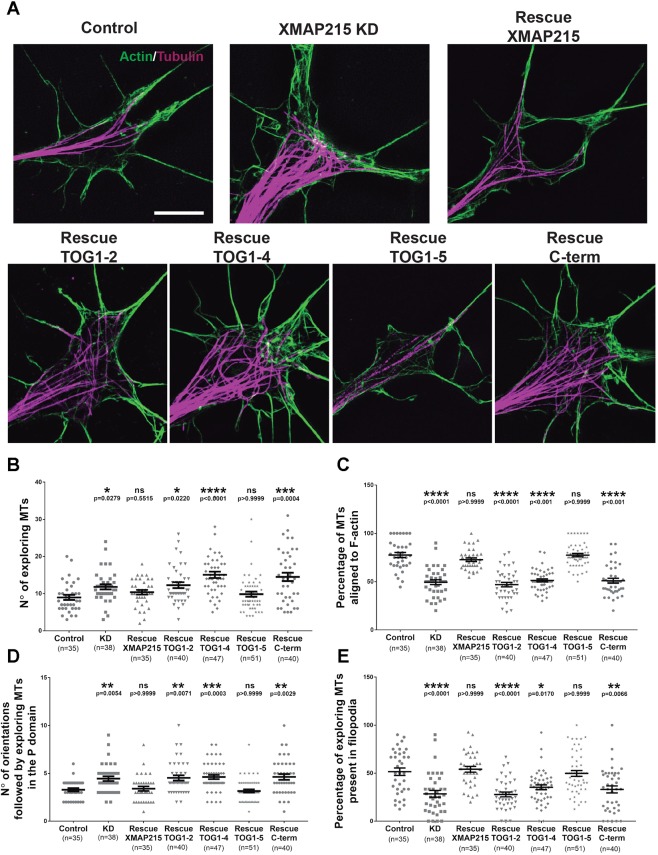
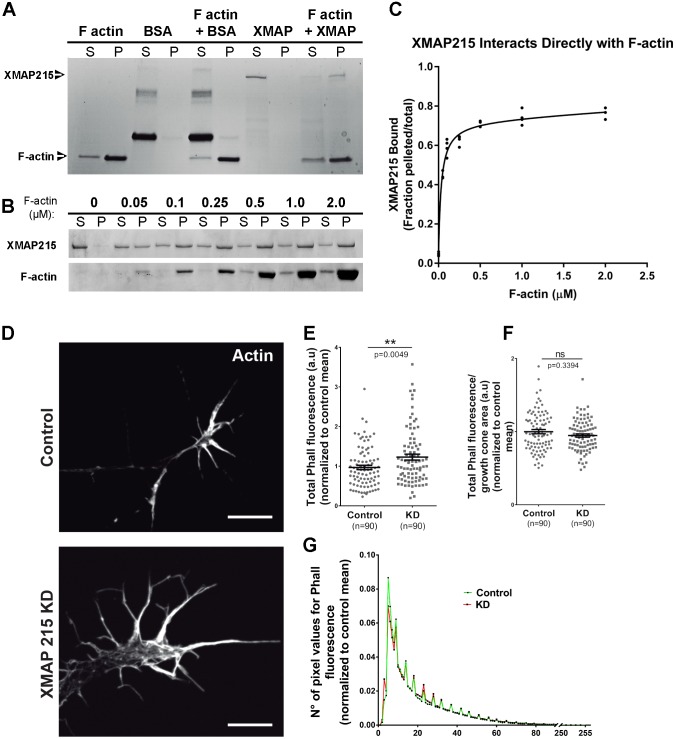
It has long been established that neuronal growth cone navigation depends on changes in microtubule (MT) and F-actin architecture downstream of guidance cues. However, the mechanisms by which MTs and F-actin are dually coordinated remain a fundamentally unresolved question. Here, we report that the well-characterized MT polymerase, XMAP215 (also known as CKAP5), plays an important role in mediating MT-F-actin interaction within the growth cone. We demonstrate that XMAP215 regulates MT-F-actin alignment through its N-terminal TOG 1-5 domains. Additionally, we show that XMAP215 directly binds to F-actin in vitro and co-localizes with F-actin in the growth cone periphery. We also find that XMAP215 is required for regulation of growth cone morphology and response to the guidance cue, Ephrin A5. Our findings provide the first strong evidence that XMAP215 coordinates MT and F-actin interaction in vivo We suggest a model in which XMAP215 regulates MT extension along F-actin bundles into the growth cone periphery and that these interactions may be important to control cytoskeletal dynamics downstream of guidance cues. This article has an associated First Person interview with the first author of the paper.

Keywords: +TIP; CKAP5; Cytoskeleton; F-actin alignment; Growth cones; Plus-end tracking proteins; Super resolution.


Conflict of interest statement

Competing interestsThe authors declare no competing or financial interests.

Figures

Fig. 1.
Fig. 1.
XMAP215 KD leads to global growth cone phenotypic changes and guidance defects. (A–C). XMAP215 KD induces growth cone pausing-like morphology. XMAP215 KD increases growth cone area (A), has no effect on number of filopodia (B), and increases the mean length of filopodia (C). See Fig. S1C for more information regarding how the quantifications were performed. (D–F). XMAP215 KD increases number and duration of growth cone pauses. (D) Time-lapse montage of representative axons from control, XMAP215 KD and XMAP215 KD rescued by expression of TOG1–5. Scale bar: 25 µm. XMAP215 KD increases the number of pauses per hour (E) and the mean pause duration (F). (G,H) TOG1–5 rescues the axon outgrowth parameters affected by XMAP215 KD. (G) XMAP215 KD decreases the length of axons. See Fig. S2A for more information regarding how the quantifications were performed. (H) XMAP215 KD increases the percentage of growth cones on Ephrin A5 stripes per explant. See Fig. S2C for representative images. *P<0.05; **P<0.01; ****P<0.0001; ns, not significant, from a one-way ANOVA analysis comparing multiple conditions, and from a Student's t-test when comparing XMAP215 KD to control. Data presented as mean±s.e.m.
Fig. 2.
Fig. 2.
XMAP215 KD disrupts MT organization in the growth cone. (A) Representative SIM images of growth cone MTs considered as ‘splayed’ and ‘looped’. XMAP215 KD increases the MT looped morphology compared to controls. Scale bar: 3 µm. (B) Representative growth cone images of control and XMAP215 KD neural explants immunostained for tyrosinated tubulin (Tyr tub) and detyrosinated tubulin (Detyr tub) to label dynamic versus stable MTs, respectively. XMAP215 KD increases the dynamic:stable MT ratio. Scale bar: 5 µm. a.u., arbitrary units. (C) Representative SIM image of growth cones stained for actin and tubulin. The labeled lines letter indicate how the MT measurements were performed for the corresponding plots in D–F. Scale bar: 8 µm. (D–F) Quantification of the different MT parameters. XMAP215 KD increases the MT–MT distance in growth cone neck (D), the MT–MT distance in the growth cone's widest region (E), as well as the growth cone length (F). **P<0.01; ***P<0.001; ****P<0.0001; ns, not significant, from a Student's t-test comparing XMAP215 KD to control. Data presented as mean±s.e.m.
Fig. 3.
Fig. 3.
XMAP215 promotes penetration of MTs into growth cone filopodia. (A,B) Growth cone mask images outlining the growth cone peripheral domain colored in orange (A), and the filopodia colored in blue (B). (C–H). Quantification of MT penetration into the actin-rich peripheral domain of the growth cone after XMAP215 knockdown (KD) (C,E,G) or overexpression (OE) (D,F,H). XMAP215 KD increases the number of exploring MTs (C), while decreasing the percentage of exploring MTs present in filopodia (E), as well as MT penetration into the peripheral (P) domain (G), compared to controls. XMAP215 KD effects were rescued by co-expression of KD-resistant XMAP215–GFP mRNA (C,E,G). See Fig. S3 for more information regarding how the quantifications were performed. **P<0.01; ****P<0.0001; ns, not significant, from a one-way ANOVA analysis comparing XMAP215 KD, XMAP215 rescue and control, and from a Student's t-test comparing XMAP215 OE to control. (I) Micrograph overlays of GFP–MACF43 tracks from a 1 m time-lapse image series in control and XMAP215 KD neural tube explant growth cones. Scale bar: 8 µm. (J) No difference was observed between XMAP215 KD and control when comparing the number of growing MTs. ns, not significant from a Student's t-test analysis. Data presented as mean±s.e.m.
Fig. 4.
Fig. 4.
XMAP215 is required for normal MT–F-actin alignment in growth cones. (A) Top: representative SIM images of growth cones from control, XMAP215 KD and XMAP215 OE neural explants stained for actin and tubulin. Scale bar: 8 µm. Middle insets: magnification of the boxed region of interest in the upper panels. Scale bar: 3 µm. Arrows point to MTs that are aligned with F-actin, while arrowheads point to exploring MTs that are not aligned with F-actin. Bottom insets: ‘camera lucida’-type depictions with subtracted background and highlighted MTs and F-actin. (B,C) XMAP215 KD decreases (B) while XMAP215 OE increases (C) the percentage of exploring MTs aligned to F-actin, compared to controls. (D,E). XMAP215 KD increases (D) while XMAP215 OE does not affect (E) the number of orientations followed by exploring MTs in the growth cone peripheral (P) domain. **P<0.01; ****P<0.0001; ns, not significant, from a one-way ANOVA analysis comparing multiple conditions, and from Student's t-test comparing XMAP215 OE to control. Data presented as mean±s.e.m.
Fig. 5.
Fig. 5.
The N-terminal TOG1–5 domains of XMAP215 are necessary and sufficient to localize to F-actin in the growth cone periphery. (A) Schematic representation of the GFP-tagged XMAP215 domain constructs used, showing full-length XMAP215, XMAP215 domains TOG1–2, TOG1–4, TOG1–5 and C-terminal region (C-term). (B) Western blot showing the expression of the different XMAP215 domain constructs in Xenopus embryo lysates. (C) Representative confocal images showing localization of GFP-tagged XMAP215 mutants (green) and F-actin (red) in the growth cone. White arrowhead in full-length XMAP215 and TOG1–5 merged panels denote XMAP215 and actin fluorescence co-localization. Scale bar: 5 µm. (See Movies 1–4).
Fig. 6.
Fig. 6.
The N-terminal of XMAP215 is necessary and sufficient to promote MT–F-actin alignment. (A) Representative SIM images of growth cones from control, XMAP215 KD and XMAP215 KD rescue with the XMAP215 domain constructs as indicated. Scale bar: 5 µm. (B–E) Determination of the XMAP215 domain responsible for MT–F-actin alignment. Expression of TOG1–5, but not TOG1–2, TOG1–4 or C-term, rescues the increase in the number of exploring MTs (B), the decrease in the percentage of MTs aligned to F-actin (C), the increase in the number of orientations followed by exploring MTs in the peripheral (P) domain (D), and the decrease in the percentage of exploring MTs present in filopodia (E), induced by XMAP215 KD. *P<0.05; **P<0.01; ***P<0.001; ****P<0.0001; ns, not significant, from a one-way ANOVA analysis. Data presented as mean±s.e.m.
Fig. 7.
Fig. 7.
XMAP215 can directly bind to F-actin but does not affect local F-actin density. (A,B). XMAP215–F-actin co-sedimentation assays. Coomassie Blue-stained gels from binding assays containing a constant F-actin concentration (A) or increasing F-actin concentrations (B), show direct binding of XMAP215 to F-actin. BSA was used as a negative control. S, supernatant; P, pellet. (C) XMAP215–F-actin binding curve obtained by plotting the percentage of XMAP215 present in the pelleted fraction over the total, against the F-actin concentration. Data points from multiple experiments plotted for each concentration. Non-linearly fit binding curve displays a Kd value at a sub-micromolar binding affinity, 0.032±0.0051 µM (mean±s.e.m.). Bmax=0.682±0.0283. (D) Representative phalloidin-stained images of growth cones from control and XMAP215 KD neural explants. Scale bars: 10 µm. (E–G) Quantification of F-actin amount and distribution. XMAP215 KD increases total phalloidin fluorescence (E), while it does not affect phalloidin fluorescence normalized by growth cone area (F) or the number of pixel values for phalloidin fluorescence (G). a.u., arbitrary units; Phall, phalloidin. **P<0.01; ns, not significant, from Student's t-test comparing XMAP215 KD to control. Data presented as mean±s.e.m.

Similar articles

Cited by

References

    1. Adikes R. C., Hallett R. A., Saway B. F., Kuhlman B. and Slep K. C. (2018). Control of microtubule dynamics using an optogenetic microtubule plus end–F-actin cross-linker. J. Cell Biol. 217, 779-793. 10.1083/jcb.201705190 - DOI - PMC - PubMed
    1. Al-Bassam J. and Chang F. (2011). Regulation of microtubule dynamics by TOG-domain proteins XMAP215/Dis1 and CLASP. Trends Cell Biol. 21, 604-614. 10.1016/j.tcb.2011.06.007 - DOI - PMC - PubMed
    1. Al-Bassam J., Larsen N. A., Hyman A. A. and Harrison S. C. (2007). Crystal structure of a TOG domain: conserved features of XMAP215/Dis1-family TOG domains and implications for tubulin binding. Structure 15, 355-362. 10.1016/j.str.2007.01.012 - DOI - PubMed
    1. Alves-Silva J., Sánchez-Soriano N., Beaven R., Klein M., Parkin J., Millard T. H., Bellen H. J., Venken K. J. T., Ballestrem C. and Kammerer R. A. (2012). Spectraplakins promote microtubule-mediated axonal growth by functioning as structural microtubule-associated proteins and EB1-dependent +TIPs (tip interacting proteins). J. Neurosci. 32, 9143-9158. 10.1523/JNEUROSCI.0416-12.2012 - DOI - PMC - PubMed
    1. Applegate K. T., Besson S., Matov A., Bagonis M. H., Jaqaman K. and Danuser G. (2011). plusTipTracker: quantitative image analysis software for the measurement of microtubule dynamics. J. Struct. Biol. 176, 168-184. 10.1016/j.jsb.2011.07.009 - DOI - PMC - PubMed

Publication types

MeSH terms