. 2019 Mar 19;10(1):1251.
doi: 10.1038/s41467-019-09182-1.

Staged developmental mapping and X chromosome transcriptional dynamics during mouse spermatogenesis

Affiliations

Staged developmental mapping and X chromosome transcriptional dynamics during mouse spermatogenesis

Christina Ernst et al. Nat Commun. .

Abstract

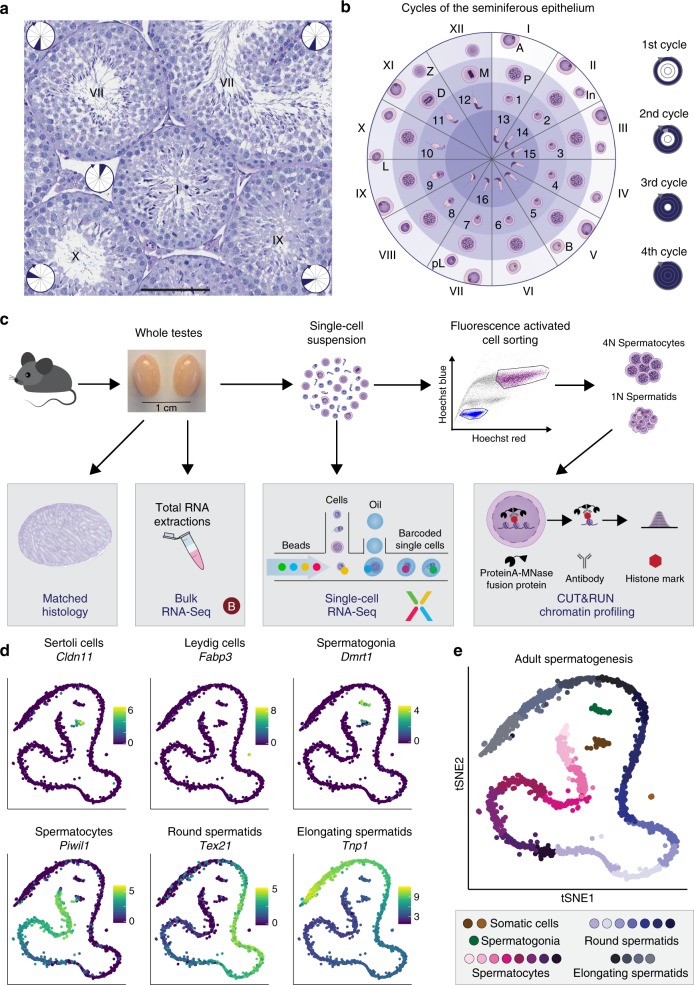
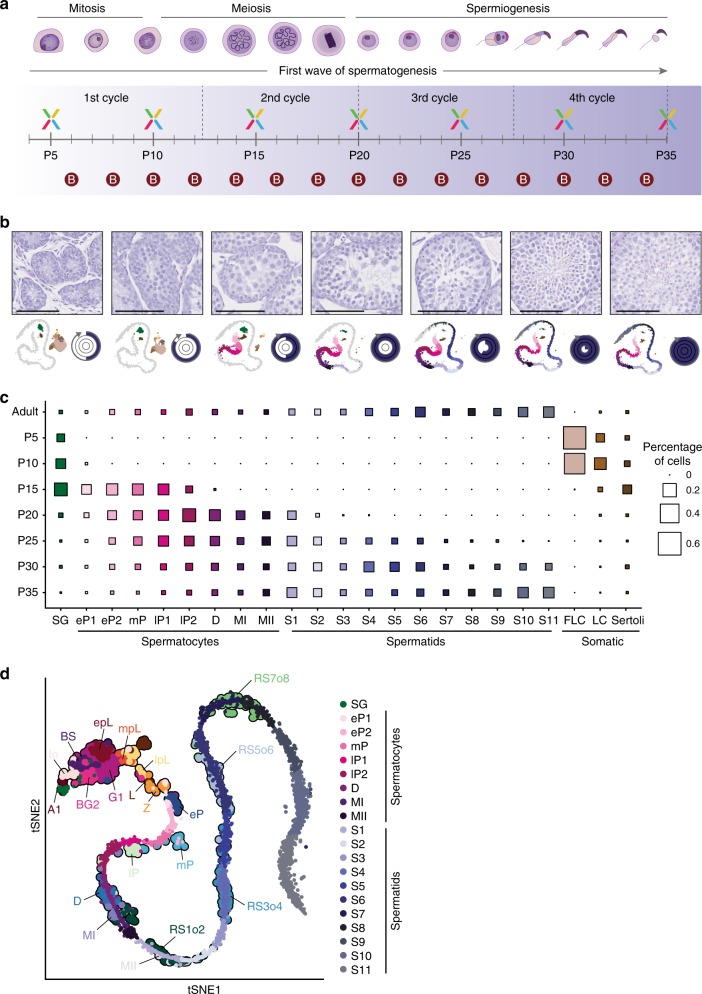
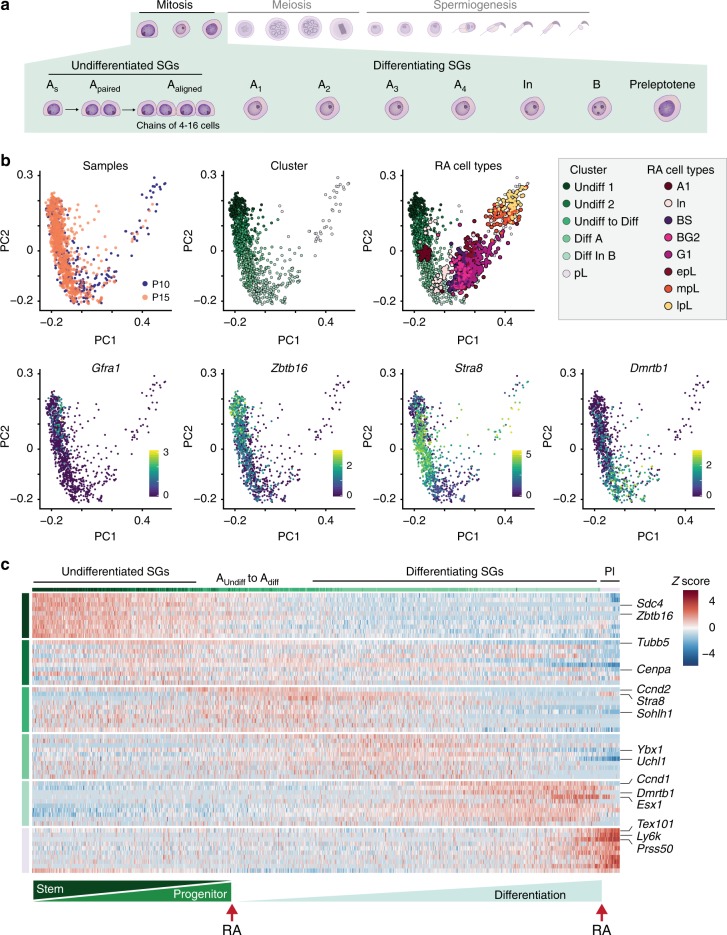
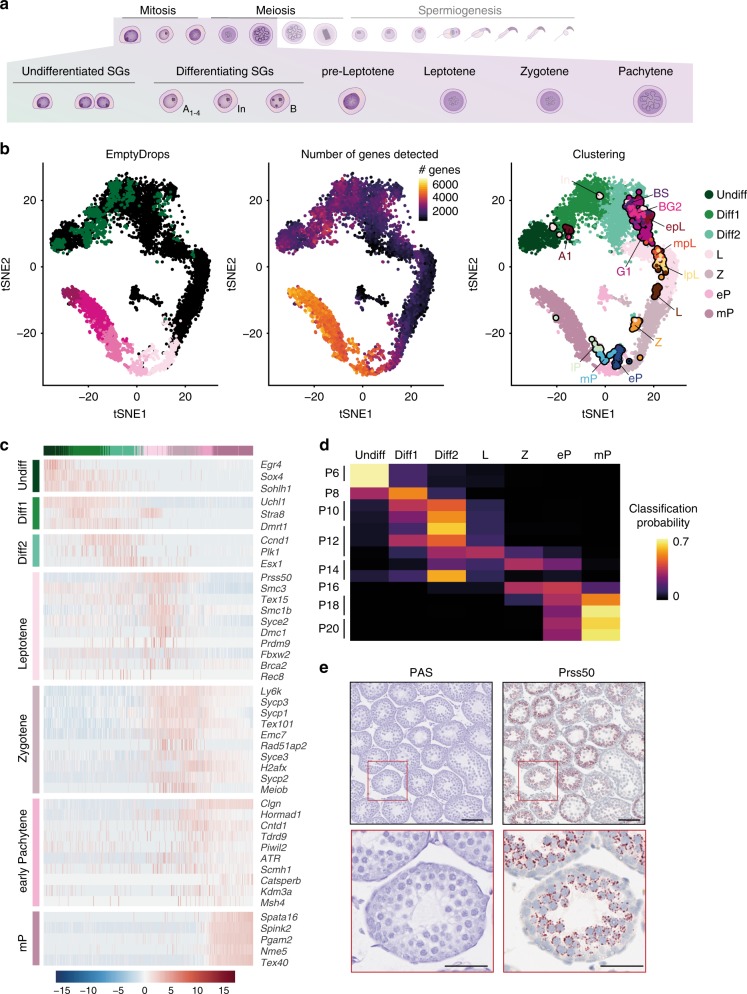
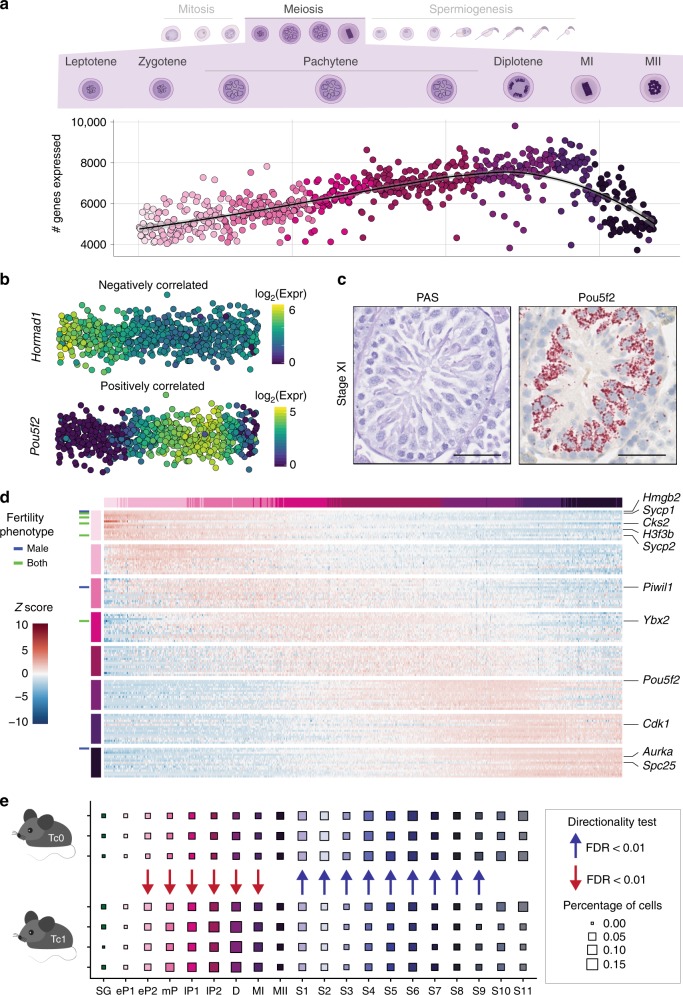
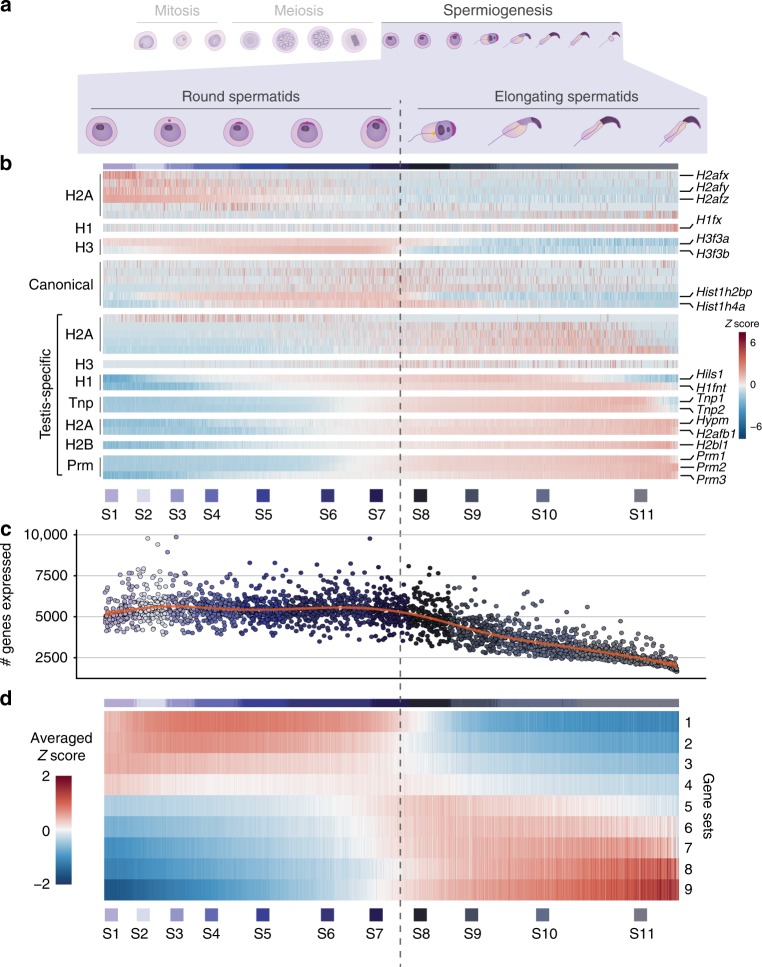
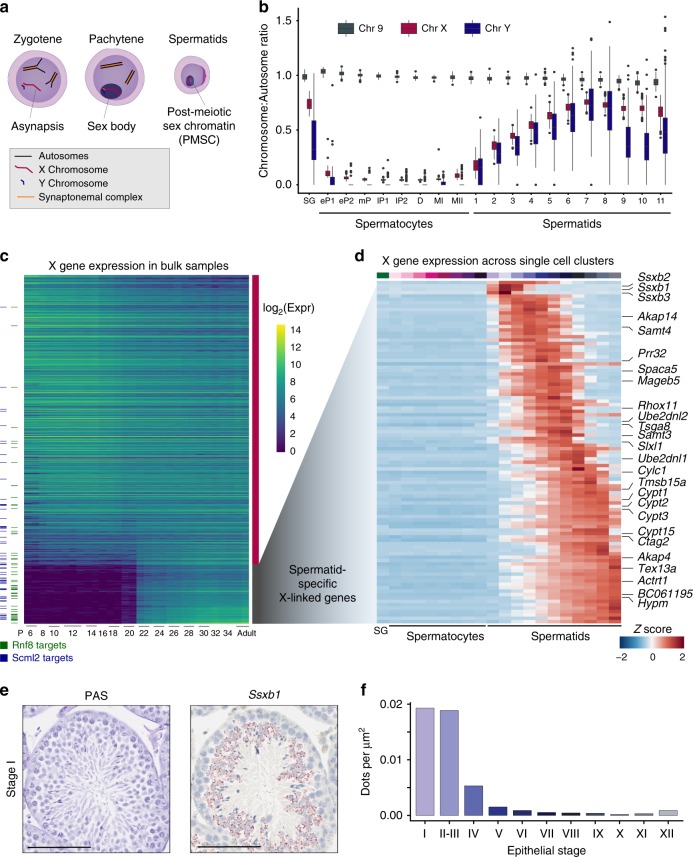
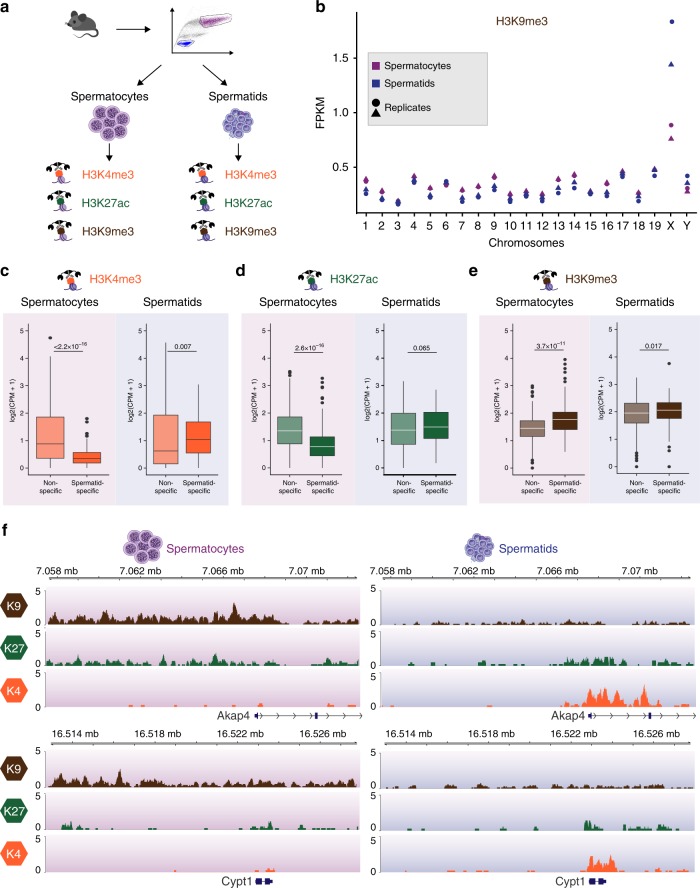
Male gametes are generated through a specialised differentiation pathway involving a series of developmental transitions that are poorly characterised at the molecular level. Here, we use droplet-based single-cell RNA-Sequencing to profile spermatogenesis in adult animals and at multiple stages during juvenile development. By exploiting the first wave of spermatogenesis, we both precisely stage germ cell development and enrich for rare somatic cell-types and spermatogonia. To capture the full complexity of spermatogenesis including cells that have low transcriptional activity, we apply a statistical tool that identifies previously uncharacterised populations of leptotene and zygotene spermatocytes. Focusing on post-meiotic events, we characterise the temporal dynamics of X chromosome re-activation and profile the associated chromatin state using CUT&RUN. This identifies a set of genes strongly repressed by H3K9me3 in spermatocytes, which then undergo extensive chromatin remodelling post-meiosis, thus acquiring an active chromatin state and spermatid-specific expression.


Conflict of interest statement

The Authors declare no Competing Interests.

Figures

Fig. 1
Fig. 1
Single-cell RNA-Seq captures a continuum of germ cell-types. a Periodic Acid Schiff (PAS)-stained testis cross-section showing a number of seminiferous tubules at different epithelial stages (displayed as Roman numerals). Within each tubule, the inset circle refers to the corresponding section in (b). Scale bar represents 100 µm; original magnification ×20. b Schematic representation of the 12 stages of the seminiferous epithelium in mice. The colour gradient within the circle indicates the differentiation path of germ cells with the layers corresponding to individual cycles of the epithelium. The circle is divided into 12 sections, each corresponding to one epithelial stage displaying the characteristic germ cells. Within each section, cells are positioned across the different layers according to their emergence during consecutive cycles, each being 8.6 days apart with more mature cells moving towards the centre. Cell-types are labelled as: A: type A spermatogonia (SG), In: intermediate SG, B: type B SG, pL: pre-leptotene spermatocytes (SCs), L: leptotene SCs, Z: zygotene SCs, P: pachytene SCs, D: diplotene SCs, M: metaphase I and II, 1–8: round spermatids, 9–16: elongating spermatids. c Overview of the experimental design yielding bulk RNA-Seq, droplet-based scRNA-Seq and chromatin profiling on FACS-purified cells using CUT&RUN from one testis while using the contralateral testis for matched histology. d t-distributed stochastic neighbour embedding (tSNE) representation of scRNA-Seq data from adult B6 mice with the colour gradient representing the expression of known marker genes for two somatic cell-types and the main germ cell-types. The x- and y-axis represent the first and second dimension of tSNE respectively. The colour legend shows log2-transformed, normalised expression counts. e Graph-based clustering (Methods) identifies different sub-stages within major germ cell populations
Fig. 2
Fig. 2
Cell-type classification by mapping the first wave of spermatogenesis. a Schematic representation of the major germ cell-types and their corresponding developmental processes. Spermatogonia differentiate undergoing mitotic cell divisions before forming spermatocytes that divide by meiotic division. Spermatids differentiate throughout spermiogenesis to form mature sperm. The timeline in the lower panel indicates at which point during the first wave of spermatogenesis samples were harvested for the generation of scRNA-Seq (X) or bulk RNA-Seq (B) data. b Representative images of seminiferous tubules from PAS-stained tissue cross-sections from animals harvested for scRNA-Seq at different time-points during the first wave of spermatogenesis. Developmental progression is illustrated as tSNE below with juvenile cells (colours corresponding to clusters depicted in Fig. 1e) mapped to cells isolated from adult mice (grey). The approximate timing of the stage and cycle of the tubule is illustrated in the form of a circle (Fig. 1b). Scale bars represent 100 µm; original magnification ×20 or ×40. c The percentage of cells allocated to each cell cluster for each juvenile and adult sample is represented by the size of squares with the colours corresponding to the clusters depicted in Fig. 1e. Cell clusters were labelled according to morphologically-defined cell-types: SG: spermatogonia, eP1/2: early-pachytene spermatocyte (SC) 1/2, mP: mid-pachytene SC, lP1/2: late-pachytene SC 1/2, D: diplotene SC, MI: meiosis I, MII: meiosis II, S1-S11: step 1–11 spermatids, FLC: Fetal Leydig cells, LC: Leydig cells. d tSNE representation of RA-synchronised cells from Chen et al. mapped to the germ cells from our adult B6 scRNA-Seq data. RA-synchronised cells are labelled throughout the plot as follows: A1: type A1 spermatogonia, In: intermediate spermatogonia, BS: S phase type B spermatogonia, BG2: G2/M phase type B spermatogonia, G1: G1 phase pre-leptotene SC, epL: early-S phase pre-leptotene SC, mpL: mid-S phase pre-leptotene SC, lpL: late-S phase pre-leptotene SC, L: leptotene SC, Z: zygotene SC, eP: early-pachytene SC, mP: mid-pachytene SC, lP: late-pachytene SC, D: diplotene SC, MI: metaphase I, MII: metaphase II, RS1o2: S1–2 spermatids, RS3o4: S3–4 spermatids, RS5o6: S5-6 spermatids, RS7o8: S7-8 spermatids
Fig. 3
Fig. 3
Cellular heterogeneity during spermatogonial differentiation. a Schematic representation of spermatogonial differentiation including sub-stages of undifferentiated (As, Apaired, Aaligned) and differentiating spermatogonia (A1, A2, A3, A4, In, B) (SGs) as well as preleptotene spermatocytes (Pl). b Sub-structure detection in spermatogonia isolated from P10 and P15 animals. PCA was computed on batch-corrected transcriptomes (Methods). The first row highlights the time-point from which a cell was captured (left); the cluster identity based on sub-clustering of the batch-corrected transcriptomes (middle); and the mapping of RA-synchronised cell-types onto our single-cell data (right). Labels for RA-synchronised cells are as described in Fig. 2d. The second row highlights the log2-transformed, normalised counts of known marker genes for spermatogonial stem cells (Gfra1), undifferentiated (Zbtb16) and differentiating spermatogonia (Stra8 and Dmrtb1). c Scaled, normalised expression counts of the top 10 marker genes per cell cluster. Column and row labels represent the cell clusters identified according to (b). Cells are ordered along their differentiation course using principal curve regression (Methods). The lower bar indicates the gradual differentiation from undifferentiated spermatogonia to pre-leptotene spermatocytes driven by two retinoic acid (RA) signals
Fig. 4
Fig. 4
Transcriptional characterisation of leptotene and zygotene spermatocytes. a Schematic representation of spermatogonial differentiation and early meiosis. b Panels display the tSNE representation of cells identified using the EmptyDrops filtering strategy (Methods). In the left panel, coloured dots represent cells that were detected using the default CellRanger filtering while black dots represent new cells that were recovered by the EmptyDrops filtering. The middle panel visualises the number of genes expressed per cell (>0 counts) across all EmptyDrops selected cells. The right panel displays the cluster identity based on sub-clustering of the batch-corrected transcriptomes of all EmptyDrops selected cells and the mapped RA-synchronised cells from Chen et al. for reference. c Scaled, normalised expression counts (Z score) for selected marker genes per cell cluster. Column and row labels represent the cell clusters identified according to (b). Cells are ordered along their differentiation course using principal curve regression (Methods). d Probabilistic mapping of early bulk RNA-Seq libraries (P6-P20) to the cell clusters identified in the EmptyDrops-filtered P15 scRNA-Seq data using a random forest approach (Methods). The colour gradient indicates the probability with which a bulk sample can be assigned to the specific cell cluster. e Representative images of P15 tissue sections stained with PAS or RNA ISH for Prss50 using RNAScope. Scale bar in upper panels represent 100 µm; original magnification ×10. Scale bar in lower panels represent 50 µm; original magnification ×40. For full quantification across juvenile time-points and epithelial stages in adult see Supplementary Fig. 6a–d
Fig. 5
Fig. 5
Gene expression dynamics during male meiosis. a Number of genes expressed per spermatocyte. Cells are ordered by their developmental progression during meiotic prophase until metaphase. b Example of genes that are negatively (Hormad1) or positively (Pou5f2) correlated with the number of genes expressed during meiotic prophase (Spearman’s correlation test, negatively correlated: rho < −0.3, Benjamini-Hochberg corrected empirical p-value < 0.1; positively correlated: rho > 0.3, Benjamini-Hochberg corrected empirical p-value < 0.1, see Methods). The colour gradient represents log2-transformed, normalised counts. c Representative images for Stage XI tubules from adult animals stained with PAS or RNA ISH for Pou5f2 using RNAScope. Scale bar represents 50 µm; original magnification ×40. For full quantification across tubule stages see Supplementary Fig. 7a, b. d Heatmap visualising the scaled, normalised expression of the top 15 marker genes per cell-type. Row and column labels correspond to the different populations of spermatocytes. Genes are labelled based on their fertility phenotype: blue: infertile or sub-fertile in males, green: infertile or sub-fertile in both males and females. e Cell-type proportions in each cluster for Tc0 (n = 3) and Tc1 (n = 4) animals. Arrows indicate a statistically significant shift in proportions between the genotypes (Methods). SG: spermatogonia, eP: early-pachytene spermatocyte, mP: mid-pachytene SC, lP: late-pachytene SC, D: diplotene SC, MI: meiosis I, MII: meiosis II, S1-S11: step 1–11 spermatids
Fig. 6
Fig. 6
Transcriptional and chromatin dynamics during spermiogenesis. a Schematic representation of spermiogenesis indicating the round-to-elongating switch that coincides with transcriptional shutdown. b Scaled, normalised expression of histone variants (H1, H2A, H2B, H3), canonical histones, transition proteins (Tnp) and protamines (Prm) during spermiogenesis. Cells were ordered based on their developmental trajectory ranging from round spermatids (S1–S7) to elongating spermatids (S8-S11). Vertical dashed line indicates transcriptional shutdown between S7 and S8. c Number of genes expressed per spermatid. Cells were ordered based on their developmental trajectory. Red line indicates a smooth regression (loess) fit. d For each gene, its normalised expression per cell was correlated with the number of genes expressed per cell (Methods). Genes were ordered based on the correlation coefficient and grouped into nine sets (Supplementary Data 10). Scaled expression was averaged across genes within each gene set
Fig. 7
Fig. 7
X chromosome dynamics during spermatogenesis. a Schematic of sex chromosome sub-nuclear localisation through spermatogenesis. b For each cell, the ratio of mean expression of genes on Chr 9, Chr X and Chr Y to the mean expression of genes across all autosomes is represented as a boxplot for cells allocated to each developmental stage (see Methods). SG: spermatogonia, eP: early-pachytene spermatocyte, mP: mid-pachytene, SC: lP late-pachytene SC, D: diplotene SC, MI: meiosis I, MII: meiosis II, S1-11: step 1–11 spermatids. c Expression of all X chromosome genes (>10 average counts) in bulk RNA-seq data across the juvenile time-course. Columns correspond to developmental stage and rows are ordered by the log2 -fold change between spermatocytes (stages before postnatal day (P) 20) and spermatids (stages after and including P20). Horizontal dashes indicate genes that are targets of RNF8 (green) and SCML2 (blue). The colour scale indicates the log2-transformed, normalised expression. d Normalised expression values of spermatid-specific genes (c) were averaged per germ cell-type prior to scaling (Z score). Columns are ordered by developmental stage and rows are ordered by peak gene expression through development. e Representative images of Stage I tubules from adult B6 animals stained with PAS or RNA ISH for Ssxb1 using RNAScope. Scale bar represents 100 µm; original magnification ×20. f Quantification of RNAScope dots for Ssxb1 per µm2 within tubules at different epithelial stages. A total number of 217 tubules was quantified across entire tissue cross-section from adult B6 animal. Source data are provided as a Source Data file
Fig. 8
Fig. 8
Epigenetic changes associated with X chromosome in- and re-activation. a Spermatocytes and spermatids were isolated from the same individual using FACS and profiled using H3K4me3 (active mark), H3K27ac (enhancer mark) and H3K9me3 (repressive mark) using CUT&RUN (Supplementary Fig. 10A and Methods). b Number of H3K9me3 Fragments Per Kilobase per Million (FPKM) for each chromosome. Pink (spermatocytes); Blue (spermatids). Shape corresponds to biological replicate at the P26 time-point. ce Boxplot of H3K4me3 (c), H3K27ac (d) and H3K9me3 (e) Counts Per Million (CPM) in promoter regions of spermatid specific (n = 128) and non-spermatid specific (n = 622) genes for spermatocytes (left) and spermatids (right). Counts were averaged across two biological replicates of the P26 time-point per histone mark. Statistical significance when testing for differences in histone mark abundance is displayed in form of p-values using Wilcoxon-Mann-Whitney test. X-linked spermatid-specific and non-specific genes were defined in Fig. 7c. Replicates for P24 and P28 are displayed in Supplementary Fig. 12a–c. f Genome tracks of H3K4me3, H3K27ac and H3K9me3 for two representative spermatid-specific genes (Akap4 and Cypt1) for Spermatocytes (left) and Spermatids (right) at P26. Reads were scaled by library size. Supplementary Fig. 12d shows tracks for Akap4 at the P24 and P28 time-points

Similar articles

Cited by

References

    1. Oakberg EF. Spermatogonial stem-cell renewal in the mouse. Anat. Rec. 1971;169:515–531. doi: 10.1002/ar.1091690305. - DOI - PubMed
    1. de Rooij DG, Russell LD. All you wanted to know about spermatogonia but were afraid to ask. J. Androl. 2000;21:776–798. - PubMed
    1. Soh YQS, et al. Meioc maintains an extended meiotic prophase I in mice. PLoS. Genet. 2017;13:e1006704. doi: 10.1371/journal.pgen.1006704. - DOI - PMC - PubMed
    1. Oakberg EF. A description of spermiogenesis in the mouse and its use in analysis of the cycle of the seminiferous epithelium and germ cell renewal. Am. J. Anat. 1956;99:391–413. doi: 10.1002/aja.1000990303. - DOI - PubMed
    1. Oakberg EF. Duration of spermatogenesis in the mouse and timing of stages of the cycle of the seminiferous epithelium. Am. J. Anat. 1956;99:507–516. doi: 10.1002/aja.1000990307. - DOI - PubMed

Publication types

MeSH terms