. 2019 Mar 19;10(1):1249.
doi: 10.1038/s41467-019-09104-1.

Membrane-cytoskeletal crosstalk mediated by myosin-I regulates adhesion turnover during phagocytosis

Affiliations

Membrane-cytoskeletal crosstalk mediated by myosin-I regulates adhesion turnover during phagocytosis

Sarah R Barger et al. Nat Commun. .

Abstract

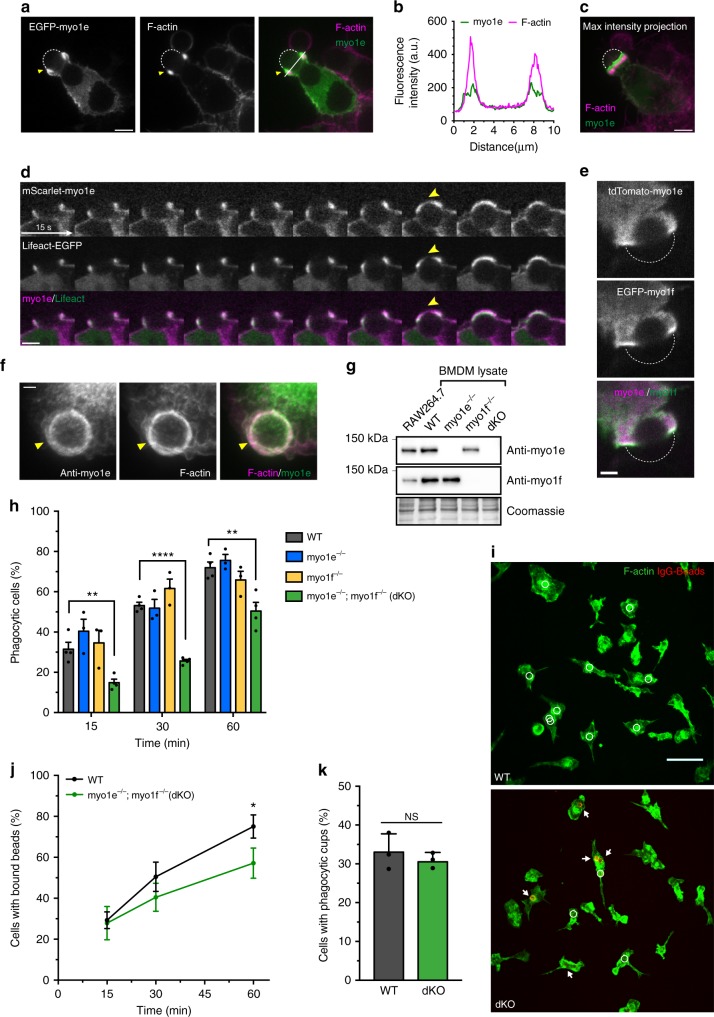
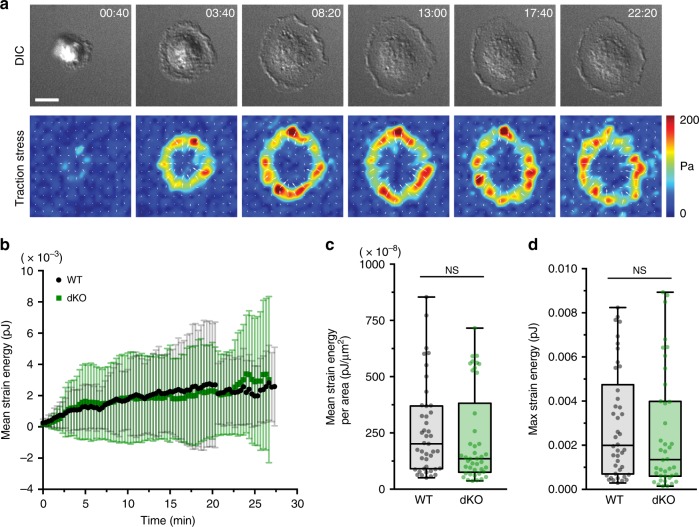
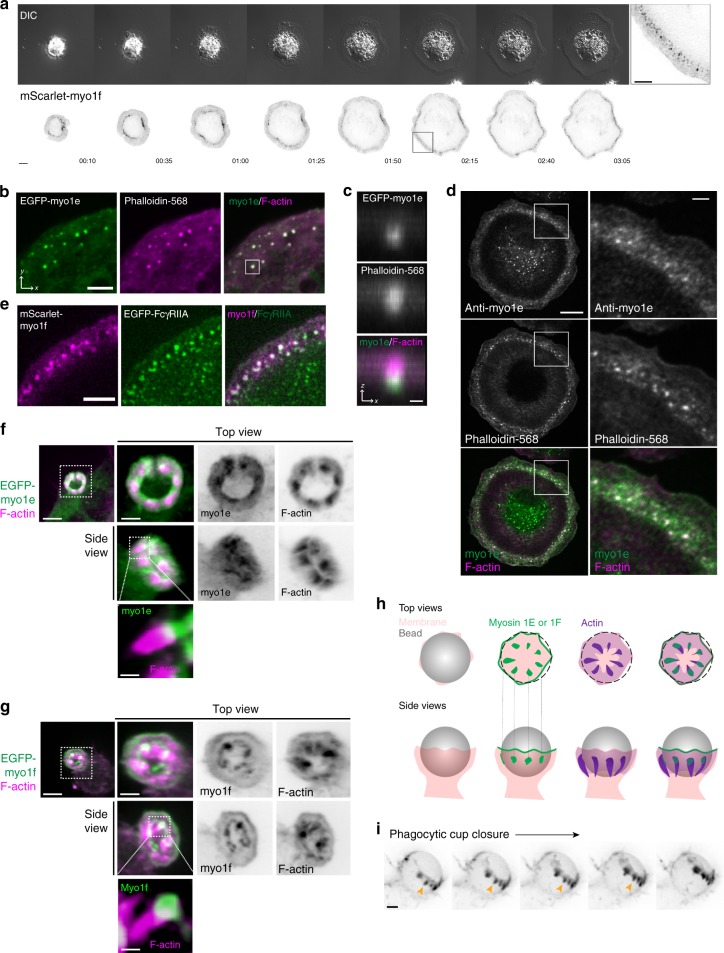
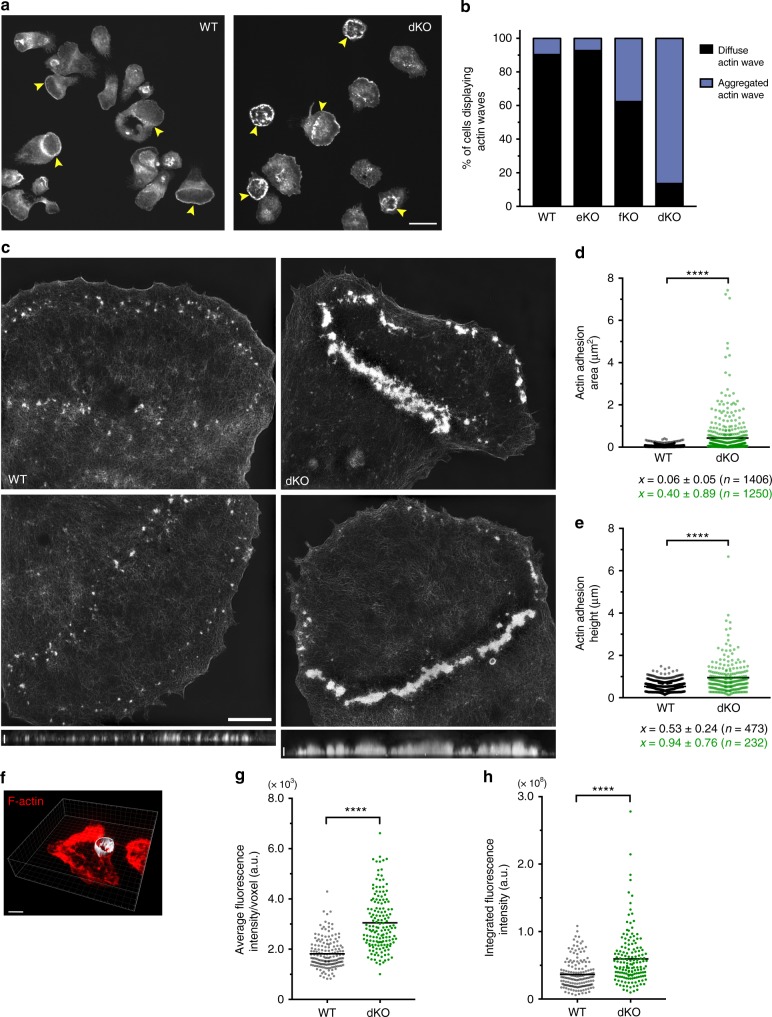
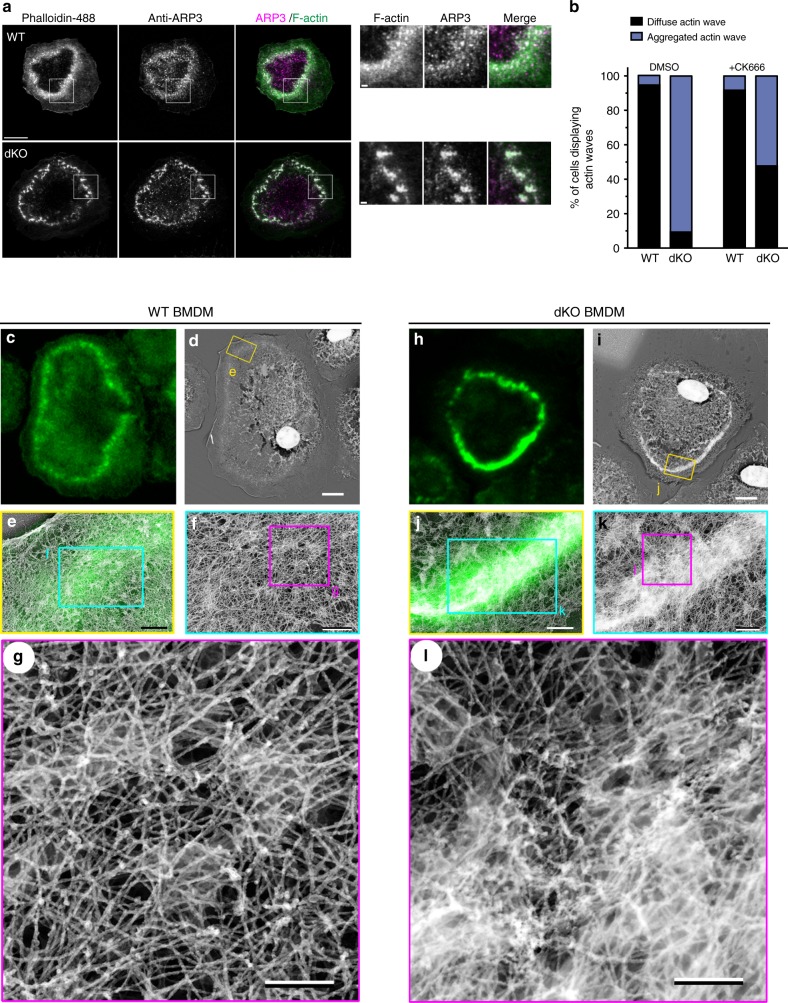
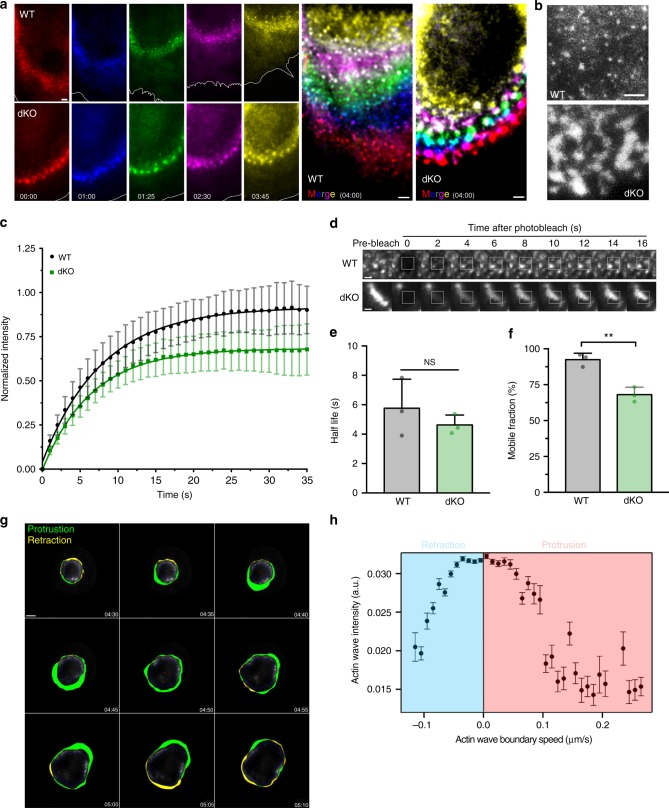
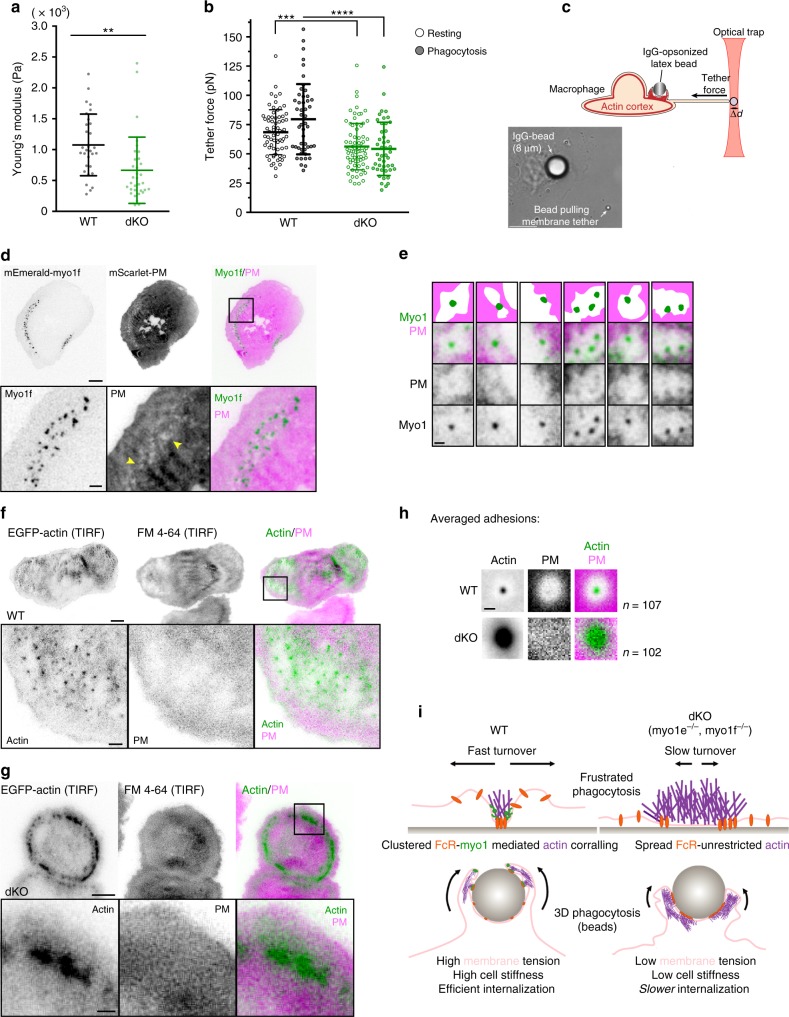
Phagocytosis of invading pathogens or cellular debris requires a dramatic change in cell shape driven by actin polymerization. For antibody-covered targets, phagocytosis is thought to proceed through the sequential engagement of Fc-receptors on the phagocyte with antibodies on the target surface, leading to the extension and closure of the phagocytic cup around the target. We find that two actin-dependent molecular motors, class 1 myosins myosin 1e and myosin 1f, are specifically localized to Fc-receptor adhesions and required for efficient phagocytosis of antibody-opsonized targets. Using primary macrophages lacking both myosin 1e and myosin 1f, we find that without the actin-membrane linkage mediated by these myosins, the organization of individual adhesions is compromised, leading to excessive actin polymerization, slower adhesion turnover, and deficient phagocytic internalization. This work identifies a role for class 1 myosins in coordinated adhesion turnover during phagocytosis and supports a mechanism involving membrane-cytoskeletal crosstalk for phagocytic cup closure.


Conflict of interest statement

The authors declare no competing interests.

Figures

Fig. 1
Fig. 1
Myo1e/f are required for efficient phagocytosis. a Confocal section of EGFP-myo1e-transfected RAW264.7 macrophage engulfing 6 μm IgG-coated bead and stained with fluorescent phalloidin. Yellow arrowhead indicates the phagocytic cup, dotted line outlines the bead. Scale bar, 5 μm. b Line scan of EGFP-myo1e and F-actin intensity along the line in a. c Maximum intensity projection of a shows that myo1e precedes actin at the cup leading edge. Scale bar, 5 μm. d Time-lapse montage of RAW macrophage expressing mScarlet-myo1e and Lifeact-EGFP engulfing 8 µm IgG-coated bead. Yellow arrowhead points to myo1e preceding F-actin, particularly at cup closure. Scale bar, 5 μm. e Myo1e and myo1f colocalize at the edge of phagocytic cup. Confocal section of tdTomato-myo1e/EGFP-myo1f-transfected RAW macrophage engulfing 6 μm IgG-coated bead (dotted line). Scale bar, 2 μm. f WT BMDM staining with anti-myo1e and phalloidin shows that endogenous myo1e colocalizes with F-actin at the phagocytic cup (arrow) formed around 6 μm IgG-coated bead. Cup is open, facing upward. Total intensity projection of a confocal z-stack. Scale bar, 2 μm. g Western blots of myo1e/f in RAW264.7 cells and WT, myo1e−/−, myo1f−/−, and dKO BMDM. Equal protein loading verified by Coomassie Blue staining. h Percentage (mean ± SEM) of cells that internalized at least one 6 μm IgG-coated bead at 15, 30, and 60 min. Data from three to four experiments. Analysis of 15–30 FOV resulted on average in 1200 cells per genotype quantified per experiment (15 min: p = 0.005; 30 min: p < 0.0001; 60 min: p = 0.006, unpaired t-tests). i Images of phagocytosis assay at 15 min. BMDM are stained with phalloidin (green) and un-internalized beads (arrows) are stained red. White circles denote internalized beads (not visible in the fluorescence image). Scale bar, 50 μm. j Percentage of cells (mean ± SD) that bound at least one bead during phagocytosis time course experiments described in h (15 min: p = 0.7625; 30 min: p = 0.09; 60 min: p = 0.029, unpaired t-tests). k Percentage of cells (mean ± SD) that formed actin-based phagocytic cups at 10 min (p = 0.44, unpaired t-test). Data from three independent experiments. Analysis of 10–18 FOV per experiment resulted in 1026 WT and 1557 dKO cells quantified
Fig. 2
Fig. 2
Myo1e and myo1f do not contribute to phagocytic contractility. a Representative time-lapse montage of BMDM (dKO macrophage) performing frustrated phagocytosis and exhibiting traction forces. Differential interference contrast (DIC) imaging (top) above traction force map (bottom). The magnitude of the brightness in the traction map corresponds to the magnitude of the stress (i.e., a pixel value of 50 = 50 Pa), with the pixel intensity values color-coded as indicated by the color wedge on the right. Scale bar, 10 μm. See also Supplementary Movie 3. b Graph of mean strain energy (±SD) over time during spreading. WT and dKO macrophages performed frustrated phagocytosis for TFM measurements. Data from two independent experiments (n = 44 WT and 42 dKO cells). c Graph of mean strain energy per unit of cell area. Box and whisker plot shows median, 25th and 75th percentile, with error bars depicting maximum and minimum data points. (n = 43 WT and 42 dKO cells). Two outliers have been removed (p = 0.43, unpaired t-test). d Graph of maximum strain energy measured over 30 min of cell spreading. Box and whisker plot shows median, 25th and 75th percentile, with error bars depicting maximum and minimum data points. (n = 42 WT and 40 dKO cells). Four outliers have been removed (p = 0.48, unpaired t-test)
Fig. 3
Fig. 3
Myo1e and myo1f localize to FcR-actin adhesions during frustrated phagocytosis. a Time-lapse montage of mScarlet-myo1f-transfected RAW macrophage (inverted) conducting frustrated phagocytosis and imaged by DIC (top) and TIRF microscopy (bottom). Scale bar, 10 μm. Zoom of boxed region depicting myo1f puncta is shown on the right. Scale bar, 5 μm. b F-actin colocalizes with myo1e at F-actin puncta. Confocal section of spreading edge of RAW macrophage expressing EGFP-myo1e and stained with Alexa Fluor-568-phalloidin. Scale bar, 5 μm. See also Supplementary Fig. 5a. c xz projection of the boxed region in b showing myo1e at the base of the phagocytic adhesion. Scale bar, 0.5 μm. d Primary macrophages form myo1e-enriched actin punctae during frustrated phagocytosis. WT BMDM spreading on IgG-coated coverslips for 10 min were fixed and stained with myo1e antibody and fluorescently labeled phalloidin. Scale bar, 10 μm. Zoom of boxed region shown on the right. Scale bar, 2 μm. e Myo1f puncta colocalize with Fc receptors. TIRF image of the spreading edge of RAW macrophage co-expressing mScarlet-myo1f and EGFP-FcγRIIA. Scale bar, 5 μm. f, g Phagocytic cups contain plumes of F-actin emanating from discrete myosin-I adhesion sites. 3D representations of phagocytic cup of RAW macrophages transfected with either EGFP-myo1e (f) or EGFP-myo1f (g) and counter-stained with fluorescently labeled phalloidin (bead not outlined). Scale bar, 5 μm; inset scale bar, 2 μm; zoom scale bar, 250 nm. h Graphical representation of myo1e/f and F-actin localization at the phagocytic cup (top view and side view). For the top view, gray bead has been replaced by dotted outline to allow visualization inside the cup. i Actin adhesions within the phagocytic cup move over target during phagocytic internalization. Maximum intensity projection time-lapse montage of RAW macrophage transfected with mEmerald-Lifeact (inverted) engulfing a 7 μm IgG-coated latex bead, imaged by lattice light sheet microscopy. Orange arrowheads point to the actin plumes dynamically progressing along the bead behind the edge of the phagocytic cup. Scale bar, 4 μm
Fig. 4
Fig. 4
dKO BMDM form disorganized actin adhesions and exhibit denser phagocytic cups. a Representative confocal image of WT and dKO macrophages performing frustrated phagocytosis. Cells spread for 10 min, then were fixed and stained with fluorescently labeled phalloidin. Yellow arrows point to circular actin waves. Scale bar, 20 μm. b Graph of mean percentage of cells forming diffuse or aggregated actin waves in WT, myo1e−/− (eKO), myo1f−/− (fKO), and myo1e−/−; myo1f−/− (dKO) BMDM. Data from 2 to 4 independent experiments. At least 10 FOVs judged blindly per experiment resulting in > 300 cells quantified. c Representative structured illumination microscopy (SIM) images of actin wave in BMDM. Scale bar, 5 μm. xz projections of the entire cell in the lower images are shown below. Scale bar, 1 μm. d Area of individual actin adhesions in WT and dKO macrophages measured using 3D-SIM. Data pooled from two independent experiments. Mean (± SD) annotated below (n = 1406 WT and 1250 dKO individual adhesions from at least 20 cells per genotype, ****p < 0.0001, unpaired t-test). e Height of individual actin adhesions in WT and dKO macrophages measured by 3D-SIM. Data pooled from two independent experiments. Mean (± SD) below (n = 476 WT and 230 dKO adhesions from 10 cells per genotype, ****p < 0.0001, unpaired t-test). f Representative image of segmented phagocytic cup (gray) for fluorescence intensity measurement of F-actin (red). BMDM were challenged with 6 μm IgG-coated latex beads, fixed and stained with fluorescently labeled phalloidin. Phagocytic cup was measured by 3D reconstruction using Imaris software. Scale bar, 5 μm. g, h Mean (black line) fluorescence intensity (g) and integrated fluorescence intensity (h) of F-actin in phagocytic cups of WT and dKO macrophages. Data pooled from three independent experiments (n = 163 WT and 156 dKO cups, ****p < 0.0001, unpaired t-test)
Fig. 5
Fig. 5
Actin waves in dKO BMDM have higher density of branched actin filaments. a Immunostaining of Arp2/3 complex in WT and dKO BMDM during frustrated phagocytosis. Cells were counter-stained with fluorescently labeled phalloidin. Zoom of boxed regions shown on the right. Scale bar, 10 μm; zoom panel scale bar, 1 μm. b Treating dKO cells with low doses of Arp2/3 inhibitor CK-666 partially rescues actin wave morphology. Graph depicting the mean percentage of cells forming diffuse or aggregated actin waves of WT and dKO BMDM in the presence of 1 μM CK-666. Data from two independent experiments (n ≥ 40 cells per genotype, judged blindly). cg Correlative confocal and platinum replica EM of actin wave in a representative WT macrophage. c Confocal section of a WT cell stained with fluorescently labeled phalloidin for correlative fluorescence image. Scale bar, 5 µm. d Platinum replica EM image of the macrophage shown in c. Scale bar, 5 µm. e Overlay of the enlarged confocal (green) and platinum replica EM (gray) images corresponding to the boxed region in d. Scale bar, 0.5 µm. f, g Sequential magnifications of boxed regions in e and f, respectively, showing supramolecular architecture of individual phagocytic adhesions. Scale bars, 0.2 µm. hl Correlative confocal and platinum replica EM of actin wave in a representative dKO macrophage. h Confocal section of a dKO cell stained with fluorescently labeled phalloidin for correlative fluorescence image. Scale bars, 5 µm. i Platinum replica EM image of the macrophage shown in h. Scale bars, 5 µm. j Overlay of the enlarged confocal (green) and platinum replica EM (gray) images corresponding to the boxed region in i. Scale bars, 0.5 µm. k, l Sequential magnifications of boxed regions in j and k, respectively, showing unbridled actin polymerization. In l, image contrast is changed by adjusting gamma. Scale bars, 0.2 µm. See also Supplementary Fig. 9 and Supplementary Movie 12
Fig. 6
Fig. 6
Myo1e/f regulate actin dynamics at phagocytic adhesion sites. a Actin waves dynamics in WT and dKO macrophages transfected with EGFP-actin performing frustrated phagocytosis and imaged by TIRFM. Montage has been color-coded with respect to time (minutes:seconds) to display adhesion turnover. The white line marks the cell’s edge. The final images at the right (Merge) are maximum intensity projections. Scale bars, 2 μm. See also Supplementary Movie 13. b Gray scale zoom of maximum intensity projections in a to show distinct punctate structure of WT adhesions compared to fused/enlarged adhesions in dKO macrophage. Scale bar, 2 μm. c Graph of FRAP curves (mean ± SD). WT and dKO BMDM transfected with EGFP-actin were subjected to FRAP analysis to measure actin turnover during frustrated phagocytosis. The resulting data was corrected for photobleaching, normalized to the pre-bleached images, then fit using a single exponential function. Data pooled from three independent experiments (n = 38 WT and 36 dKO cells). d Representative actin wave recovery assessed by FRAP. White box indicates bleached region. Scale bar, 1 μm. e Graph of half-life of recovery (mean ± SD). Data from three independent experiments, (p = 0.39, unpaired t-test). f Graph of mobile fraction (mean ± SD). Data from three independent experiments, p = 0.0035, unpaired t-test). g Time-lapse montage of tracking analysis to characterize dKO macrophage actin wave dynamics. The border of the actin wave was tracked for protrusion (green)/retraction (yellow) speed and the inner blue line marks the inner boundary for actin quantification. Time, minutes:seconds. Scale bar, 5 μm. See also Supplementary Movie 14. h Increased actin wave intensity correlated with stalled actin wave. Graph (mean ± SD) showing the distribution of intensities of actin adhesions plotted against actin wave boundary speed during frustrated phagocytosis in a dKO BMDM. Error bars represent variability between individual boundary speeds measurements. See also Supplementary Figure 10
Fig. 7
Fig. 7
Myo1e and myo1f promote local membrane lifting around phagocytic adhesion sites. a Cytoskeletal tension of WT and dKO BMDM (mean ± SD) measured using atomic force microscopy (n = 30 WT and 33 dKO cells, p = 0.0026, unpaired t-test). b Membrane tension (mean ± SD) measured in WT and dKO BMDM while resting (data pooled from two independent experiments, n = 69 WT and 75 dKO cells, p = 0.0003, unpaired t-test) and performing phagocytosis (data pooled from two independent experiments, n = 48 WT and 46 dKO cells, ****p < 0.0001, unpaired t-test). c Schematic of membrane tension measurement by the tether-pulling assay during phagocytosis. Beneath, representative bright-field image of assay. Scale bar, 10 µm. d Membrane lifting observed around phagocytic adhesions. TIRFM imaging of frustrated phagocytosis in RAW macrophage expressing mEmerald-myo1f and mScarlet-PM (plasma membrane marker) (inverted intensity for myo1f and PM). Yellow arrowheads in the zoomed image of the boxed region denote sites of membrane lifting around phagocytic adhesions. Scale bar, 10 µm; zoom scale bar, 2 µm. e Examples of myo1e/f placement at membrane lifting sites. TIRFM images of frustrated phagocytosis in RAW macrophages transfected with membrane marker and myo1e/f (inverted intensity for myo1 and PM). Top row contains schematic representations corresponding to merged panels. Scale bar, 1 µm. fg Membrane lifting around phagocytic adhesions observed in WT (f), but not dKO (g) BMDM. WT and dKO BMDM with EGFP-actin and stained with membrane label FM 4-64 were imaged by TIRFM during frustrated phagocytosis (inverted intensity for actin and PM). Scale bar, 5 µm; inset scale bar, 2 µm. h Inverted fluorescence intensity maps obtained by averaging multiple phagocytic adhesions in WT and dKO BMDM and showing membrane (FM 4-64) relative to F-actin. Data from three independent experiments (n = 107 WT and 102 dKO adhesions from at least 15 cells). Scale bar, 1 µm. i Graphical model: myo1e/f tether membrane at phagocytic adhesion sites. Without these linkages, local membrane tension is altered, allowing unrestricted actin polymerization causing enlarged phagocytic adhesions. This results in an actin-dense phagocytic cup that completes closure at a slower rate

References

    1. Aderem A, Underhill DM. Mechanisms of phagocytosis in macrophages. Annu. Rev. Immunol. 1999;17:593–623. doi: 10.1146/annurev.immunol.17.1.593. - DOI - PubMed
    1. Freeman SA, Grinstein S. Phagocytosis: receptors, signal integration, and the cytoskeleton. Immunol. Rev. 2014;262:193–215. doi: 10.1111/imr.12212. - DOI - PubMed
    1. Braun V, Niedergang F. Linking exocytosis and endocytosis during phagocytosis. Biol. Cell / Auspices Eur. Cell Biol. Organ. 2006;98:195–201. - PubMed
    1. Underhill DM, Goodridge HS. Information processing during phagocytosis. Nat. Rev. Immunol. 2012;12:492–502. doi: 10.1038/nri3244. - DOI - PMC - PubMed
    1. Garcia-Garcia E, Rosales C. Signal transduction during Fc receptor-mediated phagocytosis. J. Leukoc. Biol. 2002;72:1092–1108. - PubMed

Publication types

MeSH terms