. 2019 Mar 19;10(1):1262.
doi: 10.1038/s41467-019-09140-x.

H3K27M induces defective chromatin spread of PRC2-mediated repressive H3K27me2/me3 and is essential for glioma tumorigenesis

Affiliations

H3K27M induces defective chromatin spread of PRC2-mediated repressive H3K27me2/me3 and is essential for glioma tumorigenesis

Ashot S Harutyunyan et al. Nat Commun. .

Abstract

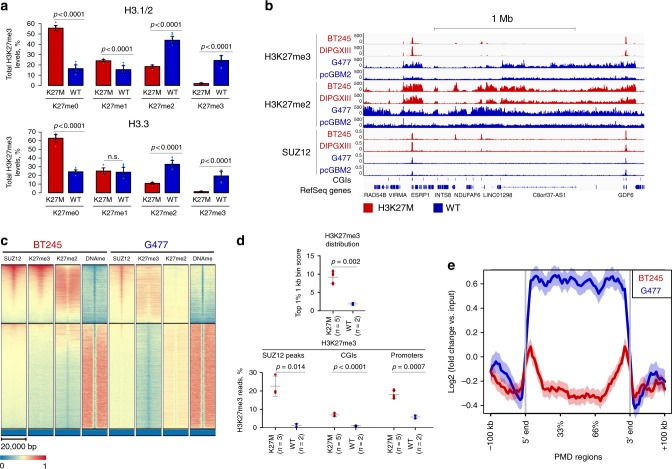
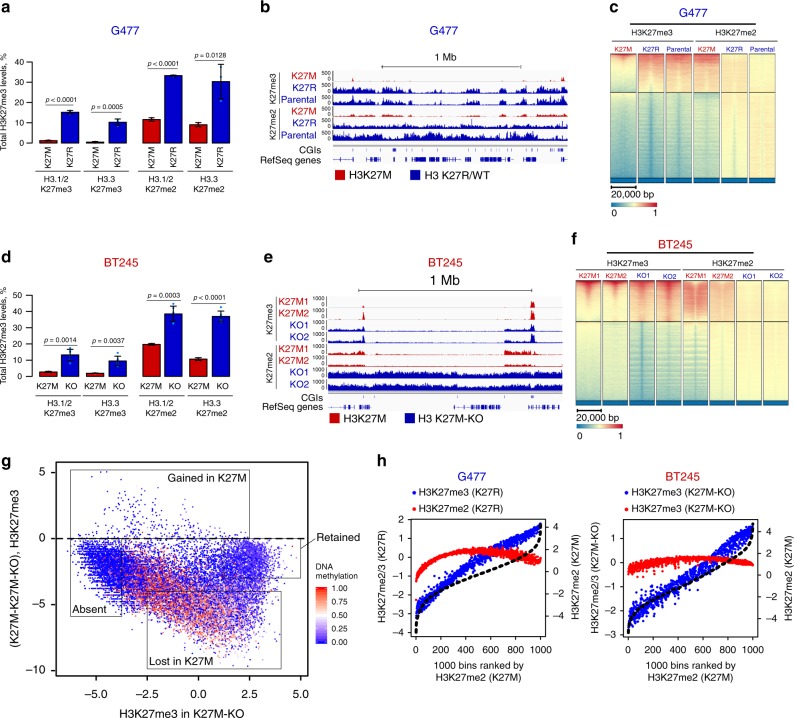
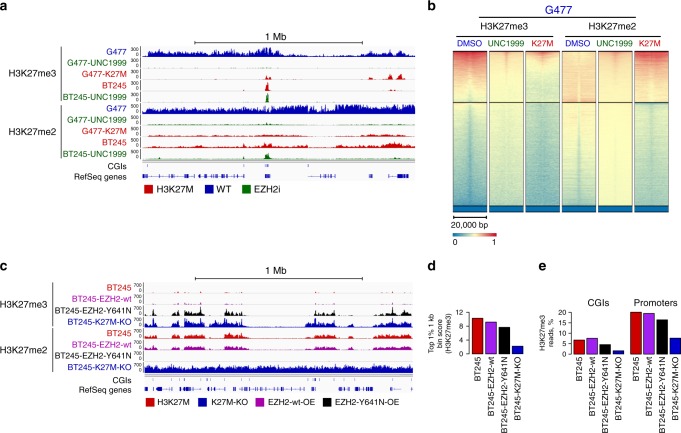
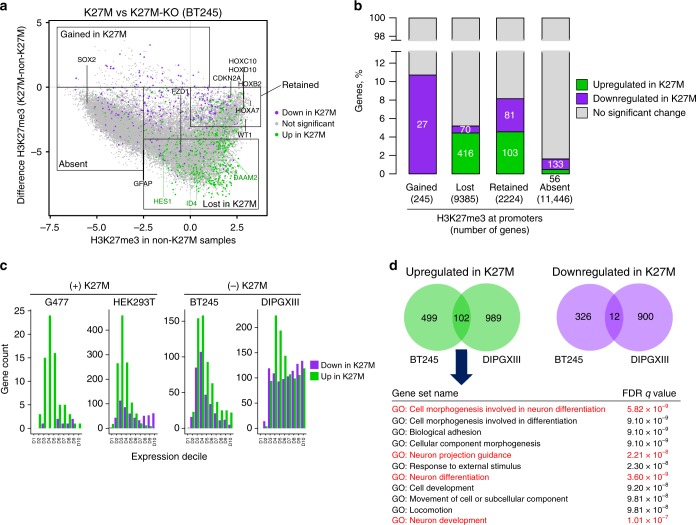
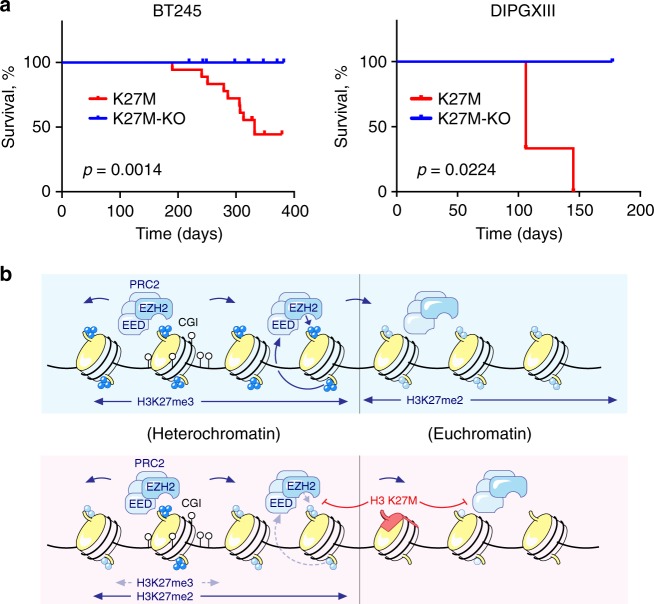
Lys-27-Met mutations in histone 3 genes (H3K27M) characterize a subgroup of deadly gliomas and decrease genome-wide H3K27 trimethylation. Here we use primary H3K27M tumor lines and isogenic CRISPR-edited controls to assess H3K27M effects in vitro and in vivo. We find that whereas H3K27me3 and H3K27me2 are normally deposited by PRC2 across broad regions, their deposition is severely reduced in H3.3K27M cells. H3K27me3 is unable to spread from large unmethylated CpG islands, while H3K27me2 can be deposited outside these PRC2 high-affinity sites but to levels corresponding to H3K27me3 deposition in wild-type cells. Our findings indicate that PRC2 recruitment and propagation on chromatin are seemingly unaffected by K27M, which mostly impairs spread of the repressive marks it catalyzes, especially H3K27me3. Genome-wide loss of H3K27me3 and me2 deposition has limited transcriptomic consequences, preferentially affecting lowly-expressed genes regulating neurogenesis. Removal of H3K27M restores H3K27me2/me3 spread, impairs cell proliferation, and completely abolishes their capacity to form tumors in mice.


Conflict of interest statement

The authors declare no competing interests

Figures

Fig. 1
Fig. 1
H3K27M-mutant pediatric high-grade gliomas (pHGGs) exhibit distinct distribution of H3K27me3 and H3K27me2 a H3K27me1/2/3 abundance quantified by mass spectrometry, primary cells (WT n = 3 cell lines, K27M n = 3 cell lines, three replicates for each cell line, mean ± standard deviation, Student’s t-test). b Example of normalized H3K27me3 and H3K27me2 chromatin immunoprecipitation sequencing (ChIP-seq) tracks of H3K27M and WT pHGG lines, showing qualitative differences in distribution of these marks. For comparison, SUZ12 ChIP-seq tracks, and CpG islands (CGIs) are shown. c Heatmap plots of ChIP-seq signal intensity for SUZ12, H3K27me2/3, and DNA methylation (whole-genome bisulphite sequencing (WGBS)) over CGIs for BT245 (H3K27M) and G477 (WT). CGIs are separated by kmeans clustering (k = 3). d Top: Average enrichment at the top 1% of 1 kb bins for H3K27me3. Bottom: Proportion of H3K27me3 reads in SUZ12 peaks, CGIs, promoters. H3K27M cells show higher enrichment for H3K27me3 in top 1% 1 kb bins, SUZ12 peaks, CGIs and promoters compared to wild-type cells (mean ± standard deviation, Student’s t-test). e H3K27me3 signal intensity over partially methylated domain (PMD) regions in BT245 (H3K27M) and G477 (WT) cells, aggregate plot. Source data are provided as a Source Data file
Fig. 2
Fig. 2
H3K27M reversibly induces global redistribution of H3K27me2 and H3K27me3 (ac). G477 wild-type cell line with H3.3-K27M overexpression. a H3K27me2/3 abundance by histone mass spectrometry (n = 3 in each group, mean ± standard deviation, Student’s t-test). b Example ChIP-seq tracks of H3K27me2/3 distribution, normalized by drosophila spike-in (ChIP-Rx). c Heatmap plots of ChIP-seq signal intensity for H3K27me2 and H3K27me3 over CGIs for parental G477 (wild-type) and G477 overexpressing K27R and K27M. CGIs are separated by kmeans clustering (k = 3). df. BT245 with H3K27M knockout (KO) by CRISPR/Cas9. d H3K27me3 abundance by histone mass spectrometry (K27M n = 3, KO n = 6, mean ± standard deviation, Student’s t-test). Whiskers represent standard deviation. e Example ChIP-seq tracks of H3K27me2/3 distribution, ChIP-Rx normalized. f Heatmap plots of ChIP-seq signal intensity for H3K27me2 and H3K27me3 over CGIs for parental BT245 (H3K27M) and K27M knockout (K27M-KO) by CRISPR. CGIs are separated by kmeans clustering (k = 3). g H3K27me3 signal change at CGIs of BT245, K27M-KO vs. K27M, color coded for DNA methylation. y-axis shows the difference in normalized H3K27me3 levels at CGIs in K27M vs. K27M-KO (log2), while x-axis shows normalized H3K27me3 levels in non-K27M state (K27M-KO, log2). Four categories of CGIs based on H3K27me3 levels and difference are depicted by squares. h Strong correlation of H3K27me2 in H3K27M with H3K27me3 in respective isogenic non-K27M state (K27R in G477, K27M-KO in BT245). 1000 aggregate bins are ranked on x-axis based on H3K27me2 in H3K27M state (black dotted line). H3K27me3 levels in each bin for non-K27M sample are shown in blue, H3K27me2 levels in non-K27M—in red (normalized, log2). Source data are provided as a Source Data file
Fig. 3
Fig. 3
EZH2 inhibition does not completely mimic H3K27M effects and EZH2-Y641N partly overcomes H3K27M-induced effects (a, b). Changes in H3K27me2/3 levels and distribution upon EZH2 inhibition. a Example ChIP-seq tracks of H3K27me2/3 distribution in G477 (wild-type) and BT245 (H3K27M) cell lines treated and not treated with UNC1999 (EZH1/2 inhibitor), ChIP-Rx normalized. For comparison, G477 cell line with H3.3-K27M overexpression is also included. b Heatmap plots of ChIP-seq signal intensity for H3K27me2 and H3K27me3 over CGIs for G477 cell line (wild-type) treated and not treated with UNC1999, as well as with H3.3-K27M overexpression. CGIs are separated by kmeans clustering (k = 3). ce Changes in H3K27me2/3 levels and distribution upon overexpression of EZH2-wt and EZH2-Y641N. c Example ChIP-seq tracks (ChIP-Rx normalized) of H3K27me2/3 distribution in BT245 cell line (H3K27M) overexpressing wild-type or Y641N mutant forms of EZH2. Parental BT245 and CRISPR-edited K27M-KO clone are included for comparison. d Average enrichment at the top 1% of 1 kb bins for H3K27me3. e Proportion of H3K27me3 reads in CGIs and promoters upon EZH2 overexpression. Source data are provided as a Source Data file
Fig. 4
Fig. 4
Transcriptome and H3K27me3 loci implicate H3K27M in neural differentiation a H3K27me3 level difference plot in BT245 dataset, color coded by gene expression changes (green for upregulated in K27M state, purple—downregulated, grey—no significant change in expression). y-axis shows the difference in normalized H3K27me3 levels at promoters in K27M vs. K27M-KO (log2), while x-axis shows normalized H3K27me3 levels in non-K27M state (K27M-KO, log2). Four categories of promoters based on H3K27me3 levels and difference are depicted by squares. b Number and proportion (x-axis) of significantly up or downregulated genes in each selected region from plot 4a  (gained in K27M, lost in K27M, retained, absent). Numbers inside the columns show the number of genes up or downregulated in each category, while the number in brackets below column labels shows the total number of genes in that category. c Gene expression changes by deciles in different experimental datasets. The genes were assigned to deciles according to their expression in the original cell line, before manipulation. Most of differentially expressed genes (and upregulated in K27M) are among lower expressed deciles in all four datasets. d Overlap of differentially expressed genes in BT245 and DIPGXIII datasets. Gene set enrichment analysis of differentially expressed genes (genes upregulated in K27M state in both cell lines)
Fig. 5
Fig. 5
H3K27M confers tumorigenicity in vivo. a Survival of mouse orthotopic xenograft cohorts injected with BT245 (K27M; n = 18 mice, K27M-KO; n = 19 mice, log-rank test) and DIPGXIII lines (K27M; n = 3 mice, K27M-KO; n = 3 mice, log-rank test). b A model of H3K27M reversibly inhibiting the spread of H3K27me2 and H3K27me3 deposition by PRC2 from initial recruitment sites. Note that while in H3K27M H3K27me3 mark is restricted to unmethylated CGIs, H3K27me2 is found in domains where there is H3K27me3 in non-K27M condition. Source data are provided as a Source Data file

Comment in

Similar articles

Cited by

References

    1. Sturm D, et al. Paediatric and adult glioblastoma: multiform (epi)genomic culprits emerge. Nat. Rev. Cancer. 2014;14:92–107. doi: 10.1038/nrc3655. - DOI - PMC - PubMed
    1. Faury D, et al. Molecular profiling identifies prognostic subgroups of pediatric glioblastoma and shows increased YB-1 expression in tumors. J. Clin. Oncol. 2007;25:1196–1208. doi: 10.1200/JCO.2006.07.8626. - DOI - PubMed
    1. Haque T, et al. Gene expression profiling from formalin-fixed paraffin-embedded tumors of pediatric glioblastoma. Clin. Cancer Res. 2007;13:6284–6292. doi: 10.1158/1078-0432.CCR-07-0525. - DOI - PubMed
    1. Qu HQ, et al. Genome-wide profiling using single-nucleotide polymorphism arrays identifies novel chromosomal imbalances in pediatric glioblastomas. Neuro. Oncol. 2010;12:153–163. doi: 10.1093/neuonc/nop001. - DOI - PMC - PubMed
    1. Khuong-Quang DA, et al. K27M mutation in histone H3.3 defines clinically and biologically distinct subgroups of pediatric diffuse intrinsic pontine gliomas. Acta Neuropathol. 2012;124:439–447. doi: 10.1007/s00401-012-0998-0. - DOI - PMC - PubMed

Publication types

MeSH terms