. 2019 Mar 19;10(1):1291.
doi: 10.1038/s41467-019-09213-x.

The operational environment and rotational acceleration of asteroid (101955) Bennu from OSIRIS-REx observations

Collaborators, Affiliations

The operational environment and rotational acceleration of asteroid (101955) Bennu from OSIRIS-REx observations

C W Hergenrother et al. Nat Commun. .

Abstract

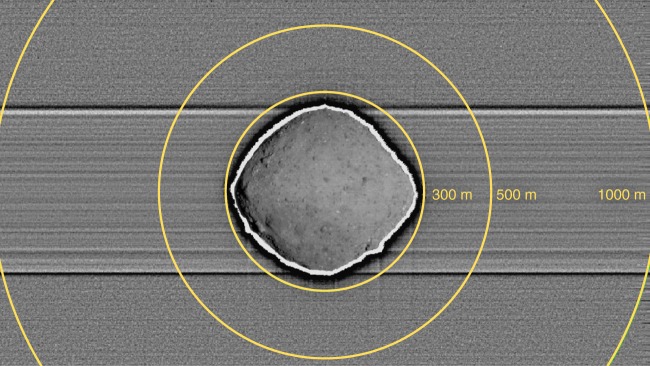
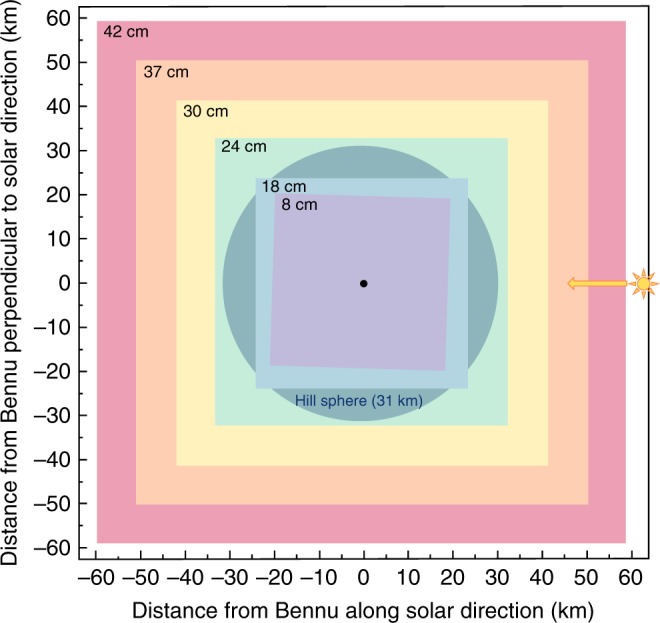
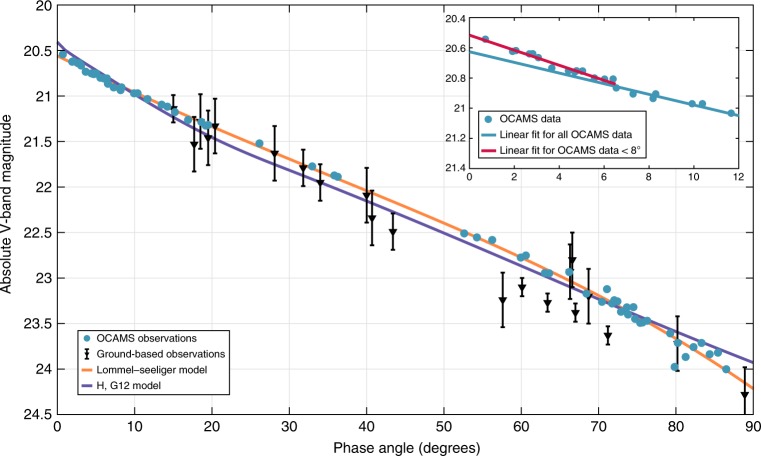
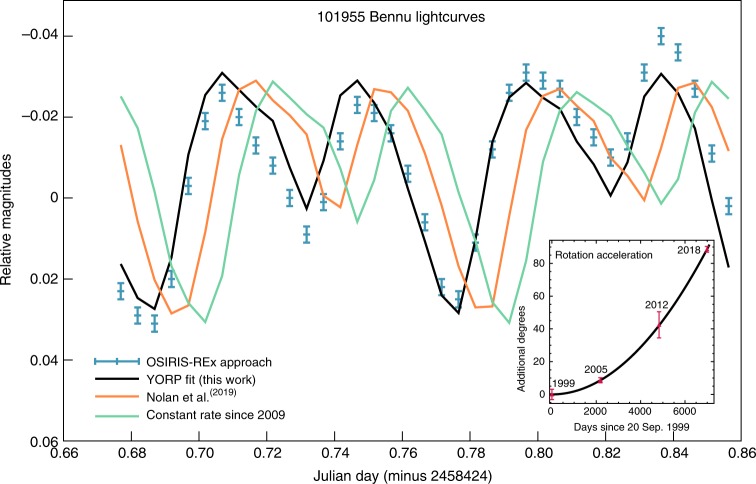
During its approach to asteroid (101955) Bennu, NASA's Origins, Spectral Interpretation, Resource Identification, and Security-Regolith Explorer (OSIRIS-REx) spacecraft surveyed Bennu's immediate environment, photometric properties, and rotation state. Discovery of a dusty environment, a natural satellite, or unexpected asteroid characteristics would have had consequences for the mission's safety and observation strategy. Here we show that spacecraft observations during this period were highly sensitive to satellites (sub-meter scale) but reveal none, although later navigational images indicate that further investigation is needed. We constrain average dust production in September 2018 from Bennu's surface to an upper limit of 150 g s-1 averaged over 34 min. Bennu's disk-integrated photometric phase function validates measurements from the pre-encounter astronomical campaign. We demonstrate that Bennu's rotation rate is accelerating continuously at 3.63 ± 0.52 × 10⁻⁶ degrees day-2, likely due to the Yarkovsky-O'Keefe-Radzievskii-Paddack (YORP) effect, with evolutionary implications.


Conflict of interest statement

The authors declare no competing interests.

Figures

Fig. 1
Fig. 1
Satellite-search imaging of the near-asteroid region. The image is a median combination of 15 PolyCam exposures from 10 November 2018 tracking the motion of the asteroid. This method enhances the relative detectability of satellites while suppressing the signal of stars and other background astronomical objects. The yellow circles denote distances from the Bennu center of figure. The horizontal features are due to charge smear. No satellites are apparent
Fig. 2
Fig. 2
Schematic illustrating visibility of detectable natural satellites. The minimum detectable diameter is given within the upper left corner of each search region. Bennu is marked at the center of the figure. Also marked is the Hill Sphere, or the region in which objects remain in orbit due to Bennu’s gravity. We completed an extensive search for natural satellites that sampled the entire Hill Sphere with a sensitivity to 24 cm satellite diameter. We detected none at this sensitivity level. Source data are provided in Supplementary Table 1
Fig. 3
Fig. 3
Phase function observations and models for Bennu. Over-plotted are the model fits to the new data: a Lommel-Seeliger model and a revised H,G12 model. The ground-based measurements are published in. We originally converted the ground-based measurements to the v-band magnitude scale, plotted with 1-sigma photometric error bars. The 1-sigma photometric error bars for OCAMS data are less than or equal to the size of the data points. Inset, upper right: The OSIRIS-REx measurements at low phase angles (0 to 12 degrees). We plot this subset of the data to illustrate the small opposition effect present for asteroid Bennu. The small opposition effect is consistent with what we would expect for low-albedo, carbonaceous bodies. The red line is the linear fit to observations made at less than 7.5 degrees phase angle. The blue line is the linear fit to all OSIRIS-REx data points at greater than 7.5 degrees phase angle. Source data are provided in Supplementary Tables 2 and 3
Fig. 4
Fig. 4
Lightcurve data and models for Bennu on 2 November 2018. The blue crosses are the OSIRIS-REx observations with their associated 1-sigma photometric uncertainties. The black curve (best fit to peaks and minima) shows the YORP acceleration determined from fitting the Approach phase observations with 1-sigma uncertainties. The orange lightcurve using the previously reported acceleration value does not fit as well as the black curve. The green curve assumes a constant rotation rate since 2009. The inset plot shows the quadratic increase of rotation phase with time, consistent with rotational acceleration due to YORP. Source data are provided as a Source Data file

References

    1. Lauretta DS, et al. OSIRIS-REx: sample return from asteroid (101955) Bennu. Space Sci. Rev. 2017;212:925–984. doi: 10.1007/s11214-017-0405-1. - DOI
    1. Rizk B, et al. OCAMS: the OSIRIS-REx camera suite. Space Sci. Rev. 2018;214:26. doi: 10.1007/s11214-017-0460-7. - DOI - PMC - PubMed
    1. Hergenrother, C. W. et al. The design reference asteroid for the OSIRIS-REx Mission Target (101955) Bennu. Preprint at https://arxiv.org/abs/1409.4704 (2014).
    1. OSIRIS-REx, Mission Status Update, https://www.asteroidmission.org/status-updates/, (2019).
    1. Vokrouhlický, D., Bottke, W. F., Chesley, S. R., Scheeres, D. J., & Statler, T. S. in Asteroids IV (eds Michel, P., DeMeo, F. E., & Bottke, W. F.), 509–532 (University of Arizona Press, Tucson, AZ, 2015).

Publication types