

Historical BCG vaccination combined with drug treatment enhances inhibition of mycobacterial growth ex vivo in human peripheral blood cells
- PMID: 30890730
- PMCID: PMC6425030
- DOI: 10.1038/s41598-019-41008-4
Historical BCG vaccination combined with drug treatment enhances inhibition of mycobacterial growth ex vivo in human peripheral blood cells
Abstract
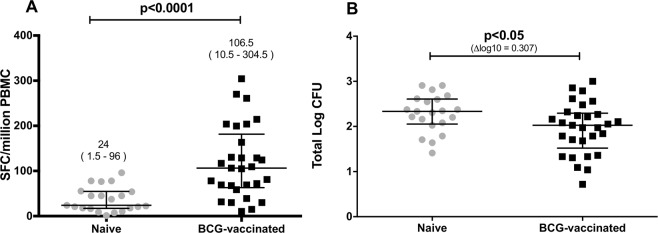
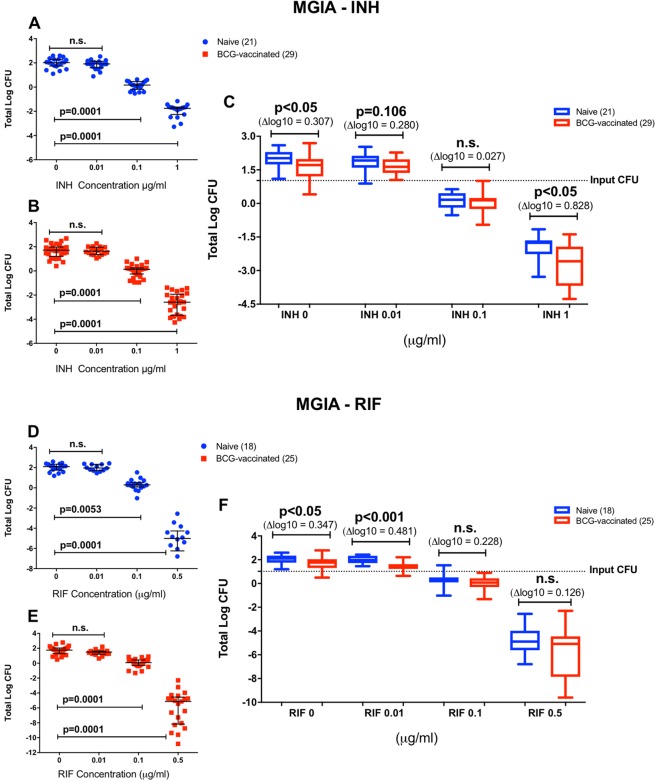
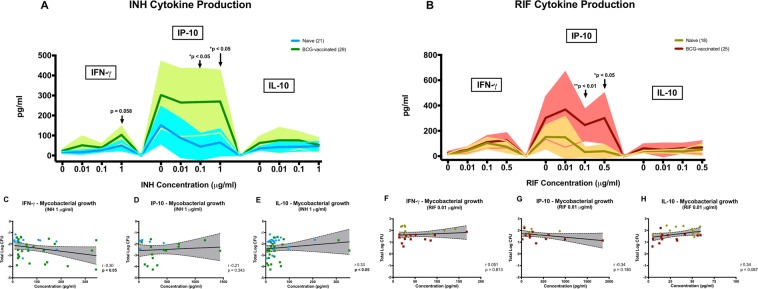
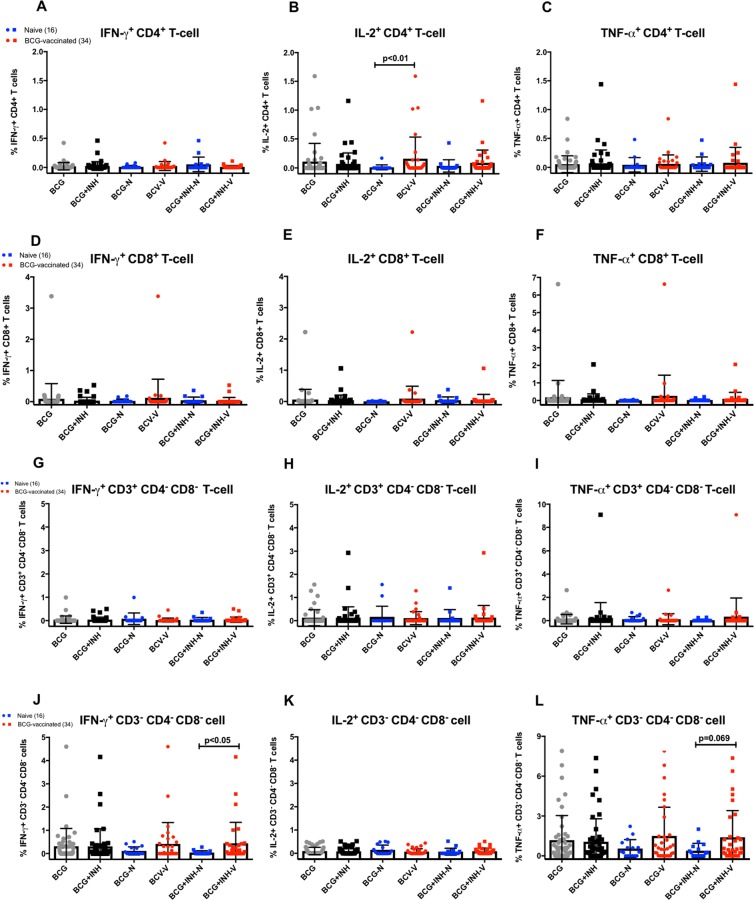
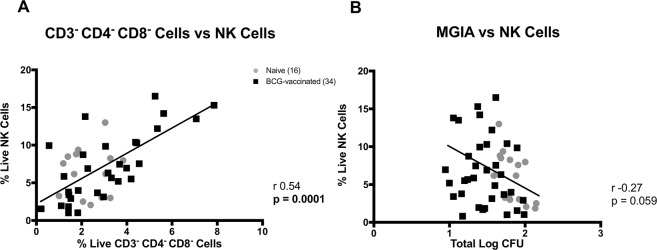
Tuberculosis (TB) is a leading infectious cause of death globally. Drug treatment and vaccination, in particular with Bacillus Calmette-Guérin (BCG), remain the main strategies to control TB. With the emergence of drug resistance, it has been proposed that a combination of TB vaccination with pharmacological treatment may provide a greater therapeutic value. We implemented an ex vivo mycobacterial growth inhibition assay (MGIA) to discriminate vaccine responses in historically BCG-vaccinated human volunteers and to assess the contribution of vaccine-mediated immune response towards the killing effect of mycobacteria in the presence of the antibiotics isoniazid (INH) and rifampicin (RIF), in an attempt to develop the assay as a screening tool for therapeutic TB vaccines. BCG vaccination significantly enhanced the ability of INH to control mycobacterial growth ex vivo. The BCG-vaccinated group displayed a higher production of IFN-γ and IP-10 when peripheral blood mononuclear cells (PBMC) were co-cultured with INH, with a similar trend during co-culture with RIF. A higher frequency of IFN-γ+ and TNF-α+ CD3- CD4- CD8- cells was observed, suggesting the contribution of Natural Killer (NK) cells in the combined effect between BCG vaccination and INH. Taken together, our data indicate the efficacy of INH can be augmented following historical BCG vaccination, which support findings from previous observational and animal studies.
Conflict of interest statement
The authors declare no competing interests.
Figures
Similar articles
-
Impact of individual-level factors on Ex vivo mycobacterial growth inhibition: Associations of immune cell phenotype, cytomegalovirus-specific response and sex with immunity following BCG vaccination in humans.Tuberculosis (Edinb). 2019 Dec;119:101876. doi: 10.1016/j.tube.2019.101876. Epub 2019 Sep 30. Tuberculosis (Edinb). 2019. PMID: 31698310
-
A new tool for tuberculosis vaccine screening: Ex vivo Mycobacterial Growth Inhibition Assay indicates BCG-mediated protection in a murine model of tuberculosis.BMC Infect Dis. 2016 Aug 12;16:412. doi: 10.1186/s12879-016-1751-4. BMC Infect Dis. 2016. PMID: 27519524 Free PMC article.
-
BCG Vaccination Induces M. avium and M. abscessus Cross-Protective Immunity.Front Immunol. 2019 Feb 19;10:234. doi: 10.3389/fimmu.2019.00234. eCollection 2019. Front Immunol. 2019. PMID: 30837992 Free PMC article.
-
Is interferon-gamma the right marker for bacille Calmette-Guérin-induced immune protection? The missing link in our understanding of tuberculosis immunology.Clin Exp Immunol. 2012 Sep;169(3):213-9. doi: 10.1111/j.1365-2249.2012.04614.x. Clin Exp Immunol. 2012. PMID: 22861360 Free PMC article. Review.
-
[Novel vaccines against M. tuberculosis].Kekkaku. 2006 Dec;81(12):745-51. Kekkaku. 2006. PMID: 17240920 Review. Japanese.
Cited by
-
In silico analysis of epitope-based vaccine candidate against tuberculosis using reverse vaccinology.Sci Rep. 2021 Jan 13;11(1):1249. doi: 10.1038/s41598-020-80899-6. Sci Rep. 2021. PMID: 33441913 Free PMC article.
-
Induction of Functional Specific Antibodies, IgG-Secreting Plasmablasts and Memory B Cells Following BCG Vaccination.Front Immunol. 2022 Jan 5;12:798207. doi: 10.3389/fimmu.2021.798207. eCollection 2021. Front Immunol. 2022. PMID: 35069580 Free PMC article. Clinical Trial.
-
Phase III, placebo-controlled, randomized, double-blind trial of tableted, therapeutic TB vaccine (V7) containing heat-killed M. vaccae administered daily for one month.J Clin Tuberc Other Mycobact Dis. 2019 Dec 12;18:100141. doi: 10.1016/j.jctube.2019.100141. eCollection 2020 Feb. J Clin Tuberc Other Mycobact Dis. 2019. PMID: 31890902 Free PMC article.
-
Impacts of MDR/XDR-TB on the global tuberculosis epidemic: Challenges and opportunities.Curr Res Microb Sci. 2024 Oct 19;7:100295. doi: 10.1016/j.crmicr.2024.100295. eCollection 2024. Curr Res Microb Sci. 2024. PMID: 39512261 Free PMC article. Review.
-
Development and application of the direct mycobacterial growth inhibition assay: a systematic review.Front Immunol. 2024 Feb 6;15:1355983. doi: 10.3389/fimmu.2024.1355983. eCollection 2024. Front Immunol. 2024. PMID: 38380319 Free PMC article.
References
-
- World Health Organization. Global Tuberculosis Report. (2017).
-
- Uplekar, M. et al. WHO’s new End TB Strategy. Lancet, 10.1016/S0140-6736(15)60570-0 (2015). - PubMed
-
- World Health Organization. Treatment of Tuberculosis Guideline: Fourth Edition. (Geneva, 2010).
Publication types
MeSH terms
Substances
Grants and funding
LinkOut - more resources
Full Text Sources
Medical
Research Materials
