. 2019 Mar 5:13:126.
doi: 10.3389/fnins.2019.00126. eCollection 2019.

Dynamics of Non-visual Responses in Humans: As Fast as Lightning?

Affiliations

Dynamics of Non-visual Responses in Humans: As Fast as Lightning?

Abhishek S Prayag et al. Front Neurosci. .

Abstract

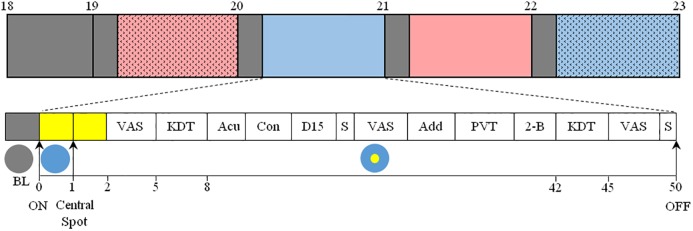
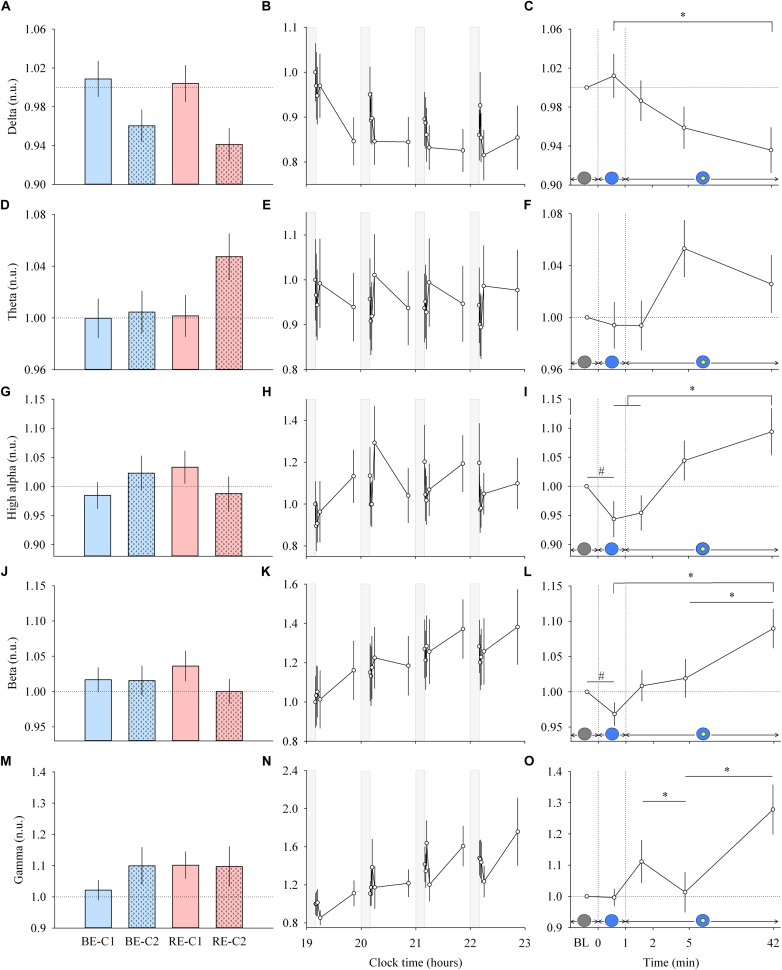
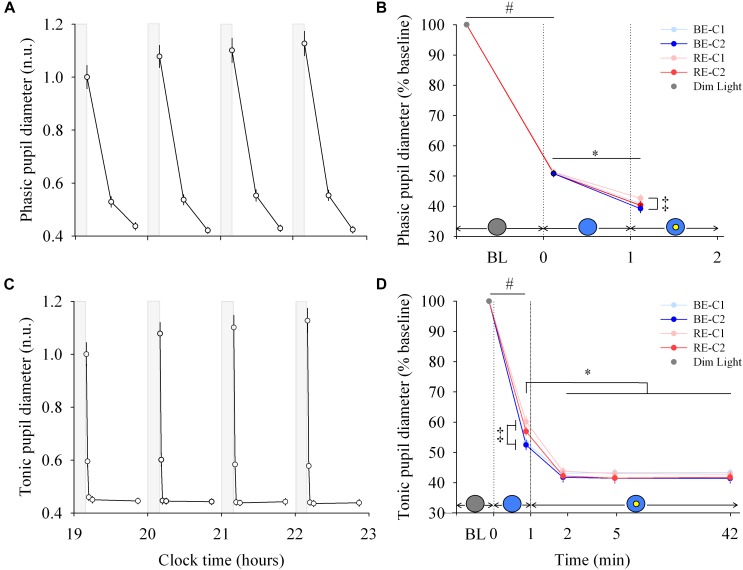
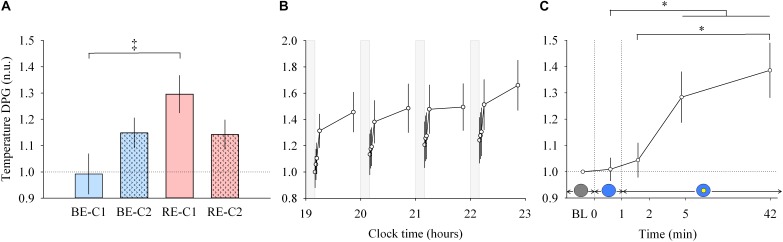
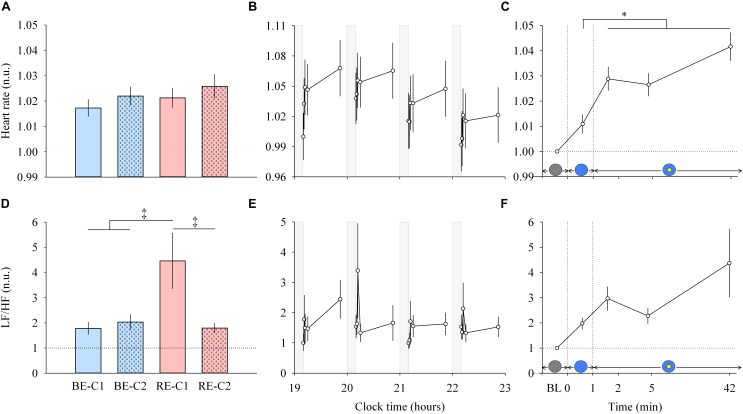
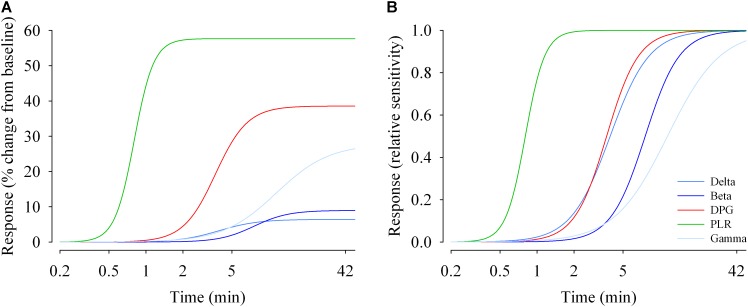
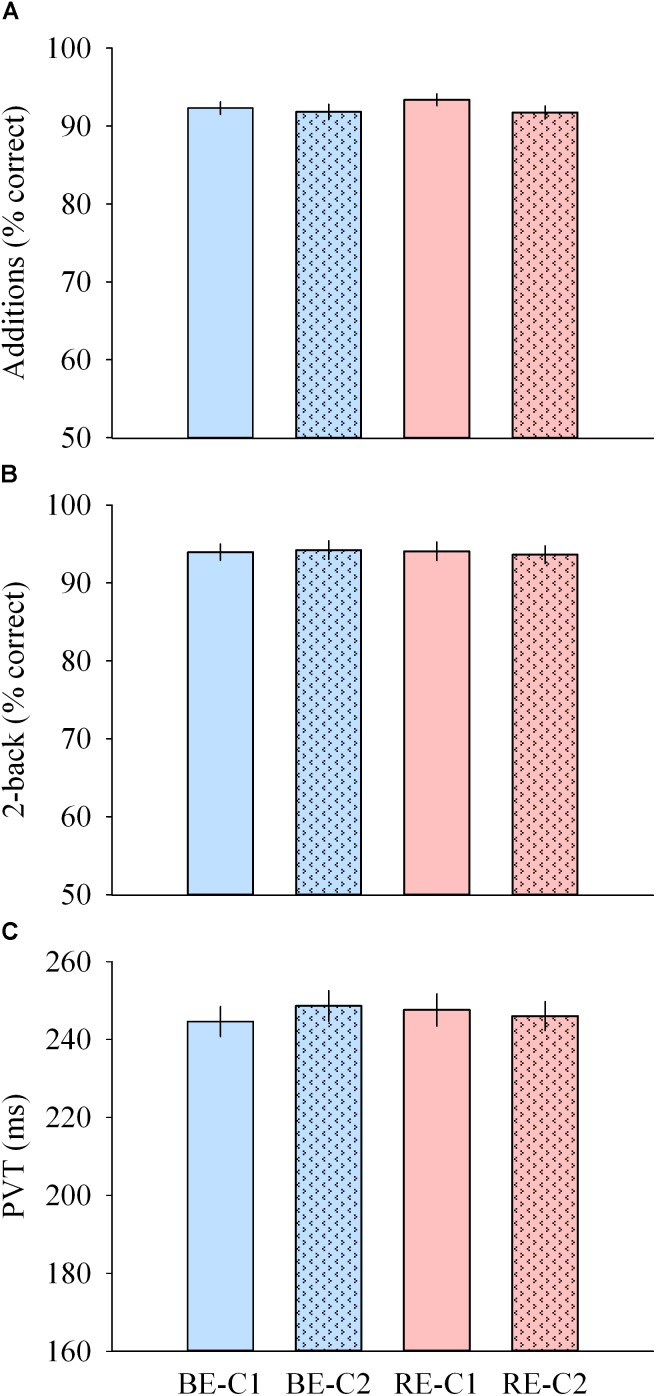
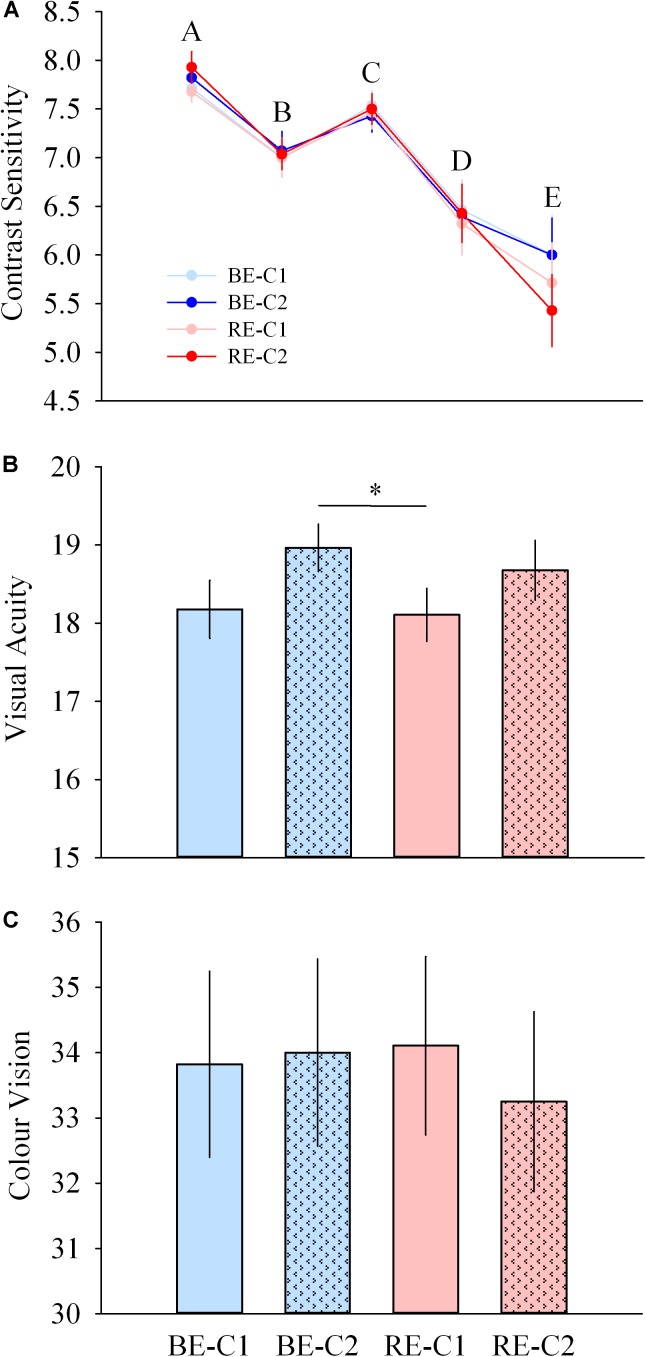
The eye drives non-visual (NV) responses to light, including circadian resetting, pupillary reflex and alerting effects. Initially thought to depend on melanopsin-expressing retinal ganglion cells (ipRGCs), classical photopigments play a modulatory role in some of these responses. As most studies have investigated only a limited number of NV functions, generally under conditions of relatively high light levels and long duration of exposure, whether NV functions share similar irradiance sensitivities and response dynamics during light exposure is unknown. We addressed this issue using light exposure paradigms spectrally and spatially tuned to target mainly cones or ipRGCs, and by measuring longitudinally (50 min) several NV responses in 28 men. We demonstrate that the response dynamics of NV functions are faster than previously thought. We find that the brain, the heart, and thermoregulation are activated within 1 to 5 min of light exposure. Further, we show that NV functions do not share the same response sensitivities. While the half-maximum response is only ∼48 s for the tonic pupil diameter, it is ∼12 min for EEG gamma activity. Most NV responses seem to be saturated by low light levels, as low as 90 melanopic lux. Our results also reveal that it is possible to maintain optimal visual performance while modulating NV responses. Our findings have real-life implications. On one hand, light therapy paradigms should be re-evaluated with lower intensities and shorter durations, with the potential of improving patients' compliance. On the other hand, the significant impact of low intensity and short duration light exposures on NV physiology should make us reconsider the potential health consequences of light exposure before bedtime, in particular on sleep and circadian physiology.

Keywords: EEG; circadian; duration response curve; heart rate; light; non-visual; pupil; temperature.


Figures

FIGURE 1
FIGURE 1
Top: Overview of the protocol. After arrival at 17:30, participants were maintained in dim light conditions (<5 lux, gray) until the beginning of the 4 sequential light pulses (BE-C1, blue; RE-C1, red; BE-C2, filled blue; RE-C2, filled red). The order of light conditions was balanced according to an orthogonal Latin square (see section “Materials and Methods”). Experimental sessions began at 19:00 and ended at 23:00. Each light condition consisted of 10 min in dim light (gray boxes, <5 lux) followed by 50 min of light. Bottom: Detail of each light pulse. After 10 min in dim light (gray box), light was turned on and the entire visual field was exposed (illustrated with a blue circle) to either blue- (BE) or red-enriched (RE) white light. This light was maintained until the end of the 50-min session. One minute after the initiation of the light exposure, a white light spot (illustrated with a yellow circle) was added in the central visual field, and was maintained until the end of the session. This central light spot occupied a field size of either 36° (C1) or 120° (C2). The measurements conducted are shown as: VAS, Visual Analog Scale; KDT, Karolinska Drowsiness Test; Acu, Acuity test; Con, Contrast sensitivity test; D-15, Farnsworth D-15 (color vision); S, Saliva collection; Add, Addition test; PVT, Psychomotor-Vigilance Task; 2-B, 2-back test. EEG, ECG, temperature and pupil diameter were recorded continuously between 19:00 and 23:00.
FIGURE 2
FIGURE 2
EEG response and dynamics during light exposure. (A,D,G,J,M; left column) Effect of light condition on each EEG band. EEG delta, theta, high alpha, beta and gamma absolute power densities are expressed relative to their respective dim light (min 0) values, in normalized units (n.u.). (B,E,H,K,N; middle column) Variation of EEG delta, theta, high alpha, beta, gamma during the protocol. Each pulse, corresponding to the average over the four light conditions, is shown in plain lines. Absolute EEG power densities for each band are expressed relative to their dim light level at 19:10, in normalized units (n.u.). Gray bars show the 10-min dim-light episode before each light exposure. (C,F,I,L,O; right column) Dynamics of the EEG during the 50-min light exposure. Absolute EEG power densities are expressed relative to their respective dim light (min 0) values, as normalized units (n.u.). Schematic representation of the light stimulus is shown above the time (min) axis. The gray circle indicates dim light. The blue- or red-enriched white light condition is illustrated by the blue circle. The yellow circle inside the blue circle represents the presence of the central light spot (C1 or C2) in addition to the full field exposure. The two vertical dotted lines indicate the light transitions, from dim light to blue- or red-enriched white light, and to addition of C1 or C2. Values represent the mean ± s.e.m. Dotted horizontal lines indicate the baseline dim-light level. #Significant pairwise comparison between min 0 and min 1. Significant pairwise comparisons between min 1–42 time-points. P-values of all post hoc pairwise time comparisons are given in Supplementary Table 2.
FIGURE 3
FIGURE 3
Pupillary response and dynamics during light exposure. (A,C) Variation of the phasic and tonic pupil diameter during the protocol. Each pulse, corresponding to the average over the four light conditions, is shown in plain lines. Pupil diameters are expressed relative to their dim light level at 19:10, in normalized units (n.u.). Gray bars show the 10-min dim-light episode before each light exposure. Note for the phasic diameter, the clock time axis is extended over the first 2 min only, and the gray bar representing dim-light is not to scale. (B,D) Dynamics of the phasic and tonic pupil diameters. Pupil diameters during the four 50-min light conditions are expressed as a percentage of the baseline diameter (min 0). Schematic representation of the light stimulus is shown above the time (min) axis. The gray circle indicates dim light. The blue- or red-enriched white light condition is illustrated by the blue circle. The yellow circle inside the blue circle represents the presence of the central light spot (C1 or C2) in addition to the full field exposure. The two vertical dotted lines indicate the light transitions, from dim light to blue- or red-enriched white light, and to addition of C1 or C2. Values represent the mean ± s.e.m. Significant pairwise comparisons between light conditions. #Significant pairwise comparison between min 0 and min 1. Significant pairwise comparisons between min 1–42 time-points.
FIGURE 4
FIGURE 4
Distal to proximal skin temperature gradient (DPG) response and dynamics during light exposure. (A; left) Effect of light condition on the DPG. DPG absolute values are expressed relative to dim light (min 0) values, in normalized units (n.u.). (B; middle) Variation of DPG during the protocol. Each pulse, corresponding to the average over the four light conditions, is shown in plain lines. DPG absolute values are expressed as a change from their dim light level at 19:10, in normalized units (n.u.). Gray bars show the 10-min dim-light episode before each light exposure. (C; right) Dynamics of the DPG during the 50-min light exposure. DPG absolute values are expressed relative to dim light (min 0) values, in normalized units (n.u.). Schematic representation of the light stimulus is shown above the time (min) axis (right column). The gray circle indicates dim light. The blue- or red-enriched white light condition is illustrated by the blue circle. The yellow circle inside the blue circle represents the presence of the central light spot (C1 or C2) in addition to the full field exposure. The two vertical dotted lines indicate the light transitions, from dim light to blue- or red-enriched white light, and to addition of C1 or C2. Values represent the mean ± s.e.m. Dotted horizontal lines indicate the baseline dim-light level. Significant pairwise comparison between light conditions. Significant pairwise comparisons between min 1–42 time-points. P-values of all post hoc pairwise time comparisons are given in Supplementary Table 3.
FIGURE 5
FIGURE 5
Heart rate and LF/HF ratio response and dynamics during light exposure. (A,D; left column) Effect of light condition on heart rate and LF/HF ratio. Absolute heart rate and the LF/HF ratio are expressed relative to their dim light (min 0) values, in normalized units (n.u.). (B,E; middle column) Variation of heart rate and LF/HF ratio during the protocol. Each pulse, corresponding to the average over the four light conditions, is shown in plain lines. Heart rate and LF/HF ratio absolute values are expressed as a change from their dim light level at 19:10, in normalized units (n.u.). Gray bars show the 10-min dim-light episode before each light exposure. (C,F; right column) Dynamics of the heart rate and LF/HF ratio during the 50-min light exposure. Absolute values are expressed relative to their respective dim light (min 0) values, as normalized units (n.u.). Schematic representation of the light stimulus is shown above the time (min) axis (right column). The gray circle indicates dim light. The blue- or red-enriched white light condition is illustrated by the blue circle. The yellow circle inside the blue circle represents the presence of the central light spot (C1 or C2) in addition to the full field exposure. The two vertical dotted lines indicate the light transitions, from dim light to blue- or red-enriched white light, and to addition of C1 or C2. Values represent the mean ± s.e.m. Dotted horizontal lines indicate the baseline dim-light level. Significant pairwise comparisons between light conditions. Significant pairwise comparisons between min 1–42 time-points. P-values of all post hoc pairwise time comparisons are given in Supplementary Table 4 for the heart rate and the LF/HF ratio.
FIGURE 6
FIGURE 6
Duration response curves of non-visual functions in humans. The response magnitudes were plotted against duration of light exposure and fitted with a 4-parameter logistic model. (A) Response change (% change from baseline dim light) during light exposure differed between functions. The maximal responses vary between ∼6% (EEG delta activity) and ∼60% for the pupillary light reflex (PLR; tonic pupil response). (B) Relative responses reveal that sensitivity differs between non-visual functions. EC50s (half-maximum values) range between ∼48 s (tonic pupil response) and ∼12 min (EEG gamma activity). Parameter estimates and R2 values are given in Supplementary Table 5.
FIGURE 7
FIGURE 7
Cognitive performance during light exposure. (A) Number of correct additions (top), (B) percentage of correct 2-back answers (middle) and (C) median PVT (bottom) observed for the four light conditions. Values are mean ± s.e.m. No differences were observed between light conditions.
FIGURE 8
FIGURE 8
Visual performance during light exposure. (A) Contrast sensitivity at 5 spatial frequencies (top), (B) acuity (middle), and (C) color vision (Farnsworth D15, bottom) scores observed for the four light conditions. Values are mean ± s.e.m. Significant difference between light conditions.

Similar articles

Cited by

References

    1. Badia P., Myers B., Boecker M., Culpepper J., Harsh J. R. (1991). Bright light effects on body temperature, alertness, EEG and behavior. Physiol. Behav. 50 583–588. 10.1016/0031-9384(91)90549-4 - DOI - PubMed
    1. Berson D. M., Dunn F. A., Takao M. (2002). Phototransduction by retinal ganglion cells that set the circadian clock. Science 295 1070–1073. 10.1126/science.1067262 - DOI - PubMed
    1. Brainard G. C., Hanifin J. P., Greeson J. M., Byrne B., Glickman G., Gerner E., et al. (2001). Action spectrum for melatonin regulation in humans: evidence for a novel circadian photoreceptor. J. Neurosci. 21 6405–6412. 10.1523/JNEUROSCI.21-16-06405.2001 - DOI - PMC - PubMed
    1. Cajochen C., Frey S., Anders D., Spati J., Bues M., Pross A., et al. (2011). Evening exposure to a light-emitting diodes (LED)-backlit computer screen affects circadian physiology and cognitive performance. J. Appl. Physiol. 110 1432–1438. 10.1152/japplphysiol.00165.2011 - DOI - PubMed
    1. Cajochen C., Khalsa S. B. S., Wyatt J. K., Czeisler C. A., Dijk D.-J. (1999). EEG and ocular correlates of circadian melatonin phase and human performance decrements during sleep loss. Am. J. Physiol. Regul. Integr. Comp. Physiol. 277 R640–R649. 10.1152/ajpregu.1999.277.3.R640 - DOI - PubMed