. 2019 Feb 14:10:125.
doi: 10.3389/fphys.2019.00125. eCollection 2019.

Identification of Gene Expression Changes Associated With Uterine Receptivity in Mice

Affiliations

Identification of Gene Expression Changes Associated With Uterine Receptivity in Mice

Jia-Peng He et al. Front Physiol. .

Abstract

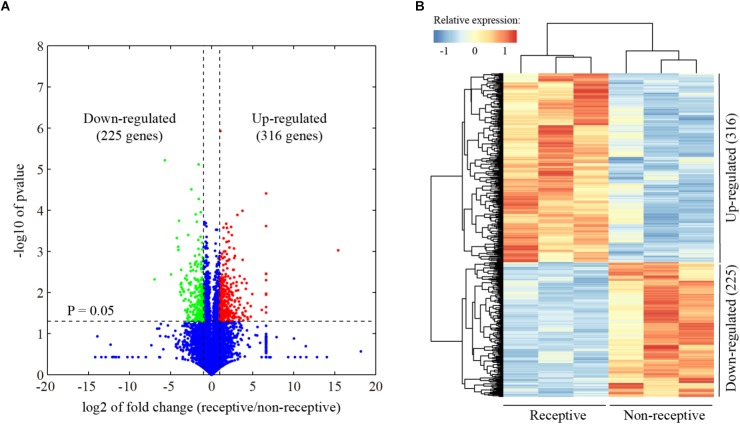
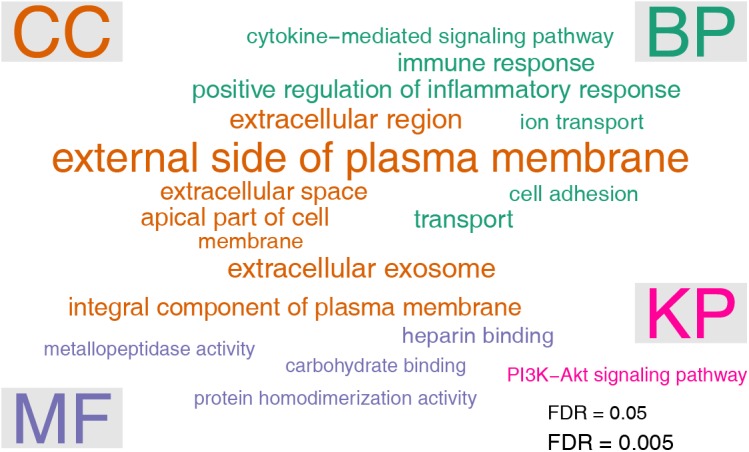
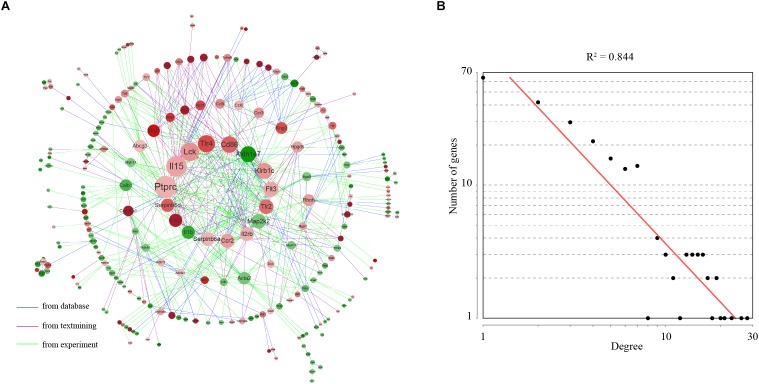
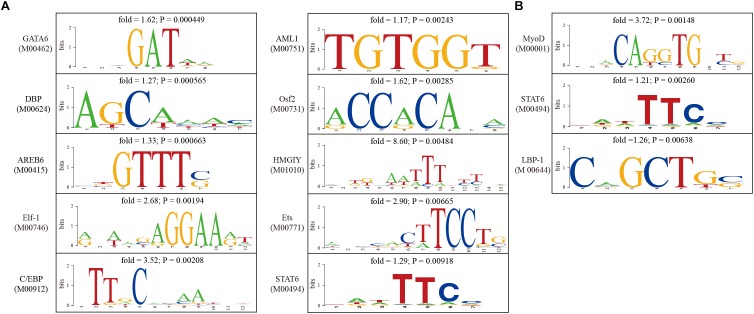
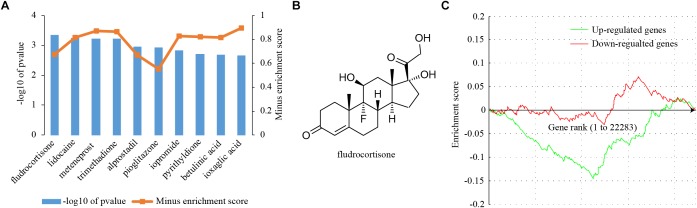
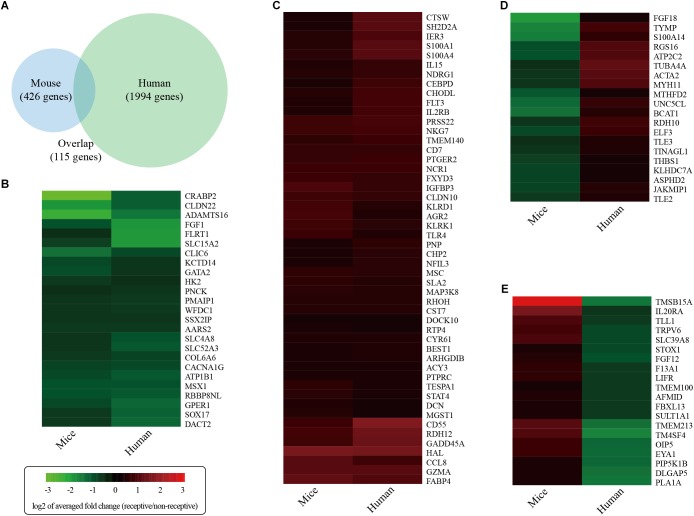
The mouse is a widely used animal model for studying human reproduction. Although global gene expression changes associated with human uterine receptivity have been determined by independent groups, the same studies in the mouse are scarce. The extent of similarities/differences between mice and humans on uterine receptivity at the molecular level remains to be determined. In the present study, we analyzed global gene expression changes in receptive uterus on day 4 of pregnancy compared to non-receptive uterus on day 3 of pregnancy in mice. A total of 541 differentially expressed genes were identified, of which 316 genes were up-regulated and 225 genes were down-regulated in receptive uterus compared to non-receptive uterus. Gene ontology and gene network analysis highlighted the activation of inflammatory response in the receptive uterus. By analyzing the promoter sequences of differentially expressed genes, we identified 12 causal transcription factors. Through connectivity map (CMap) analysis, we revealed several compounds with potential anti-receptivity activity. Finally, we performed a cross-species comparison against human uterine receptivity from a published dataset. Our study provides a valuable resource for understanding the molecular mechanism underlying uterine receptivity in mice.

Keywords: RNA-seq; gene expression; mouse; receptivity; uterus.


Figures

FIGURE 1
FIGURE 1
Identification of differentially expressed genes associated with endometrial receptivity. (A) Volcano plot for the comparison between the receptive endometrium (day 4 of pregnancy) and pre-receptive endometrium (day 3 of pregnancy) in mice. The cutoff values fold change >2 and FDR < 0.01 were utilized to identify differentially expressed genes. Non-changed genes were shown in blue color. Red color is indicative of up-regulated genes and green is indicative of down-regulated genes. (B) Heatmap plot of differentially expressed genes. The Pearson correlation distance metric and the average linkage clustering algorithm were used.
FIGURE 2
FIGURE 2
Validation of selected genes using qRT-PCR. Fold changes determined by RNA-seq and qRT-PCR were presented as the mean ± SEM. Statistical significance was reached at P < 0.05 for all genes except Cxcl17. n = 3.
FIGURE 3
FIGURE 3
Gene ontology (GO) and pathway analysis of differentially expressed genes. The enrichment test was performed by using the DAVID tool. The significance cutoff for FDR was set at 0.05. The font sizes in the word cloud were proportional to –log10 of FDR. GO terms were arranged in three categories: biological process (BP), cellular component (CC), and molecular function (MF), respectively. Pathway analysis was based on KEGG pathway (KP) annotations.
FIGURE 4
FIGURE 4
Gene network underlying differentially expressed genes. (A) The structure of the gene–gene interaction network. Up-regulated genes were colored in red and down-regulated genes were colored in green. The 16 hub genes were showed in the center of the network. Hub genes were defined as genes with degree values exceeding the mean plus two standard deviations. (B) Degree distribution of the network.
FIGURE 5
FIGURE 5
Analysis of transcription factor binding sites in the promoter of differentially expressed genes. (A) The sequence logos for transcription factors whose binding sites were significantly enriched in the promoter of up-regulated genes. (B) The sequence logos for transcription factors whose binding sites were significantly enriched in the promoter of down-regulated genes.
FIGURE 6
FIGURE 6
Connectivity map (CMap) analysis. (A) The enrichment scores of the top 10 chemical drugs from CMap analysis. Differentially expressed genes were queried into CMap and chemical drugs showing a negative enrichment score were considered. (B) The molecular structure of the top-ranked chemical drug, fludrocortisone. (C) A graphical view of the enrichment score for fludrocortisone. The enrichment score is determined by computing a Kolmogorov–Smirnov (KS) statistic separately for the up- and down-regulated genes.
FIGURE 7
FIGURE 7
Global comparison of the gene expression changes associated with endometrial receptivity in mice against humans. (A) Venn diagram showing the overlap of differentially expressed genes between mice and humans. (B) Consistently down-regulated genes. (C) Consistently up-regulated genes. (D) Inconsistently expressed genes that were down-regulated in mice but up-regulated in humans. (E) Inconsistently expressed genes that were up-regulated in mice but down-regulated in humans. Heatmaps were draw according to log2 of averaged fold change values.

Similar articles

Cited by

References

    1. Altmae S., Koel M., Vosa U., Adler P., Suhorutsenko M., Laisk-Podar T., et al. (2017). Meta-signature of human endometrial receptivity: a meta-analysis and validation study of transcriptomic biomarkers. Sci. Rep. 7:10077. 10.1038/s41598-017-10098-3 - DOI - PMC - PubMed
    1. Altmae S., Reimand J., Hovatta O., Zhang P., Kere J., Laisk T., et al. (2012). Research resource: interactome of human embryo implantation: identification of gene expression pathways, regulation, and integrated regulatory networks. Mol. Endocrinol. 26 203–217. 10.1210/me.2011-1196 - DOI - PMC - PubMed
    1. Assenov Y., Ramirez F., Schelhorn S. E., Lengauer T., Albrecht M. (2008). Computing topological parameters of biological networks. Bioinformatics 24 282–284. 10.1093/bioinformatics/btm554 - DOI - PubMed
    1. Bagot C. N., Kliman H. J., Taylor H. S. (2001). Maternal Hoxa10 is required for pinopod formation in the development of mouse uterine receptivity to embryo implantation. Dev. Dyn. 222 538–544. 10.1002/dvdy.1209 - DOI - PubMed
    1. Bai Z. K., Li D. D., Guo C. H., Yang Z. Q., Cao H., Guo B., et al. (2015). Differential expression and regulation of Runx1 in mouse uterus during the peri-implantation period. Cell Tissue Res. 362 231–240. 10.1007/s00441-015-2174-z - DOI - PubMed

LinkOut - more resources