

Alterations of the Mice Gut Microbiome via Schistosoma japonicum Ova-Induced Granuloma
- PMID: 30891012
- PMCID: PMC6411663
- DOI: 10.3389/fmicb.2019.00352
Alterations of the Mice Gut Microbiome via Schistosoma japonicum Ova-Induced Granuloma
Erratum in
-
Corrigendum: Alterations of the Mice Gut Microbiome via Schistosoma japonicum Ova-Induced Granuloma.Front Microbiol. 2019 Apr 9;10:747. doi: 10.3389/fmicb.2019.00747. eCollection 2019. Front Microbiol. 2019. PMID: 31024509 Free PMC article.
Abstract
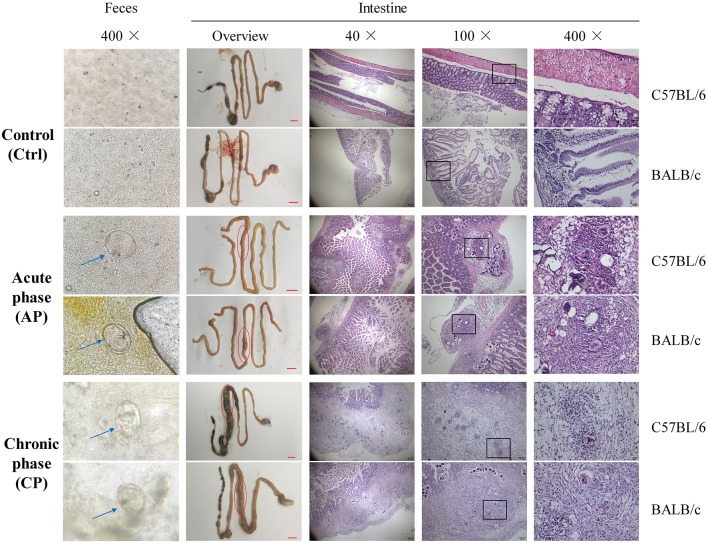
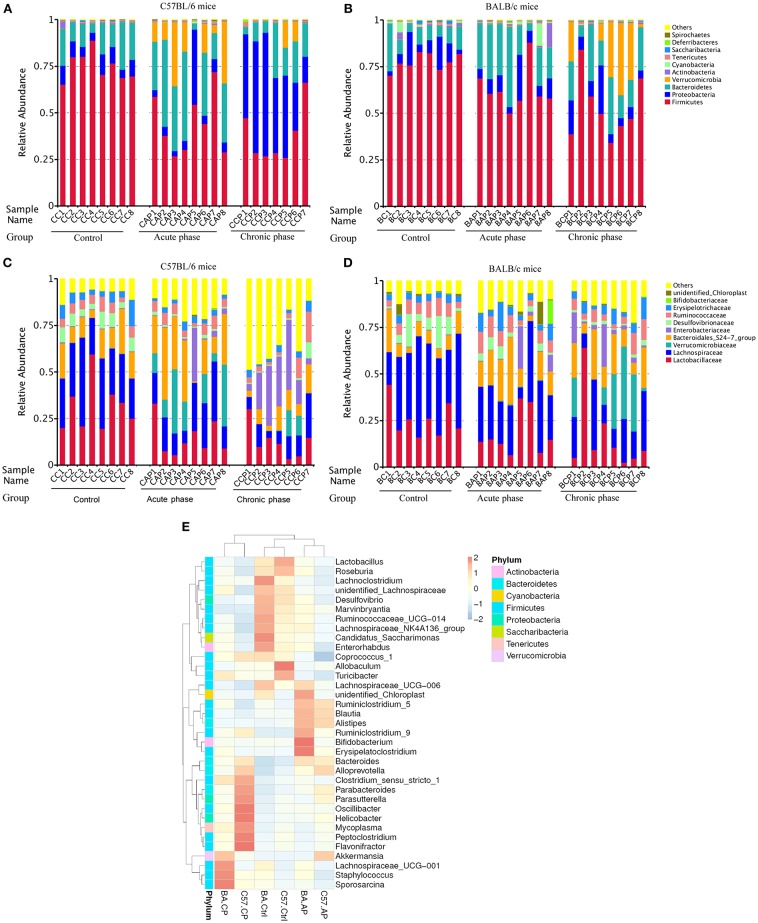
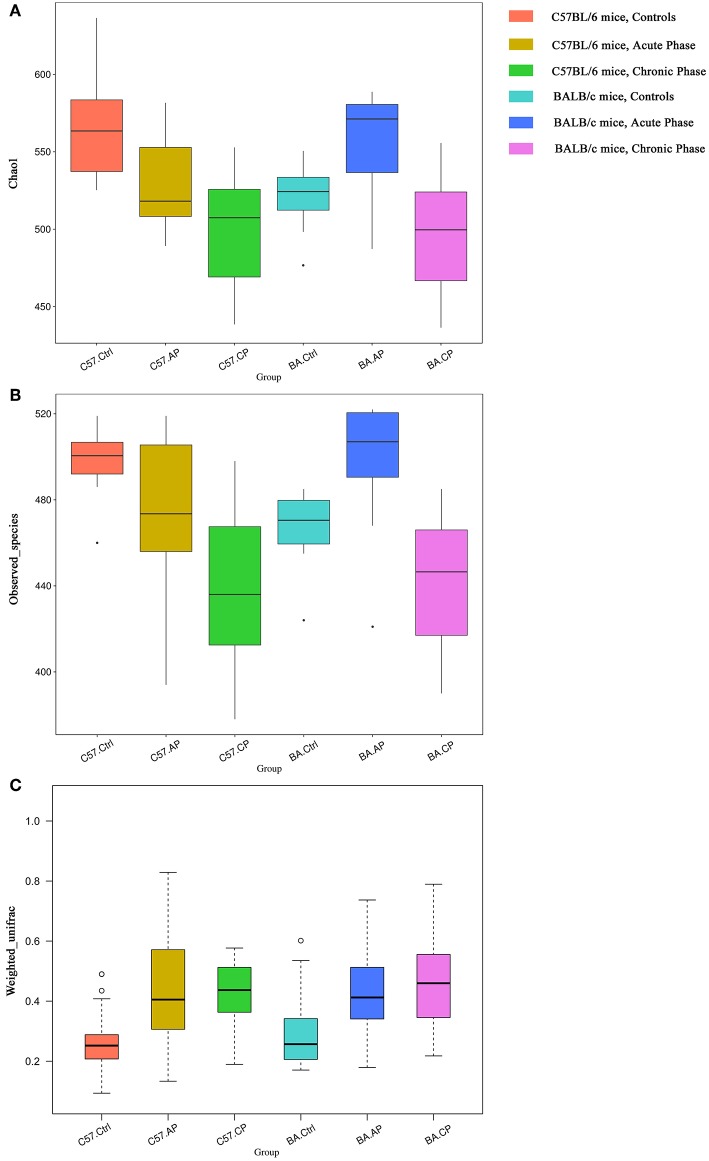
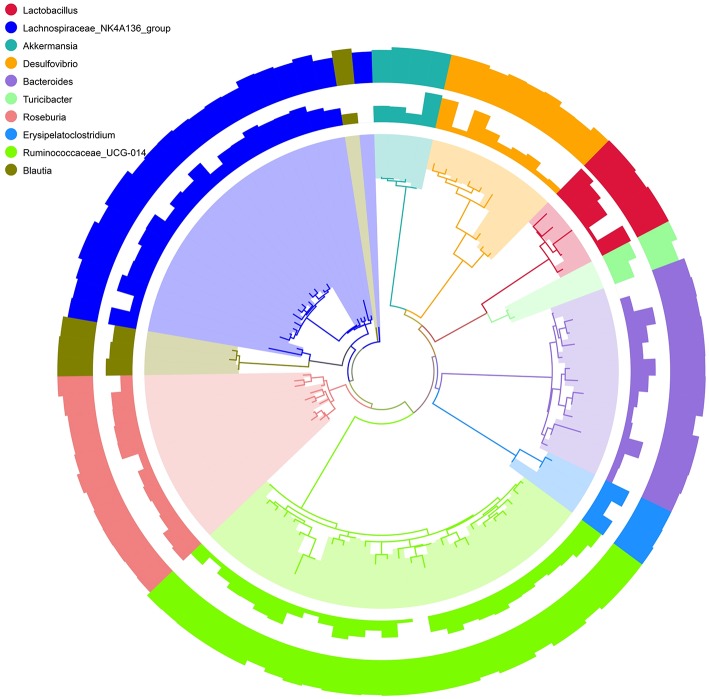
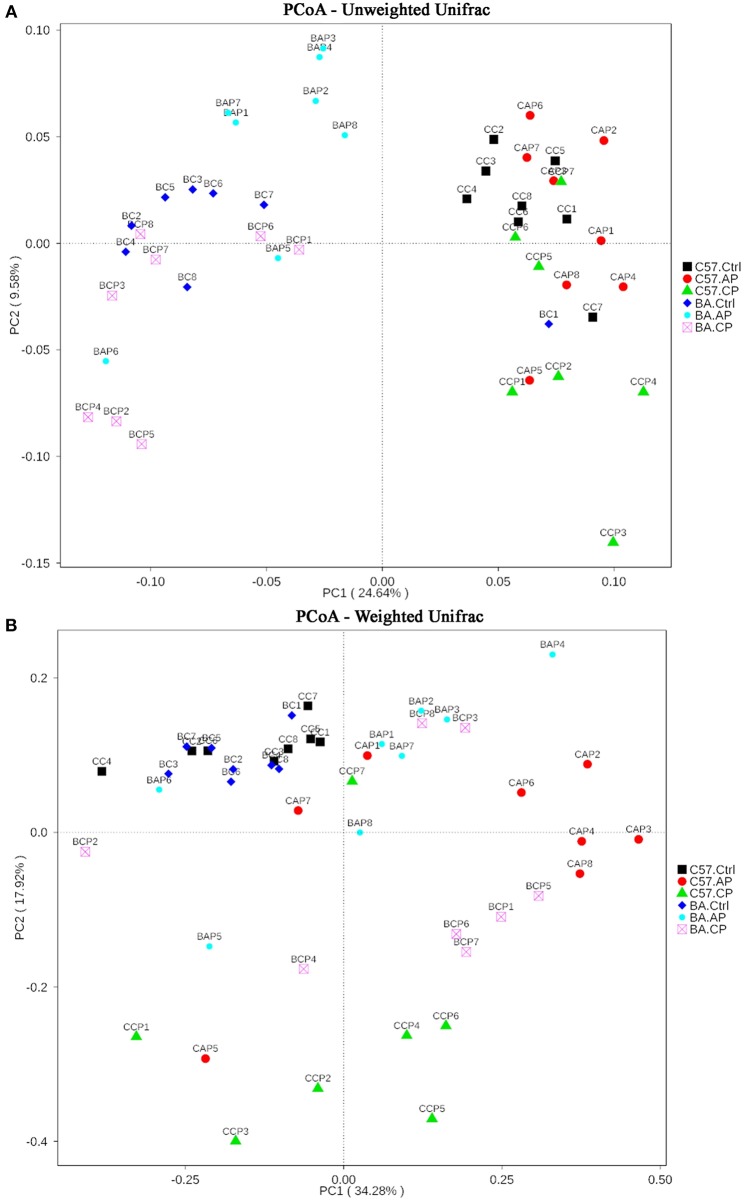
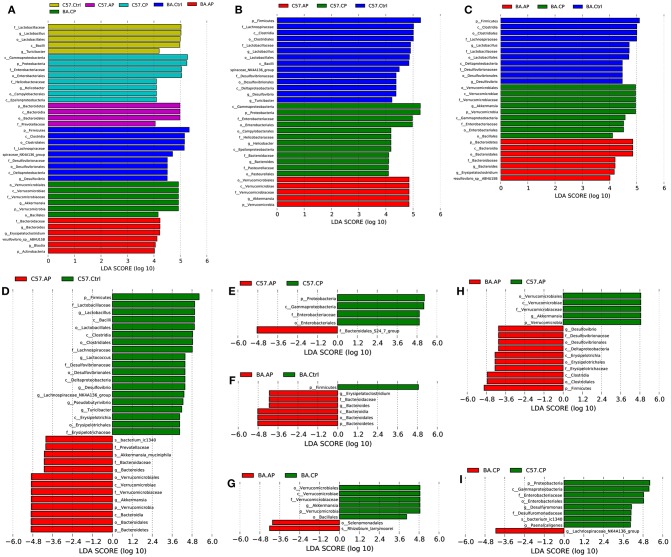
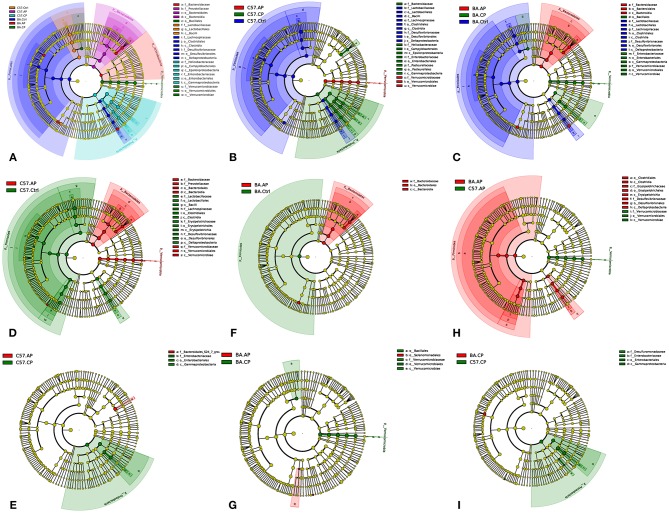
Schistosomiasis, also called bilharziasis, is a neglected tropical disease induced by Schistosoma spp. that causes hundreds of millions of infections. Although Schistosoma ova-induced granulomas commonly cause inflammation, hyperplasia, ulceration, micro abscess formation, and polyposis, the role of the egg granuloma on the gut microbiome remains unclear. To explore the role, gut microbial communities in mice infected with Schistosoma japonicum were surveyed. Female C57BL/6 and BALB/c mice were exposed to cercariae of S. japonicum for 45 and 65 days and then sacrificed. Intestinal contents and feces were collected, DNA was extracted, and high-throughput 16S rRNA gene-based pyrosequencing was used to provide a comparative analysis of gut microbial diversity. The intestinal mucosal tissues were also examined. Histopathologic analysis demonstrated that the basic structure of the colonic mucosa was damaged by ova-induced granuloma. Regarding the gut microbiome, 2,578,303 good-quality sequences were studied and assigned to 25,278 Operational Taxonomic Units (OTUs) at a threshold of 97% similarity. The average number of OTUs for C57BL/6 and BALB/c were 545 and 530, respectively. At the phylum level, intestinal microbial communities were dominated by Firmicutes, Bacteroidetes, Proteobacteria, and Verrucomicrobia. Infection with S. japonicum modified bacterial richness in the fecal associated microbiota. Exposure significantly modified bacterial community composition among different groups. At the phylogenetic levels, LEfSe analysis revealed that several bacterial taxa were significantly associated with the S. japonicum-infected mice. The present results suggest that egg granulomas in the intestine influence differentiation of the gut microbial community under pathophysiological conditions. This result suggests that intestinal microbiome-based strategies should be considered for early diagnosis, clinical treatment, and prognosis evaluation of schistosomiasis.
Keywords: 16S rRNA; Schistosoma japonicum; egg granulomas; gut microbiome; operational taxonomic units.
Figures
Similar articles
-
Alterations of Gut Microbiome and Metabolite Profiling in Mice Infected by Schistosoma japonicum.Front Immunol. 2020 Oct 8;11:569727. doi: 10.3389/fimmu.2020.569727. eCollection 2020. Front Immunol. 2020. PMID: 33162984 Free PMC article.
-
Corrigendum: Alterations of the Mice Gut Microbiome via Schistosoma japonicum Ova-Induced Granuloma.Front Microbiol. 2019 Apr 9;10:747. doi: 10.3389/fmicb.2019.00747. eCollection 2019. Front Microbiol. 2019. PMID: 31024509 Free PMC article.
-
A longitudinal study reveals the alterations of the Microtus fortis colonic microbiota during the natural resistance to Schistosoma japonicum infection.Exp Parasitol. 2020 Dec;219:108030. doi: 10.1016/j.exppara.2020.108030. Epub 2020 Oct 17. Exp Parasitol. 2020. PMID: 33080305
-
Advances in the study of the interaction between schistosome infections and the host's intestinal microorganisms.Parasit Vectors. 2024 Apr 10;17(1):185. doi: 10.1186/s13071-024-06245-1. Parasit Vectors. 2024. PMID: 38600604 Free PMC article. Review.
-
Schistosoma japonicum: the pathology of experimental infection.Exp Parasitol. 1985 Feb;59(1):1-11. doi: 10.1016/0014-4894(85)90051-7. Exp Parasitol. 1985. PMID: 3881266 Review.
Cited by
-
The microbiota-microglia axis in central nervous system disorders.Brain Pathol. 2020 Nov;30(6):1159-1177. doi: 10.1111/bpa.12908. Epub 2020 Nov 5. Brain Pathol. 2020. PMID: 33073887 Free PMC article. Review.
-
Parasite infections, neuroinflammation, and potential contributions of gut microbiota.Front Immunol. 2022 Dec 8;13:1024998. doi: 10.3389/fimmu.2022.1024998. eCollection 2022. Front Immunol. 2022. PMID: 36569929 Free PMC article. Review.
-
A framework for testing the impact of co-infections on host gut microbiomes.Anim Microbiome. 2022 Aug 9;4(1):48. doi: 10.1186/s42523-022-00198-5. Anim Microbiome. 2022. PMID: 35945629 Free PMC article. Review.
-
Pathogenicity of Salmonella During Schistosoma-Salmonella Co-infections and the Importance of the Gut Microbiota.Curr Microbiol. 2021 Dec 14;79(1):26. doi: 10.1007/s00284-021-02718-z. Curr Microbiol. 2021. PMID: 34905113 Free PMC article. Review.
-
Akkermansia muciniphila: A promising probiotic against inflammation and metabolic disorders.Virulence. 2024 Dec;15(1):2375555. doi: 10.1080/21505594.2024.2375555. Epub 2024 Aug 27. Virulence. 2024. PMID: 39192579 Free PMC article. Review.
References
LinkOut - more resources
Full Text Sources
Miscellaneous