

Contrasting patterns of divergence at the regulatory and sequence level in European Daphnia galeata natural populations
- PMID: 30891195
- PMCID: PMC6405927
- DOI: 10.1002/ece3.4894
Contrasting patterns of divergence at the regulatory and sequence level in European Daphnia galeata natural populations
Abstract
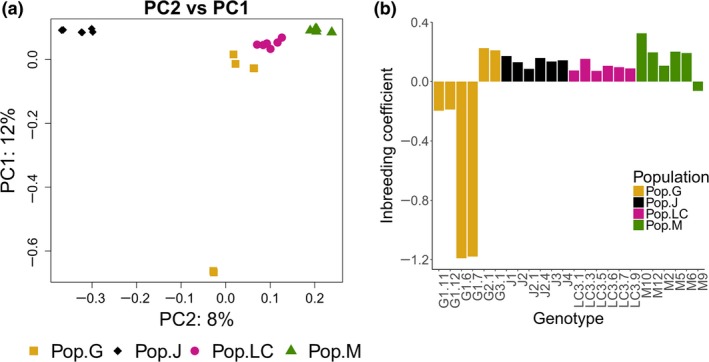
Understanding the genetic basis of local adaptation has long been a focus of evolutionary biology. Recently, there has been increased interest in deciphering the evolutionary role of Daphnia's plasticity and the molecular mechanisms of local adaptation. Using transcriptome data, we assessed the differences in gene expression profiles and sequences in four European Daphnia galeata populations. In total, ~33% of 32,903 transcripts were differentially expressed between populations. Among 10,280 differentially expressed transcripts, 5,209 transcripts deviated from neutral expectations and their population-specific expression pattern is likely the result of local adaptation processes. Furthermore, a SNP analysis allowed inferring population structure and distribution of genetic variation. The population divergence at the sequence level was comparatively higher than the gene expression level by several orders of magnitude consistent with strong founder effects and lack of gene flow between populations. Using sequence homology, the candidate transcripts were annotated using a comparative genomics approach. Additionally, we also performed a weighted gene co-expression analysis to identify population-specific regulatory patterns of transcripts in D. galeata. Thus, we identified candidate transcriptomic regions for local adaptation in this key species of aquatic ecosystems in the absence of any laboratory-induced stressor.
Keywords: DRIFTSEL; RNA‐seq; WGCNA; constitutive gene expression; molecular phenotype; population transcriptomics.
Conflict of interest statement
None declared.
Figures


Similar articles
-
Comparative transcriptome analysis of two Daphnia galeata genotypes displaying contrasting phenotypic variation induced by fish kairomones in the same environment of the Han River, Korea.BMC Genomics. 2023 Oct 2;24(1):580. doi: 10.1186/s12864-023-09701-x. BMC Genomics. 2023. PMID: 37784038 Free PMC article.
-
Population transcriptomics in Daphnia: The role of thermal selection.Mol Ecol. 2018 Jan;27(2):387-402. doi: 10.1111/mec.14450. Epub 2017 Dec 29. Mol Ecol. 2018. PMID: 29220109
-
Cytonuclear diversity and shared mitochondrial haplotypes among Daphnia galeata populations separated by seven thousand kilometres.BMC Evol Biol. 2018 Sep 3;18(1):130. doi: 10.1186/s12862-018-1256-4. BMC Evol Biol. 2018. PMID: 30176793 Free PMC article.
-
Daphnia stressor database: Taking advantage of a decade of Daphnia '-omics' data for gene annotation.Sci Rep. 2019 Jul 31;9(1):11135. doi: 10.1038/s41598-019-47226-0. Sci Rep. 2019. PMID: 31366898 Free PMC article.
-
Plastic and Evolved Responses to Global Change: What Can We Learn from Comparative Transcriptomics?J Hered. 2016 Jan;107(1):71-81. doi: 10.1093/jhered/esv073. Epub 2015 Oct 30. J Hered. 2016. PMID: 26519514 Review.
Cited by
-
Insights into the genetic basis of predator-induced response in Daphnia galeata.Ecol Evol. 2020 Oct 18;10(23):13095-13108. doi: 10.1002/ece3.6899. eCollection 2020 Dec. Ecol Evol. 2020. PMID: 33304520 Free PMC article.
-
Comparative transcriptome analysis of two Daphnia galeata genotypes displaying contrasting phenotypic variation induced by fish kairomones in the same environment of the Han River, Korea.BMC Genomics. 2023 Oct 2;24(1):580. doi: 10.1186/s12864-023-09701-x. BMC Genomics. 2023. PMID: 37784038 Free PMC article.
-
Selection and geography shape male reproductive tract transcriptomes in Drosophila melanogaster.Genetics. 2023 May 4;224(1):iyad034. doi: 10.1093/genetics/iyad034. Genetics. 2023. PMID: 36869688 Free PMC article.
-
Local adaptation contributes to gene expression divergence in maize.G3 (Bethesda). 2021 Feb 9;11(2):jkab004. doi: 10.1093/g3journal/jkab004. G3 (Bethesda). 2021. PMID: 33604670 Free PMC article.
References
-
- Alexa, A. , & Rahnenfuhrer, J. (2016). topGO: Enrichment analysis for gene ontology.
-
- Barata, C. , Baird, D. J. , Mitchell, S. E. , & Soares, A. M. V. M. (2002). Among‐ and within‐population variability in tolerance to cadmium stress in natural populations of Daphnia magna . Environmental Toxicology and Chemistry, 21, 1058–1064. - PubMed
Associated data
LinkOut - more resources
Full Text Sources
Other Literature Sources
