

Characterisation and correlates of stunting among Malaysian children and adolescents aged 6-19 years
- PMID: 30891249
- PMCID: PMC6415126
- DOI: 10.1017/gheg.2019.1
Characterisation and correlates of stunting among Malaysian children and adolescents aged 6-19 years
Abstract
Background: Despite emerging evidence regarding the reversibility of stunting at older ages, most stunting research continues to focus on children below 5 years of age. We aimed to assess stunting prevalence and examine the sociodemographic distribution of stunting risk among older children and adolescents in a Malaysian population.
Methods: We used cross-sectional data on 6759 children and adolescents aged 6-19 years living in Segamat, Malaysia. We compared prevalence estimates for stunting defined using the Centers for Disease Control and Prevention (CDC) and the World Health Organization (WHO) references, using Cohen's κ coefficient. Associations between sociodemographic indices and stunting risk were examined using mixed-effects Poisson regression with robust standard errors.
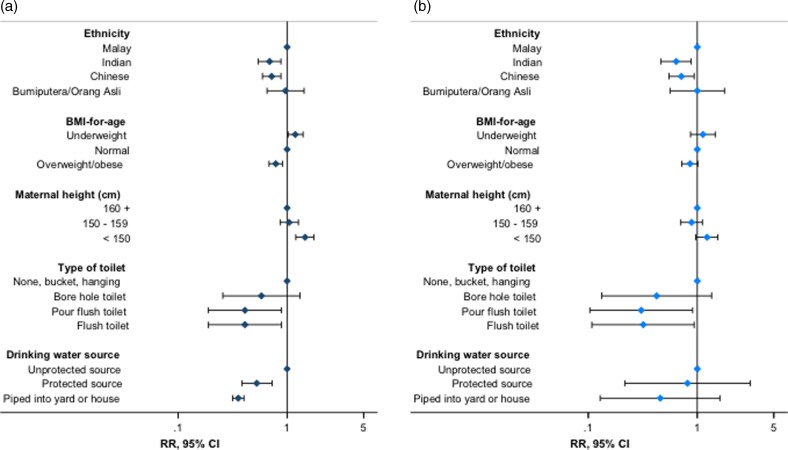
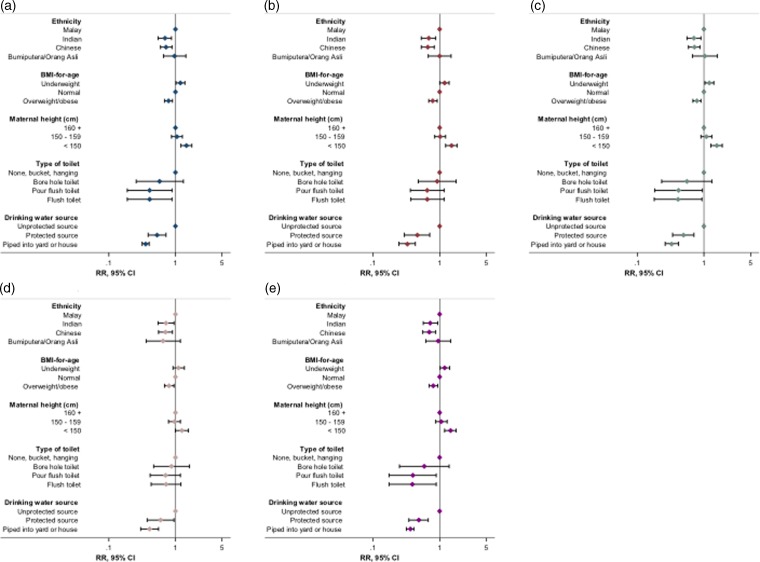
Results: The classification of children and adolescents as stunted or normal height differed considerably between the two references (CDC v. WHO; κ for agreement: 0.73), but prevalence of stunting was high regardless of reference (crude prevalence: CDC 29.2%; WHO: 19.1%). Stunting risk was approximately 19% higher among underweight v. normal weight children and adolescents (p = 0.030) and 21% lower among overweight children and adolescents (p = 0.001), and decreased strongly with improved household drinking water sources [risk ratio (RR) for water piped into house: 0.35, 95% confidence interval (95% CI) 0.30-0.41, p < 0.001). Protective effects were also observed for improved sanitation facilities (RR for flush toilet: 0.41, 95% CI 0.19-0.88, p = 0.023). Associations were not materially affected in multiple sensitivity analyses.
Conclusions: Our findings justify a framework for strategies addressing stunting across childhood, and highlight the need for consensus on a single definition of stunting in older children and adolescents to streamline monitoring efforts.
Keywords: Child nutrition; South East Asia; child stunting; health and demographic surveillance; water and sanitation.
Figures
References
-
- IFPRI (2016) Global Nutrition Report 2016: From Promise to Impact, Ending Malnutrition by 2030. Washington, DC: Institute of Food Policy Research.
-
- Adair LS, Fall CH, Osmond C, Stein AD, Martorell R, Ramirez-Zea M, Sachdev HS, Dahly DL, Bas I, Norris SA, Micklesfield L, Hallal P and Victora CG (2013) Associations of linear growth and relative weight gain during early life with adult health and human capital in countries of low and middle income: findings from five birth cohort studies. Lancet 382, 525–534. - PMC - PubMed
-
- Miller AC, Murray MB, Thomson DR and Arbour MC (2016) How consistent are associations between stunting and child development? Evidence from a meta-analysis of associations between stunting and multidimensional child development in fifteen low- and middle-income countries. Public Health Nutrition 19, 1339–1347. - PMC - PubMed
Publication types
MeSH terms
Grants and funding
LinkOut - more resources
Full Text Sources
Medical