

Studying the effects of haplotype partitioning methods on the RA-associated genomic results from the North American Rheumatoid Arthritis Consortium (NARAC) dataset
- PMID: 30891314
- PMCID: PMC6403413
- DOI: 10.1016/j.jare.2019.01.006
Studying the effects of haplotype partitioning methods on the RA-associated genomic results from the North American Rheumatoid Arthritis Consortium (NARAC) dataset
Abstract
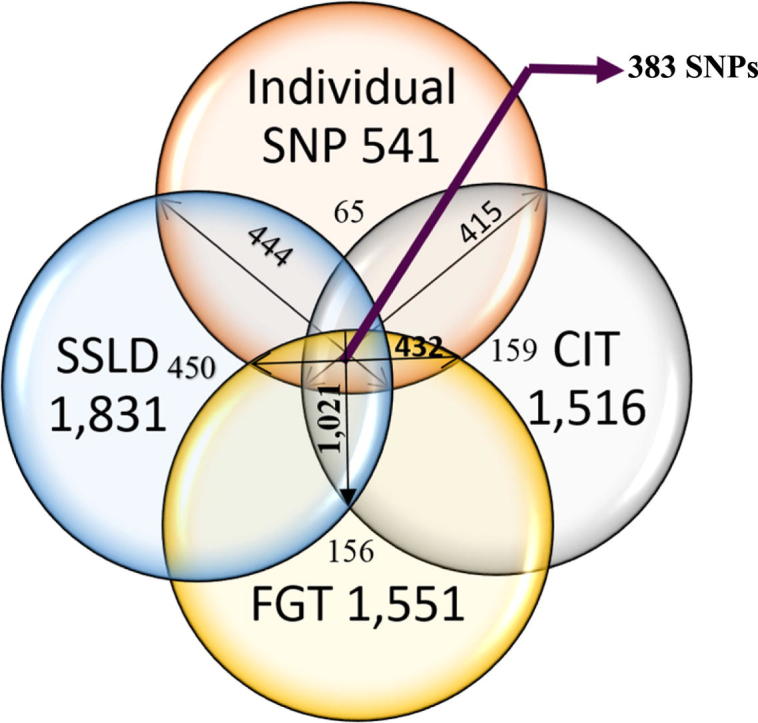
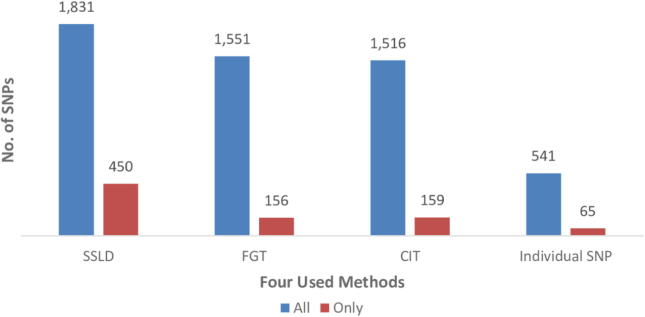
The human genome, which includes thousands of genes, represents a big data challenge. Rheumatoid arthritis (RA) is a complex autoimmune disease with a genetic basis. Many single-nucleotide polymorphism (SNP) association methods partition a genome into haplotype blocks. The aim of this genome wide association study (GWAS) was to select the most appropriate haplotype block partitioning method for the North American Rheumatoid Arthritis Consortium (NARAC) dataset. The methods used for the NARAC dataset were the individual SNP approach and the following haplotype block methods: the four-gamete test (FGT), confidence interval test (CIT), and solid spine of linkage disequilibrium (SSLD). The measured parameters that reflect the strength of the association between the biomarker and RA were the P-value after Bonferroni correction and other parameters used to compare the output of each haplotype block method. This work presents a comparison among the individual SNP approach and the three haplotype block methods to select the method that can detect all the significant SNPs when applied alone. The GWAS results from the NARAC dataset obtained with the different methods are presented. The individual SNP, CIT, FGT, and SSLD methods detected 541, 1516, 1551, and 1831 RA-associated SNPs respectively, and the individual SNP, FGT, CIT, and SSLD methods detected 65, 156, 159, and 450 significant SNPs respectively, that were not detected by the other methods. Three hundred eighty-three SNPs were discovered by the haplotype block methods and the individual SNP approach, while 1021 SNPs were discovered by all three haplotype block methods. The 383 SNPs detected by all the methods are promising candidates for studying RA susceptibility. A hybrid technique involving all four methods should be applied to detect the significant SNPs associated with RA in the NARAC dataset, but the SSLD method may be preferred because of its advantages when only one method was used.
Keywords: Confidence interval test; Four-gamete test; Genome-wide association study; NARAC; Rheumatoid arthritis; Solid spine of linkage disequilibrium.
Figures
Similar articles
-
Comparative study for haplotype block partitioning methods - Evidence from chromosome 6 of the North American Rheumatoid Arthritis Consortium (NARAC) dataset.PLoS One. 2018 Dec 31;13(12):e0209603. doi: 10.1371/journal.pone.0209603. eCollection 2018. PLoS One. 2018. PMID: 30596705 Free PMC article.
-
Association of an activity-enhancing variant of IRAK1 and an MECP2-IRAK1 haplotype with increased susceptibility to rheumatoid arthritis.Arthritis Rheum. 2013 Mar;65(3):590-8. doi: 10.1002/art.37804. Arthritis Rheum. 2013. PMID: 23233309
-
The chromosome 7q region association with rheumatoid arthritis in females in a British population is not replicated in a North American case-control series.Arthritis Rheum. 2009 Jan;60(1):47-52. doi: 10.1002/art.24180. Arthritis Rheum. 2009. PMID: 19116934 Free PMC article.
-
Identification of rheumatoid arthritis biomarkers based on single nucleotide polymorphisms and haplotype blocks: A systematic review and meta-analysis.J Adv Res. 2016 Jan;7(1):1-16. doi: 10.1016/j.jare.2015.01.008. Epub 2015 Feb 4. J Adv Res. 2016. PMID: 26843965 Free PMC article. Review.
-
[Analysis and application of SNP and haplotype in the human genome].Yi Chuan Xue Bao. 2005 Aug;32(8):879-89. Yi Chuan Xue Bao. 2005. PMID: 16231744 Review. Chinese.
Cited by
-
Genetic architecture of type 1 diabetes with low genetic risk score informed by 41 unreported loci.Commun Biol. 2021 Jul 23;4(1):908. doi: 10.1038/s42003-021-02368-8. Commun Biol. 2021. PMID: 34302048 Free PMC article.
-
LncRNA LZTS1-AS1 induces proliferation, metastasis and inhibits autophagy of pancreatic cancer cells through the miR-532 /TWIST1 signaling pathway.Cancer Cell Int. 2023 Jul 4;23(1):130. doi: 10.1186/s12935-023-02979-7. Cancer Cell Int. 2023. PMID: 37403096 Free PMC article.
-
Prdm16-dependent antigen-presenting cells induce tolerance to intestinal antigens.bioRxiv [Preprint]. 2025 Mar 3:2024.07.23.604803. doi: 10.1101/2024.07.23.604803. bioRxiv. 2025. Update in: Nature. 2025 Jun;642(8068):756-765. doi: 10.1038/s41586-025-08982-4. PMID: 39091750 Free PMC article. Updated. Preprint.
-
The identification of blood-derived response eQTLs reveals complex effects of regulatory variants on inflammatory and infectious disease risk.PLoS Genet. 2025 Apr 10;21(4):e1011599. doi: 10.1371/journal.pgen.1011599. eCollection 2025 Apr. PLoS Genet. 2025. PMID: 40208878 Free PMC article.
-
Genetics of rheumatoid arthritis.Semin Immunopathol. 2022 Jan;44(1):47-62. doi: 10.1007/s00281-022-00912-0. Epub 2022 Jan 27. Semin Immunopathol. 2022. PMID: 35088123 Free PMC article. Review.
References
-
- Saad M.N., Mabrouk M.S., Eldeib A.M., Shaker O.G. 7th Cairo international biomedical engineering conference. IEEE; Cairo, Egypt: 2014. Vitamin D receptor gene polymorphisms in rheumatoid arthritis patients associating osteoporosis; pp. 75–78.
-
- Saad M.N., Mabrouk M.S., Eldeib A.M., Shaker O.G. Effect of MTHFR, TGFβ1, and TNFB polymorphisms on osteoporosis in rheumatoid arthritis patients. Gene. 2015;568(2):124–128. - PubMed
Grants and funding
LinkOut - more resources
Full Text Sources
