. 2019 Feb 19;10(3):1282-1296.
doi: 10.1364/BOE.10.001282. eCollection 2019 Mar 1.

Multi-fiber distributed thermal profiling of minimally invasive thermal ablation with scattering-level multiplexing in MgO-doped fibers

Affiliations

Multi-fiber distributed thermal profiling of minimally invasive thermal ablation with scattering-level multiplexing in MgO-doped fibers

Aidana Beisenova et al. Biomed Opt Express. .

Abstract

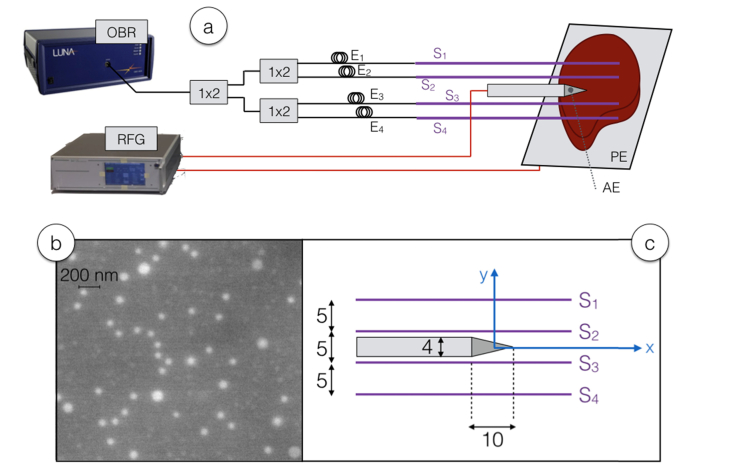
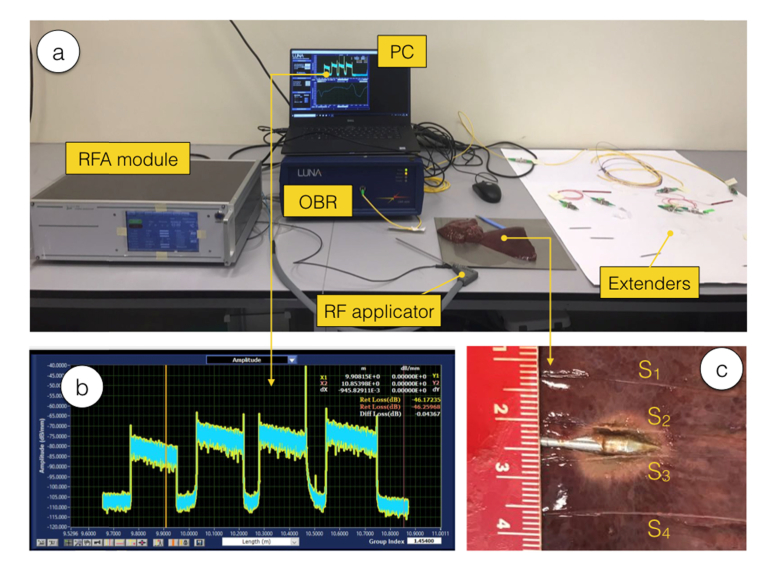
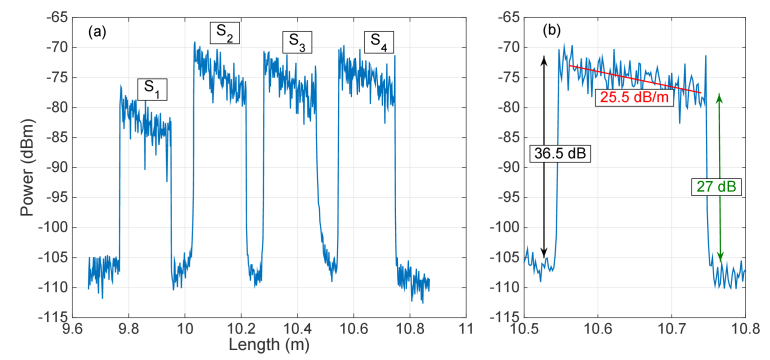
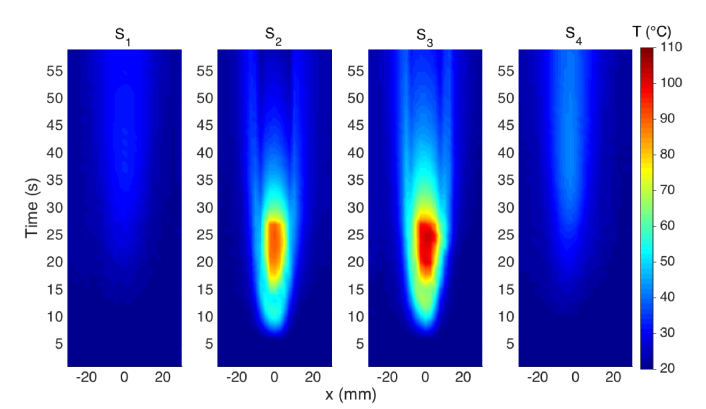
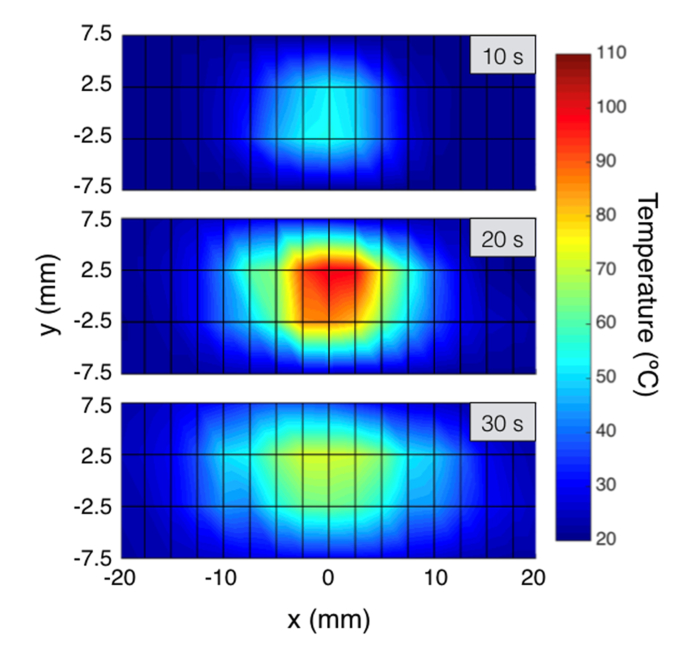
We propose a setup for multiplexed distributed optical fiber sensors capable of resolving temperature distribution in thermo-therapies, with a spatial resolution of 2.5 mm over multiple fibers interrogated simultaneously. The setup is based on optical backscatter reflectometry (OBR) applied to optical fibers having backscattered power significantly larger than standard fibers (36.5 dB), obtained through MgO doping. The setup is based on a scattering-level multiplexing, which allows interrogating all the sensing fibers simultaneously, thanks to the fact that the backscattered power can be unambiguously associated to each fiber. The setup has been validated for the planar measurement of temperature profiles in ex vivo radiofrequency ablation, obtaining the measurement of temperature over a surface of 96 total points (4 fibers, 8 sensing points per cm2). The spatial resolution obtained for the planar measurement allows extending distributed sensing to surface, or even three-dimensional, geometries performing temperature sensing in the tissue with millimeter resolution in multiple dimensions.


Conflict of interest statement

The authors declare that there are no conflicts of interest related to this article.

Figures

Fig. 1
Fig. 1
Schematic of the RFA ablation and distributed sensing interrogation setup. (a) View of the whole setup, including OBR-based sensing with fibers and extenders, and the RF setup with applicator introduced into the phantom. (b) SEM (scanning electron microscope) view of a section of the core of the sensing fiber, highlighting the presence of MgO nanoparticles in the core. (c) Geometrical sketch of the position of the RF applicator and the fibers S1-S4, and their relative positions with respect to the xy coordinates; all sizes are in mm.
Fig. 2
Fig. 2
Photograph of the experimental setup. (a) View of the whole setup. (b) Inset on the scattering trace acquired on the OBR. (c) View of the ablated phantom and the sensor location after the RFA experiment; ruler scale in cm.
Fig. 3
Fig. 3
Thermal response of the MgO-doped sensing fiber.
Fig. 4
Fig. 4
Scattering characterization of the proposed setup. (a) Backscattered power as a function of length, as recorded on the OBR, for each fiber length. The chart identifies the 4 sensing regions S1 – S4, each having ~20 cm length of MgO-doped fiber. (b) Inset of the left chart, showing an individual sensing region, with estimation of scattering “gain” G, fiber attenuation 2α, and signal-to-noise ratio.
Fig. 5
Fig. 5
Thermal maps reporting the measured temperature as a function of distance along the fiber (direction x) and time for each of the four sensing elements, located at coordinates y = −7.5 mm (S1), y = −2.5 mm (S2), y = 2.5 mm (S3), y = 7.5 mm (S4).
Fig. 6
Fig. 6
Two-dimensional thermal maps, reporting temperature on the xy plane for different elapsed time (10 s, 20 s, 30 s). The plain considered is 15 × 40 mm, corresponding to a grid of 4 × 17 sensing point, spaced 5 mm on y axis and 2.5 mm on x axis. See Visualization 1.
Fig. 7
Fig. 7
Temporal and spatial temperature gradients reported after 25 s elapsed during RFA. (a) Time gradients reported in °C/s; (b) spatial gradients reported as field lines pointing from the colder to hotter points.

Similar articles

Cited by

References

    1. Goldberg S. N., Gazelle G. S., Compton C. C., Mueller P. R., Tanabe K. K., “Treatment of intrahepatic malignancy with radiofrequency ablation,” Cancer 88(11), 2452–2463 (2000).10.1002/1097-0142(20000601)88:11<2452::AID-CNCR5>3.0.CO;2-3 - DOI - PubMed
    1. Ahmed M., Brace C. L., Lee F. T., Jr., Goldberg S. N., “Principles of and advances in percutaneous ablation,” Radiology 258(2), 351–369 (2011).10.1148/radiol.10081634 - DOI - PMC - PubMed
    1. Padma S., Martinie J. B., Iannitti D. A., “Liver tumor ablation: percutaneous and open approaches,” J. Surg. Oncol. 100(8), 619–634 (2009).10.1002/jso.21364 - DOI - PubMed
    1. Sapareto S. A., Dewey W. C., “Thermal dose determination in cancer therapy,” Int. J. Radiat. Oncol. Biol. Phys. 10(6), 787–800 (1984).10.1016/0360-3016(84)90379-1 - DOI - PubMed
    1. Shaw A., ter Haar G., Haller J., Wilkens V., “Towards a dosimetric framework for therapeutic ultrasound,” Int. J. Hyperthermia 31(2), 182–192 (2015).10.3109/02656736.2014.997311 - DOI - PubMed