

Power spectrum of spontaneous cerebral homodynamic oscillation shows a distinct pattern in autism spectrum disorder
- PMID: 30891353
- PMCID: PMC6420268
- DOI: 10.1364/BOE.10.001383
Power spectrum of spontaneous cerebral homodynamic oscillation shows a distinct pattern in autism spectrum disorder
Abstract
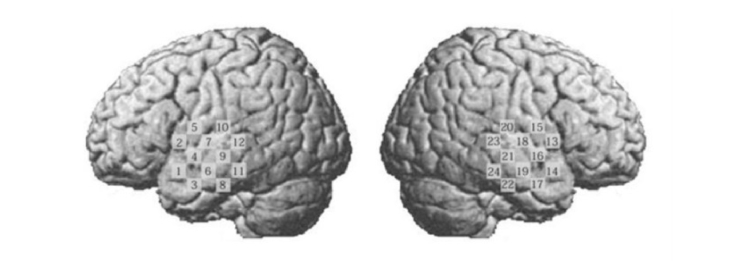
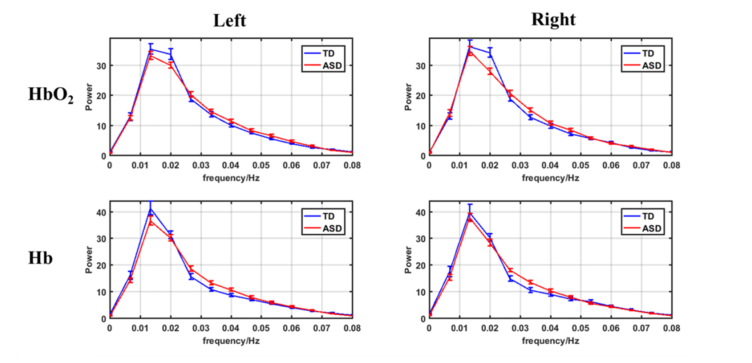
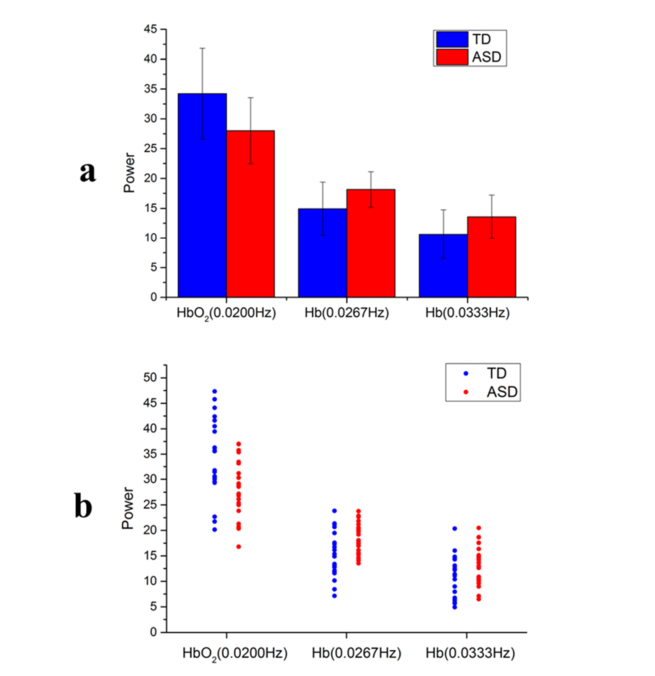
Spontaneous hemodynamic fluctuations recorded by functional near-infrared spectroscopy (fNIRS) from bilateral temporal lobes were analyzed on 25 children with autism spectrum disorder (ASD) and 22 typically developing (TD) children. By frequency domain analysis, a new characteristic was uncovered that the power spectrum of low frequency cerebral hemodynamic oscillation showed a distinct pattern in ASD. More specifically, at the frequency of 0.0200 Hz, the power of oxygenated hemoglobin was larger for TD than ASD, whereas in the band of 0.0267-0.0333 Hz, the power of deoxygenated hemoglobin was larger for ASD than TD. Using these new features and those identified previously together as feature variables for the support vector machine (SVM) classifier, accurate classification between ASD and TD was achieved with a sensitivity of 90.2%, specificity of 95.1% and accuracy of 92.7%.
Conflict of interest statement
The authors declare that there are no conflicts of interest related to this article.
Figures
Similar articles
-
Narrowband Resting-State fNIRS Functional Connectivity in Autism Spectrum Disorder.Front Hum Neurosci. 2021 Jun 15;15:643410. doi: 10.3389/fnhum.2021.643410. eCollection 2021. Front Hum Neurosci. 2021. PMID: 34211379 Free PMC article.
-
Characterization of autism spectrum disorder with spontaneous hemodynamic activity.Biomed Opt Express. 2016 Sep 6;7(10):3871-3881. doi: 10.1364/BOE.7.003871. eCollection 2016 Oct 1. Biomed Opt Express. 2016. PMID: 27867699 Free PMC article.
-
Relationship between Short-Range and Homotopic Long-Range Resting State Functional Connectivity in Temporal Lobes in Autism Spectrum Disorder.Brain Sci. 2021 Nov 5;11(11):1467. doi: 10.3390/brainsci11111467. Brain Sci. 2021. PMID: 34827466 Free PMC article.
-
Classification of autism spectrum disorder based on sample entropy of spontaneous functional near infra-red spectroscopy signal.Clin Neurophysiol. 2020 Jun;131(6):1365-1374. doi: 10.1016/j.clinph.2019.12.400. Epub 2020 Jan 13. Clin Neurophysiol. 2020. PMID: 32311592
-
Exploring brain functions in autism spectrum disorder: A systematic review on functional near-infrared spectroscopy (fNIRS) studies.Int J Psychophysiol. 2019 Mar;137:41-53. doi: 10.1016/j.ijpsycho.2019.01.003. Epub 2019 Jan 19. Int J Psychophysiol. 2019. PMID: 30664885
Cited by
-
Detectability of hemodynamic oscillations in cerebral cortex through functional near-infrared spectroscopy: a simulation study.Neurophotonics. 2024 Jul;11(3):035001. doi: 10.1117/1.NPh.11.3.035001. Epub 2024 Jul 3. Neurophotonics. 2024. PMID: 38962430 Free PMC article.
-
Prediction in Autism by Deep Learning Short-Time Spontaneous Hemodynamic Fluctuations.Front Neurosci. 2019 Nov 8;13:1120. doi: 10.3389/fnins.2019.01120. eCollection 2019. Front Neurosci. 2019. PMID: 31780879 Free PMC article.
-
Assessment of power spectral density of microvascular hemodynamics in skeletal muscles at very low and low-frequency via near-infrared diffuse optical spectroscopies.Biomed Opt Express. 2023 Oct 26;14(11):5994-6015. doi: 10.1364/BOE.502618. eCollection 2023 Nov 1. Biomed Opt Express. 2023. PMID: 38021143 Free PMC article.
-
Correlation and predictive ability of sensory characteristics and social interaction in children with autism spectrum disorder.Front Psychiatry. 2023 Apr 6;14:1056051. doi: 10.3389/fpsyt.2023.1056051. eCollection 2023. Front Psychiatry. 2023. PMID: 37091701 Free PMC article.
-
Narrowband Resting-State fNIRS Functional Connectivity in Autism Spectrum Disorder.Front Hum Neurosci. 2021 Jun 15;15:643410. doi: 10.3389/fnhum.2021.643410. eCollection 2021. Front Hum Neurosci. 2021. PMID: 34211379 Free PMC article.
References
-
- Luyster R., Gotham K., Guthrie W., Coffing M., Petrak R., Pierce K., Bishop S., Esler A., Hus V., Oti R., Richler J., Risi S., Lord C., “The Autism Diagnostic Observation Schedule-toddler module: a new module of a standardized diagnostic measure for autism spectrum disorders,” J. Autism Dev. Disord. 39(9), 1305–1320 (2009).10.1007/s10803-009-0746-z - DOI - PMC - PubMed
LinkOut - more resources
Full Text Sources