Multicenter Study
. 2019 Oct;70(4):1134-1149.
doi: 10.1002/hep.30617. Epub 2019 May 27.

Biomarkers of Macrophage Activation and Immune Danger Signals Predict Clinical Outcomes in Alcoholic Hepatitis

Affiliations
Multicenter Study

Biomarkers of Macrophage Activation and Immune Danger Signals Predict Clinical Outcomes in Alcoholic Hepatitis

Banishree Saha et al. Hepatology. 2019 Oct.

Abstract

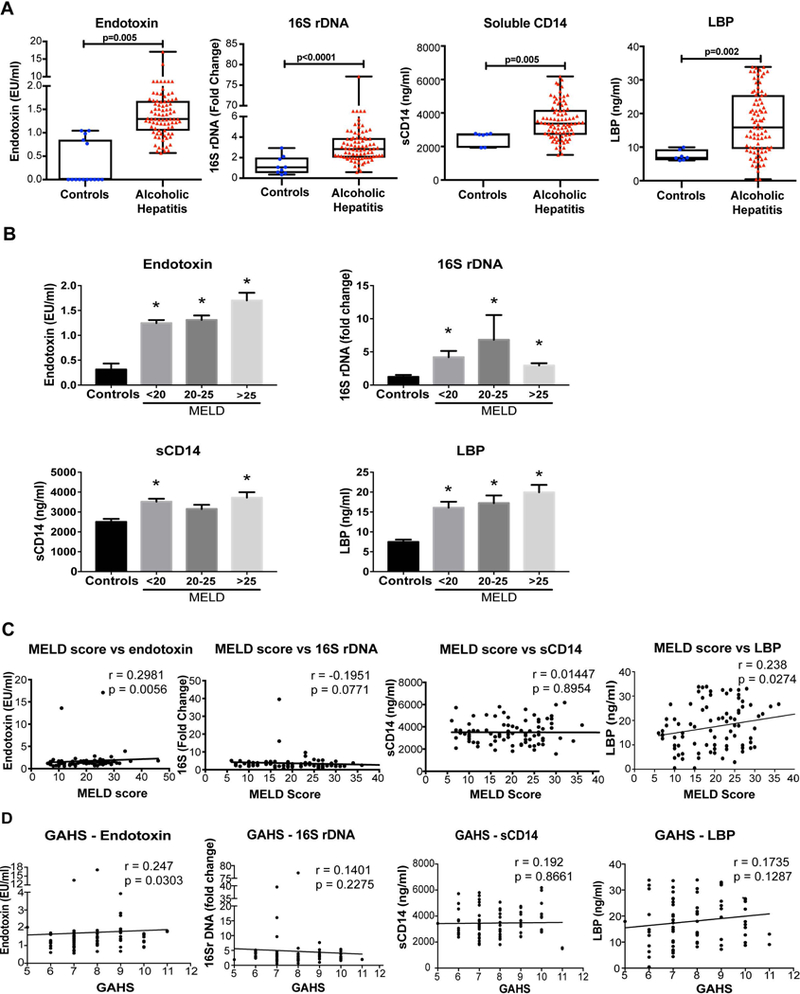
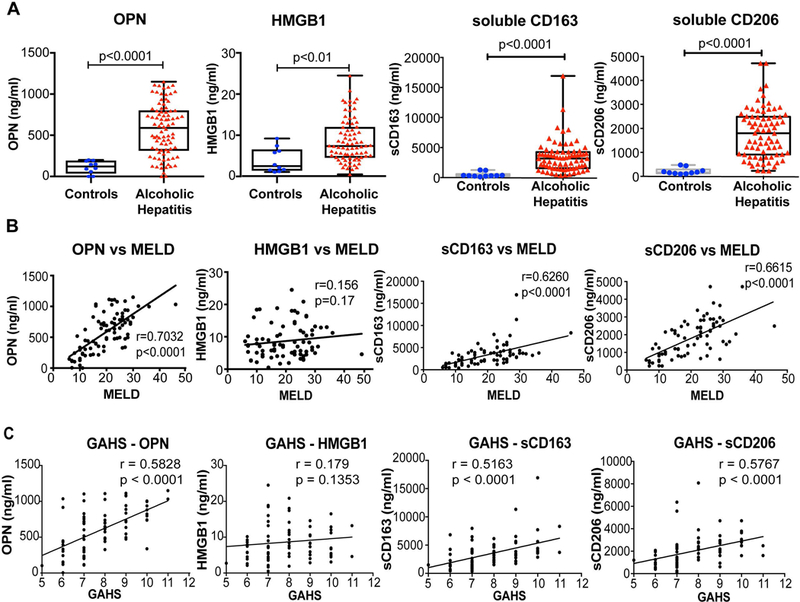
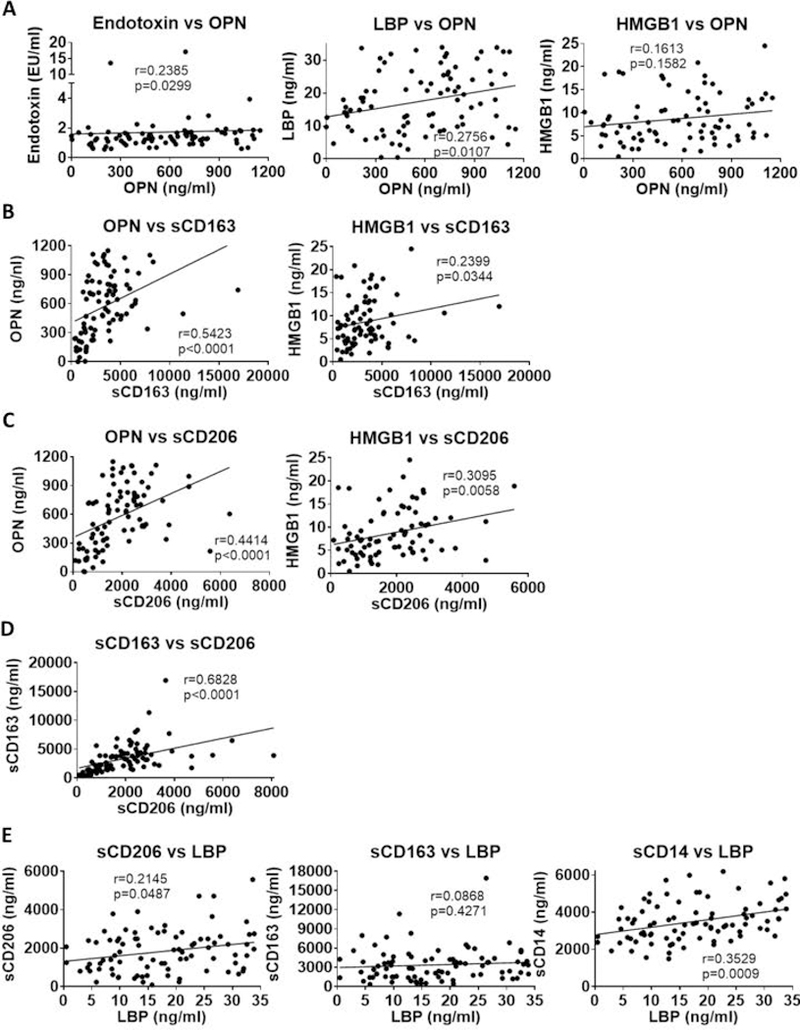
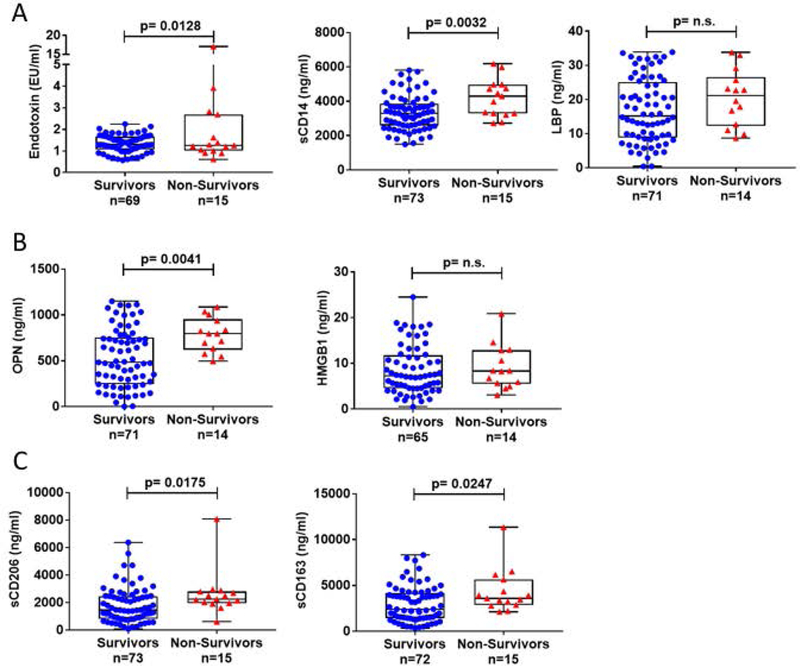
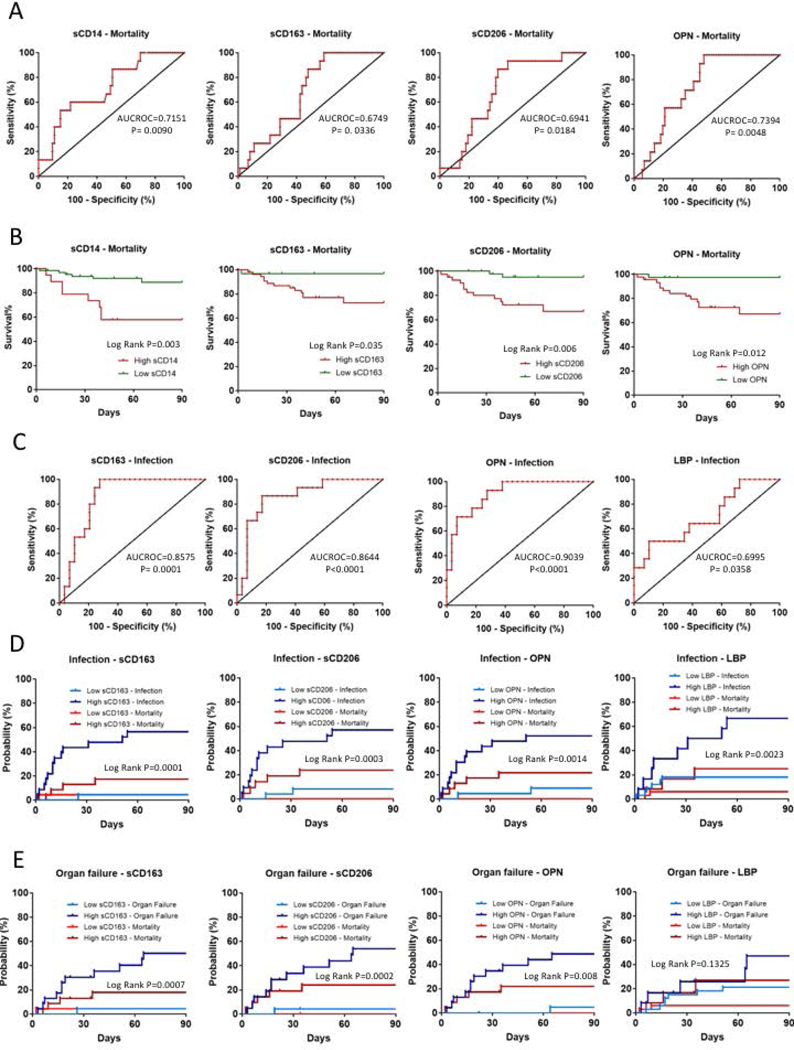
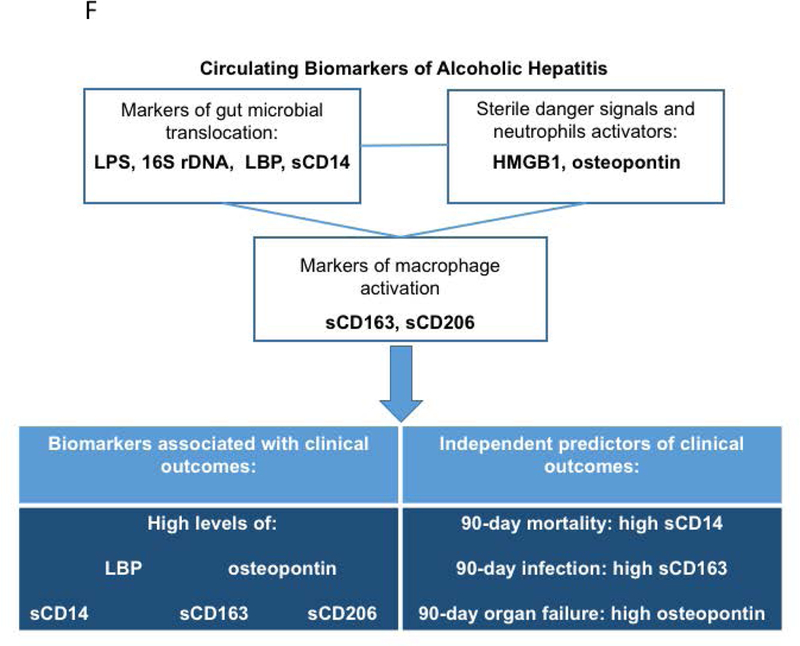
Although mortality due to acute alcoholic hepatitis (AH) correlates with Model for End-Stage Liver Disease (MELD) scores, biomarkers are critically needed to manage this disease. Increases in inflammatory markers and macrophage activation are associated with acute AH and could be potential biomarkers of clinical events and/or mortality. We enrolled 89 clinically diagnosed AH patients in four US academic medical centers. Plasma from AH patients had a significant increase in gut microbial translocation indicators (endotoxin, bacterial 16S ribosomal DNA) and host response indicators (soluble cluster of differentiation 14 [sCD14] and lipopolysaccharide binding protein [LBP]) compared to controls. Patient MELD score and Glasgow Alcoholic Hepatitis score (GAHS) correlated with endotoxin levels. AH patients also had a significant increase in high mobility group protein 1 (HMGB1), a sterile danger signal molecule, and osteopontin (OPN), a multifunctional phosphoprotein involved in neutrophil activation, compared to controls. Increased levels of OPN positively correlated with increasing MELD score, GAHS, and LBP levels. Consistent with these results, AH patients had significantly increased circulating levels of macrophage activation (sCD163 and sCD206) markers compared to healthy controls, and sCD163 and sCD206 significantly and positively correlated with OPN, HMGB1, and LBP levels as well as with MELD score and GAHS. These findings indicate a connection between microbial translocation, immune cell activation, and AH severity. Plasma sCD14, OPN, sCD163, and sCD206 levels were significantly higher in nonsurvivors than survivors. In multivariate regression models, we identified sCD14, sCD163, and OPN as independent predictors of 90-day mortality, infection, and organ failure development, respectively. Conclusion: Our study suggests that sCD14, LBP, OPN, sCD163, and sCD206 are biomarkers to indicate severity and predict clinical outcomes in AH.


Figures

Figure 1.
Figure 1.. Increased levels of gut microbial translocation markers in AH are associated with disease severity.
(A) The levels of endotoxin, 16S rDNA, soluble CD14, and lipopolysaccharide binding protein (LBP) were determined in the plasma of AH patients and compared to healthy controls. The data is represented as minimum to maximum, showing all the points and the p-value is calculated by nonparametric Mann-Whitney Test (n=10–87). (B) Plasma endotoxin, 16S rDNA, soluble CD14 and LBP values of patients were grouped by disease severity according MELD score categories and plotted in a graph. The data are shown as Mean± SE, *p<0.05 compared to controls. MELD scores (C) and Glasgow Alcoholic Hepatitis Scores (GAHS) (D) of the AH patients were plotted against plasma levels of endotoxin, 16S rDNA, sCD14 and LBP. Spearman’s correlation coefficient, (r) was determined to measure the direction (positive or negative) and the significance (p) and of association between MELD score and other variables. In the 16S, sCD14 and LBP plots one data point is outside the range of axes and not shown but was used in the statistical analysis.
Figure 2.
Figure 2.. Increase in neutrophil attractant molecules and macrophage activation marker levels in AH patients, correlate with disease severity.
(A) The levels of OPN, HMGB1, sCD163 and sCD206 were determined in the plasma and values of AH patients were compared to healthy controls. The data is represented as minimum to maximum, showing all the points and the p-values are calculated by nonparametric Mann-Whitney Test (n=10–87). Spearman’s correlation analyses of MELD score (B) and Glasgow Alcoholic Hepatitis Score (GAHS) (C) with OPN, HMGB1, sCD163 and sCD206 were performed and r coefficients and p-values were calculated.
Figure 3.
Figure 3.. Correlation between bacterial translocation, neutrophil attractant molecules and macrophage activation markers in AH patients.
(A-E) Correlation analyses of various parameters were done using Spearman’s correlation. Significance levels (p) and correlation coefficients (r) and are given.
Figure 4.
Figure 4.. Plasma endotoxin, neutrophil and macrophage activation markers are increased in non-survivor AH patients at 90 days.
(A-C) The levels of endotoxin, sCD14, LBP, OPN HMGB1, sCD163 andsCD206, were determined in AH patients grouped as survivors versus non-survivors. The data is represented as minimum to maximum, showing all the points and the p-values are calculated by parametric T-test or nonparametric Mann-Whitney test as it was indicated by the distribution of the markers (n=14–73).
Figure 5.
Figure 5.. Ninety-day mortality, infection and organ failure development in alcoholic hepatitis patients.
(A) ROC analyses of 690-day mortality to test prognostic efficiency of sCD14, sCD163, sCD206 and Osteopontin (OPN). AUROC and P values are given. Best discriminative cut-off levels were defined as values of the markers where the sum of sensitivity and specificity reached its maximum while still provided converging curves for regression models.(B) Kaplan-Meier survival plots of 790-days mortality using cut-off values of markers obtained with ROC analyses. Cumulative probability of death is higher in patients with high marker levels.(C) ROC analyses of infection development in the first 890-day of follow up to test prognostic efficiency of sCD163, sCD206, osteopontin (OPN) and Lipopolysaccharide Binding Protein (LBP) to define cut-off levels. AUROC and p values are given. Best discriminative cut-off levels were defined as values of the markers where the sum of sensitivity and specificity reached its maximum while still provided converging curves for regression models.Aalen-Johansen estimators plotted to asses cumulative incidence factor of infection (D) and organ failure development (E) taking mortality under account as a competing risk using cut-off values of markers obtained with ROC analyses. Patients with high marker levels were more likely to develop infections and organ failures than the ones with low levels.

References

    1. Rehm J, Samokhvalov AV, Shield KD. Global burden of alcoholic liver diseases. J Hepatol 2013;59:160–168. - PubMed
    1. EASL Clinical Practice Guidelines: Management of alcohol-related liver disease. J Hepatol 2018;69:154–181. - PubMed
    1. Lucey MR, Mathurin P, Morgan TR. Alcoholic hepatitis. N Engl J Med 2009;360:2758–2769. - PubMed
    1. Szabo G, Petrasek J. Gut-liver axis and sterile signals in the development of alcoholic liver disease. Alcohol Alcohol 2017;52:414–424. - PMC - PubMed
    1. Enomoto N, Ikejima K, Bradford BU, Rivera CA, Kono H, Goto M, Yamashina S, et al. Role of Kupffer cells and gut-derived endotoxins in alcoholic liver injury. J Gastroenterol Hepatol 2000;15 Suppl:D20–25. - PubMed

Publication types

MeSH terms

LinkOut - more resources