. 2019 Jul;40(10):2995-3009.
doi: 10.1002/hbm.24574. Epub 2019 Mar 19.

Proprioception and motor performance after stroke: An examination of diffusion properties in sensory and motor pathways

Affiliations

Proprioception and motor performance after stroke: An examination of diffusion properties in sensory and motor pathways

Sonja E Findlater et al. Hum Brain Mapp. 2019 Jul.

Abstract

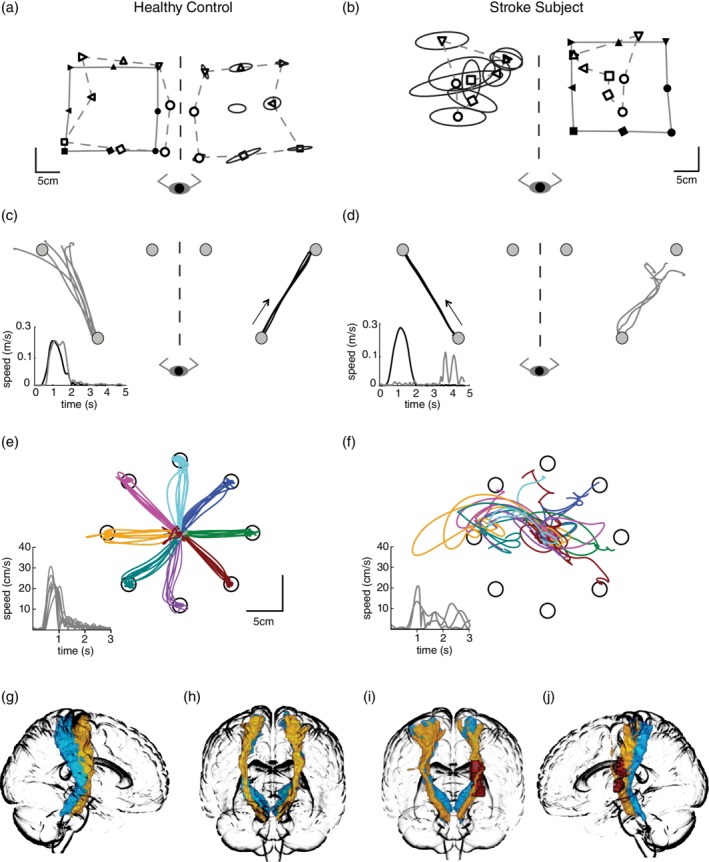
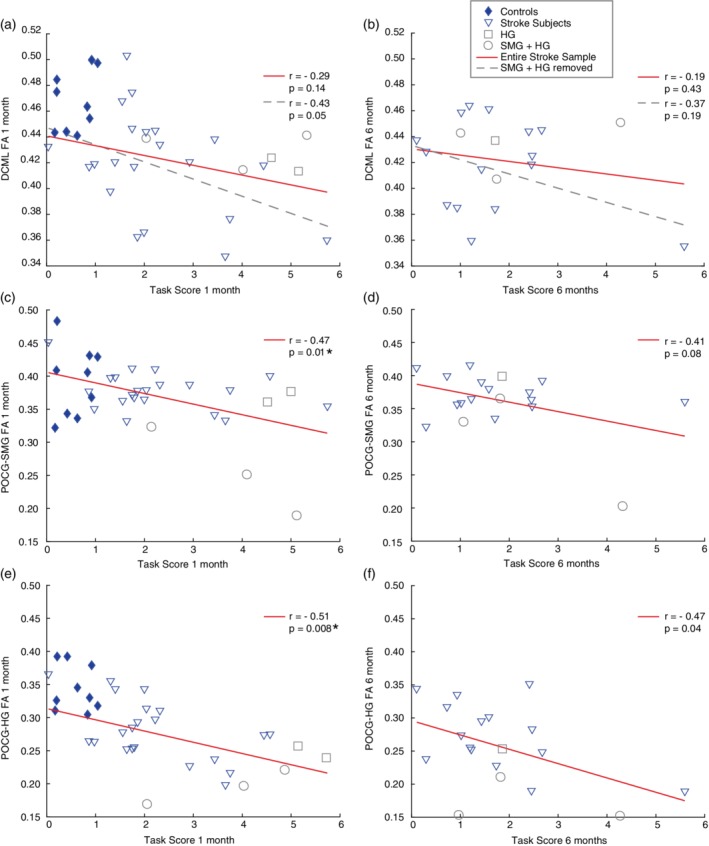
Proprioceptive and motor impairments commonly occur after stroke. Relationships between corticospinal tract (CST) fractional anisotropy (FA) and motor recovery have been identified. However, the relationship between sensory tract microstructure and proprioceptive recovery remains unexplored. Using probabilistic tractography, we examined the relationship between diffusion metrics in three tracts known to contain proprioceptive information (a) dorsal-column medial-lemniscal (DCML), (b) postcentral gyrus to supramarginal gyrus (POCG-SMG), (c) postcentral gyrus to Heschl's gyrus (POCG-HG) and proprioception at 1 (n = 26) and 6 months (n = 19) poststroke. Proprioception was assessed using two robotic tasks. Motor performance was also assessed robotically and compared to CST diffusion metrics. At 1-month poststroke, a nonsignificant relationship (r = -0.43, p = 0.05) was observed between DCML-FA and proprioceptive impairment. A moderate relationship was identified between POCG-SMG FA and POCG-HG FA and proprioceptive impairment (r = -0.47, p = 0.001 and r = -0.51, p = 0.008, respectively). No relationships were significant at 6 months poststroke. Similar to previous studies, lower CST-FA correlated with motor impairment at 1 month poststroke (r = -0.58, p = 0.002). While CST-FA is considered a predictor of motor impairment, our findings suggest that the relationship between FA and tracts containing proprioceptive information is not as straightforward and highlights the importance of sensory association areas in proprioception.

Keywords: diffusion tractography; motor skills; proprioception; recovery; stroke.


Figures

Figure 1
Figure 1
Exemplars—Robotic task performance and probabilistic DCML and CST. For the proprioceptive tasks, the robot moved the respective participant's right (the stroke participant's affected) arm. Subjects matched with the opposite arm. For the position matching task (a and b), a solid line joins the spatial locations that the robot moved the passive arm to (filled symbols). A dashed line connects the workspace locations where the participant actively matched (unfilled symbols). The data from the matching arm have been mirror transformed onto the passive movement to visualize discrepancies between arms. Trial to trial variability is symbolized by ellipses around each location—each ellipse represents 1 SD. For the kinesthetic matching task (c and d), black lines represent the path of the passively moved arm, the gray lines represent the active mirror‐matched movements by the participant. The arrow indicates the direction that the passive arm was moved. Temporal data is also provided. Only one of the six movement directions are presented in this figure. For the visually guided reaching task (e and f), data for the left arm of the control participant and the right arm of the participant with stroke are shown. Temporal data is also provided. Of note, in comparison to the healthy control, the stroke subject demonstrated high variability (denoted by ellipses size at spatial locations) and a contracted workspace on the position matching task (b), poor spatial accuracy, and slow response latency on the kinesthetic matching task (d), and poor spatial accuracy with several missed targets and slow reaction time on the visually guided reaching task (f). The DCML (blue) and CST (yellow) are displayed in the sagittal view (g and j) and coronal view (h and i) for the exemplar control and stroke subjects. Red represents the lesion location for the stroke subject in i and j
Figure 2
Figure 2
FA, MD, RD, and AD for the DCML, POCG‐SMG, POCG‐HG. The DCML is presented in the top row, the POCG‐SMG in the middle row, and the POCG‐HG in the bottom row. For each tract, the FA, MD, RD, and AD are presented for the left hemisphere of controls (CL), the right hemisphere of controls (CR), the ipsilesional (Ips), and contralesional (Con) hemisphere of participants with stroke at 1 (1 mo) and 6 (6 mo) months poststroke. Asterisks indicate whether paired (**) or unpaired (*) testing was conducted. Only significant relationships that survived the Benjamini–Hochberg correction for multiple comparisons are noted, p values are provided. Boxplots provide the 25th and 75th percentiles and median. Outliers are indicated by + [Color figure can be viewed at http://wileyonlinelibrary.com]
Figure 3
Figure 3
FA, MD, RD, and AD for the CST. The FA, MD, RD, and AD for the left hemisphere of controls (CL), the right hemisphere of controls (CR), the ipsilesional (Ips), and contralesional (Con) hemisphere of participants with stroke at 1 (1 mo) and 6 (6 mo) months poststroke is presented. Asterisks indicate whether paired (**) or unpaired (*) testing was conducted. Only significant relationships that survived the Benjamini–Hochberg correction for multiple comparisons are noted, p values are provided. Boxplots provide the 25th and 75th percentiles and median. Outliers are indicated by + [Color figure can be viewed at http://wileyonlinelibrary.com]
Figure 4
Figure 4
Relationship between FA and position matching performance. Scatterplots and Pearson's correlation results for FA of each tract and position matching task scores at both timepoints are presented (DCML is presented in the top row, POCG‐SMG in the middle row, and POCG‐HG in the bottom row). Control subjects are represented by filled diamond symbols, and stroke subjects are represented by open symbols. Open square symbols represent subjects with stroke lesions overlapping Heschl's gyrus. Open circle symbols represent subjects with stroke lesions overlapping the supramarginal gyrus and Heschl's gyrus. For the DCML, two correlations were conducted—first with the entire stroke sample (n = 26 at 1 month, n = 19 at 6 months poststroke) and secondly without the stroke subjects whose lesion overlapped SMG and/or HG (n = 5 at 1 month poststroke, n = 4 at 6 months poststroke). The solid line corresponds with the correlation that included the entire stroke sample while the dashed line corresponds to the stroke sample without individuals who had lesions overlapping SMG and/or HG. Asterisks indicate significant results that survived the Benjamini–Hochberg correction for multiple comparisons [Color figure can be viewed at http://wileyonlinelibrary.com]
Figure 5
Figure 5
Relationship between FA and motor performance. Scatterplots and Pearson's correlation results for CST‐FA and scores on the visually guided reaching task at 1 month poststroke (a) and 6 months poststroke (b). Control subjects are represented by filled diamond symbols, and stroke subjects are represented by open symbols. Open square symbols represent subjects with stroke lesions overlapping Heschl's gyrus. Open circle symbols represent subjects with stroke lesions overlapping the supramarginal gyrus and Heschl's gyrus. At each timepoint, two correlations were conducted—first with the entire stroke sample (n = 26 at 1 month, n = 19 at 6 months poststroke) and secondly without the subjects whose lesion overlapped SMG and/or HG (n = 5 at 1 month poststroke, n = 4 at 6 months poststroke). The solid line corresponds with the correlation that included the entire stroke sample while the dashed line corresponds to the stroke sample without individuals who had lesions overlapping SMG and/or HG. Asterisks indicate significant results that survived the Benjamini–Hochberg correction for multiple comparisons [Color figure can be viewed at http://wileyonlinelibrary.com]
Figure 6
Figure 6
Overlap maps, SMG, and HG regions. (a) The overlap of the lesions for all 26 participants with stroke. The highest region of overlap was in the internal capsule and thalamus of the right hemisphere (n = 9). (b) The lesion overlap map of the five subjects who had damage to HG (region traced in yellow) and/or SMG (region traced in magenta). The DCML (of a representative control subject) is traced in orange. (c) A render image presenting SMG and HG regions

Similar articles

Cited by

References

    1. Altmann, C. F. , Bledowski, C. , Wibral, M. , & Kaiser, J. (2007). Processing of location and pattern changes of natural sounds in the human auditory cortex. NeuroImage, 35(3), 1192–1200. 10.1016/j.neuroimage.2007.01.007 - DOI - PubMed
    1. Andersson, J. L. R. , Skare, S. , & Ashburner, J. (2003). How to correct susceptibility distortions in spin‐echo echo‐planar images: Application to diffusion tensor imaging. NeuroImage, 20(2), 870–888. 10.1016/s1053-8119(03)00336-7 - DOI - PubMed
    1. Baird, A. E. , Benfield, A. , Schlaug, G. , Siewert, B. , Lovblad, K. O. , Edelman, R. R. , & Warach, S. (1997). Enlargement of human cerebral ischemic lesion volumes measured by diffusion‐weighted magnetic resonance imaging. Annals of Neurology, 41(5), 581–589. 10.1002/ana.410410506 - DOI - PubMed
    1. Bajada, C. J. , Haroon, H. A. , Azadbakht, H. , Parker, G. J. M. , Lambon Ralph, M. A. , & Cloutman, L. L. (2017). The tract terminations in the temporal lobe: Their location and associated functions. Cortex, 97, 277–290. 10.1016/j.cortex.2016.03.013 - DOI - PMC - PubMed
    1. Baumgart, F. , Gaschler‐Markefski, B. , Woldorff, M. G. , Heinze, H. J. , & Scheich, H. (1999). A movement‐sensitive area in auditory cortex. Nature, 400(6746), 724–726. 10.1038/23385 - DOI - PubMed

Publication types