Comparative Study
. 2019 Mar;7(6):e14023.
doi: 10.14814/phy2.14023.

The role of the nAChR subunits α5, β2, and β4 on synaptic transmission in the mouse superior cervical ganglion

Affiliations
Comparative Study

The role of the nAChR subunits α5, β2, and β4 on synaptic transmission in the mouse superior cervical ganglion

Xenia Simeone et al. Physiol Rep. 2019 Mar.

Abstract

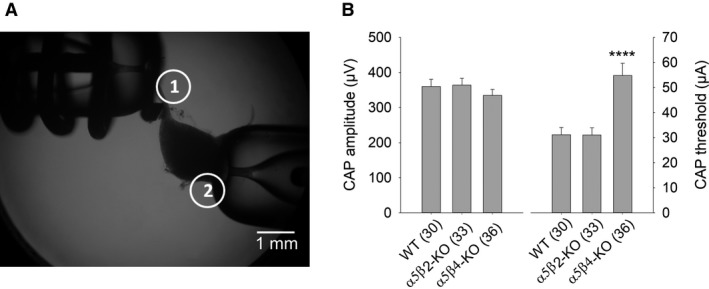
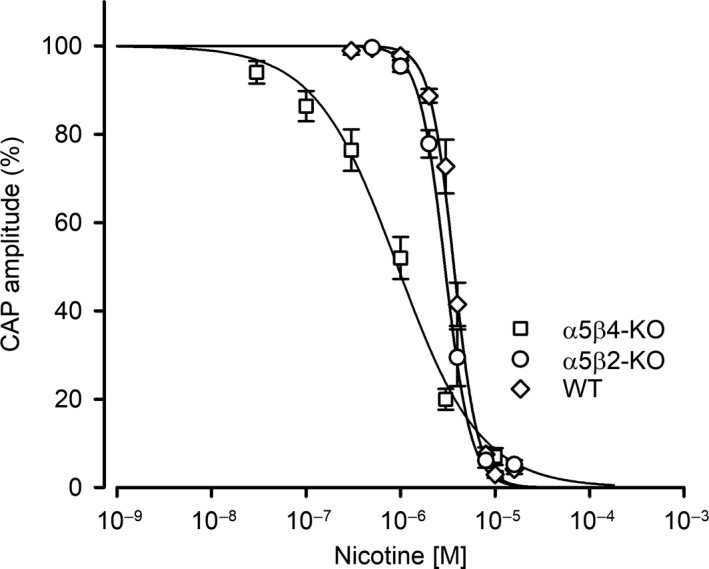
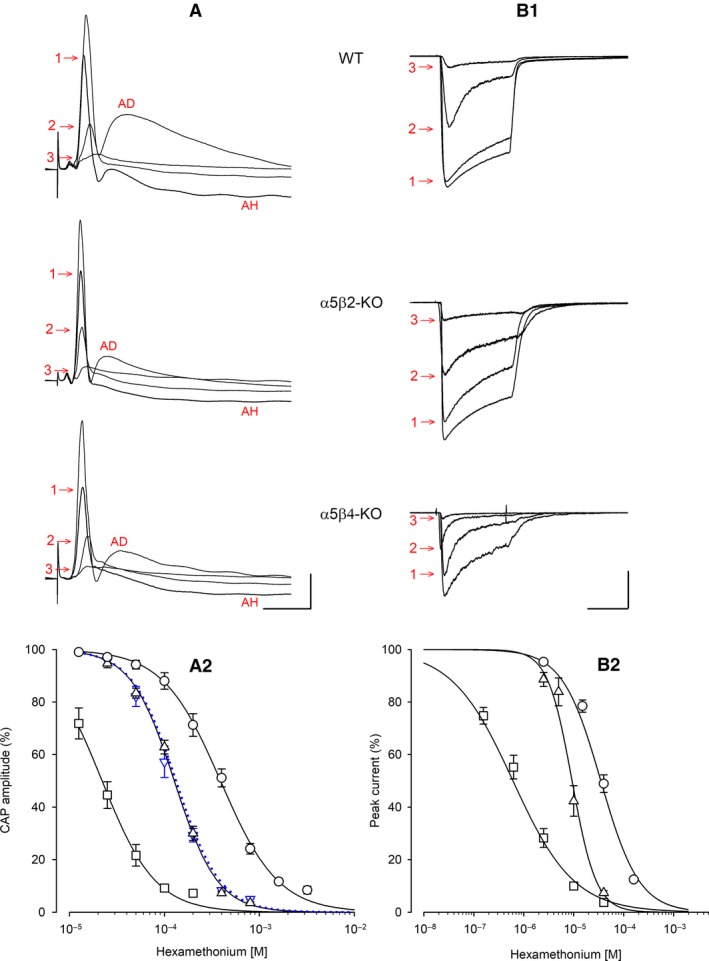
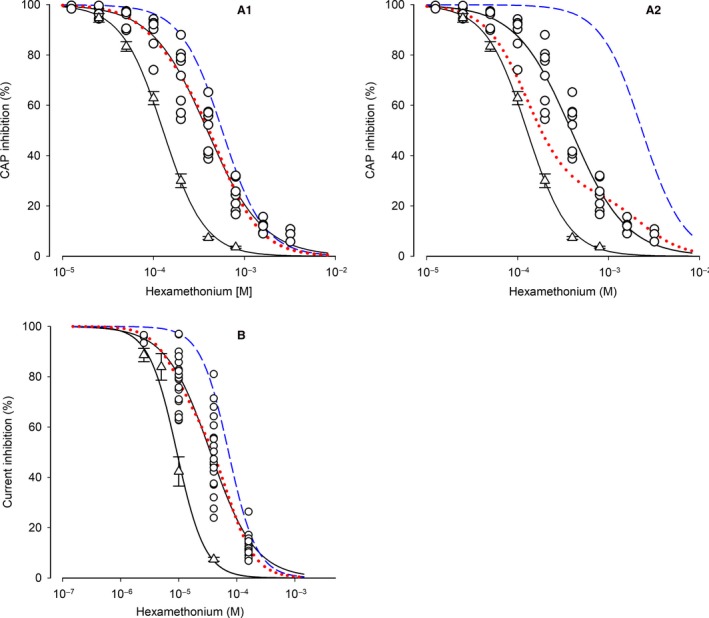
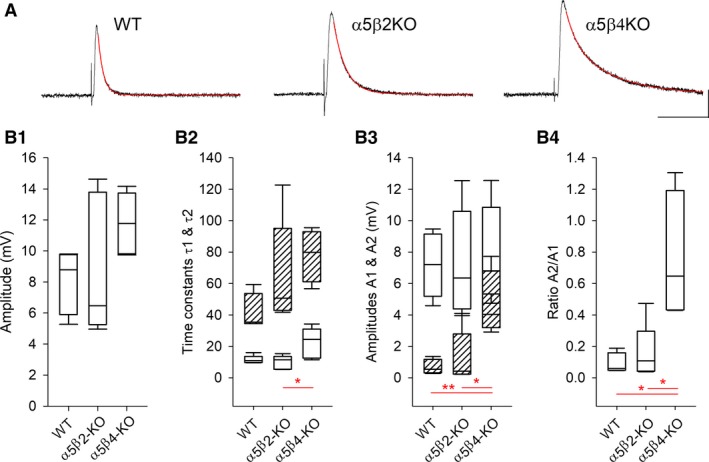
Our previous immunoprecipitation analysis of nicotinic acetylcholine receptors (nAChRs) in the mouse superior cervical ganglion (SCG) revealed that approximately 55%, 24%, and 21% of receptors are comprised of α3β4, α3β4α5, and α3β4β2 subunits, respectively. Moreover, mice lacking β4 subunits do not express α5-containing receptors but still express a small number of α3β2 receptors. Here, we investigated how synaptic transmission is affected in the SCG of α5β4-KO and α5β2-KO mice. Using an ex vivo SCG preparation, we stimulated the preganglionic cervical sympathetic trunk and measured compound action potentials (CAPs) in the postganglionic internal carotid nerve. We found that CAP amplitude was unaffected in α5β4-KO and α5β2-KO ganglia, whereas the stimulation threshold for eliciting CAPs was significantly higher in α5β4-KO ganglia. Moreover, intracellular recordings in SCG neurons revealed no difference in EPSP amplitude. We also found that the ganglionic blocking agent hexamethonium was the most potent in α5β4-KO ganglia (IC50 : 22.1 μmol/L), followed by α5β2-KO (IC50 : 126.7 μmol/L) and WT ganglia (IC50 : 389.2 μmol/L). Based on these data, we estimated an IC50 of 568.6 μmol/L for a receptor population consisting solely of α3β4α5 receptors; and we estimated that α3β4α5 receptors comprise 72% of nAChRs expressed in the mouse SCG. Similarly, by measuring the effects of hexamethonium on ACh-induced currents in cultured SCG neurons, we found that α3β4α5 receptors comprise 63% of nAChRs. Thus, in contrast to our results obtained using immunoprecipitation, these data indicate that the majority of receptors at the cell surface of SCG neurons consist of α3β4α5.

Keywords: EPSP; Compound action potential; Hexamethonium; knockout mice; nicotinic ACh receptor; superior cervical ganglion; synaptic transmission.


Conflict of interest statement

None declared.

Figures

Figure 1
Figure 1
CAP amplitudes do not differ between WT, α5β2‐KO, and α5β4‐KO SCG ganglia. (A) Image showing the experimental setup for recording CAPs in the isolated mouse SCG. The suction electrode for stimulating the preganglionic sympathetic nerve is indicated as electrode 1, and the suction electrode for recording the postganglionic internal carotid nerve is indicated as electrode 2. (B) Summary of CAP amplitude (left) and the stimulus threshold for inducing a CAP (right) on WT, α5β2‐KO, and α5β4‐KO ganglia. CAP amplitude induced by supramaximal stimulation at 0.033 Hz was similar between genotypes (one‐way ANOVA, F 2,96 = 0.75; = 0.48). In contrast, the stimulus threshold for eliciting a discernible CAP with an amplitude of 15–20 μV was significantly higher in α5β4‐KO compared to both WT and α5β2‐KO mice (one‐way ANOVA, followed by Bonferroni's post hoc test, < 0.0001). In this and subsequent figures, summary data are presented as the mean ± SEM. See Figure 4 for example CAP recordings.
Figure 2
Figure 2
Synaptic transmission is more susceptible to increasing stimulation frequency in α5β2‐KO and α5β4‐KO ganglia than in WT ganglia. CAP amplitude was measured in WT (A), α5β2‐KO (B), and α5β4‐KO (C) ganglia in response to a train of 30 supramaximal pulses delivered at increasing frequency and normalized to the amplitude of the first CAP (n = 7 ganglia per genotype). For clarity, only the first, second, third, 10th, and 30th pulses are shown. Two‐way repeated ANOVA using the frequency as the group factor and the pulse numbers as repeated factor showed highly significant pulse effects for (A) WT ganglia (F 4, 144 = 60.76; < 0.0001), (B) α5β2‐KO ganglia (F 4, 144 = 163.6; < 0.0001), and (C) α5β4‐KO ganglia (F 4, 144 = 204.1; < 0.0001). Significant differences to the first pulse were calculated by Bonferroni's post hoc test.
Figure 3
Figure 3
The potency of nicotine at inhibiting CAP amplitude differs between α5β4‐KO, α5β2‐KO, and WT ganglia. Nicotine is more potent at inhibiting CAP amplitude in α5β4‐KO ganglia (squares) compared to both WT (circles) and α5β2‐KO (up‐triangles) ganglia. Nicotine concentration‐response curves show that CAPs following supramaximal stimulation at 0.033 Hz were most potently reduced in α5β4‐KO (IC 50 = 0.93 μmol/L, confidence interval: 0.78–1.11 μmol/L, n = 15), followed by α5β2‐KO (3.01 μmol/L, confidence interval: 2.80–3.23 μmol/L, n = 14) and WT ganglia (3.67 μmol/L, confidence interval: 3.50–3.85 μmol/L, n = 13). The IC 50 values for α5β4‐KO and α5β2‐KO (F 1,145 = 69.1, < 0.0001, F‐test), and for α5β2‐KO and WT differ significantly (F 1,139 = 21.0, P = <0.0001, F‐test).
Figure 4
Figure 4
Hexamethonium (HM) inhibits CAP amplitude (in SCG ganglia) and ACh‐induced current (in cultured neurons) differently between WT, α5β2‐KO, and α5β4‐KO. Example traces and HM concentration‐response curves measured in WT (circles), α5β2‐KO (up‐triangles), and α5β4‐KO (squares) ganglia/neurons. (A1) Example traces of CAPs recorded in the absence or presence of HM. HM concentrations were 200 μmol/L (1), 800 μmol/L (2), and 1600 μmol/L (3) in WT ganglia; 100 μmol/L (1), 200 μmol/L (2), and 400 μmol/L (3) in α5β2‐KO ganglia; and 25 μmol/L (1), 50 μmol/L (2), and 100 μmol/L (3) in α5β4‐KO ganglia. Afterdepolarization (AD, prominent in the absence of HM) and afterhyperpolarization (AH, prominent in the presence of low HM concentrations) are likely due to Ca2+‐dependent activation of Cl and K+ channels, respectively (Martinez‐Pinna et al. 2000). The horizontal and vertical scale bars represent 20 msec and 100 μV, respectively. (A2) HM concentration‐response curves of CAP inhibition. CAPs as shown in panel A1 were most potently inhibited in α5β4‐KO ganglia (IC 50 = 22.1 μmol/L, confidence interval: 18.7–25.3 μmol/L; Hill coefficient: −1.54; n = 10), followed by α5β2‐KO ganglia (126.7 μmol/L, confidence interval: 120.2–133.5 μmol/L; Hill coefficient: −1.9; n = 11) and WT ganglia (389.2 μmol/L, confidence interval: 356.0–425.5 μmol/L; Hill coefficient: −1.43; n = 10). The IC 50 values for WT and α5β2‐KO ganglia differed significantly (F 1,111 = 424.5, < 0.0001, F‐test). The IC 50 of α5 single KO ganglia (119.0 μmol/L, confidence interval: 109.3–129.6 μmol/L, n = 6; down‐triangles, blue dotted line) did not differ from the IC 50 of α5β2‐KO ganglia (F 1,113 = 1.716, = 0.193, F‐test). (B1) Example traces of currents induced by 2 sec pulses of 300 μmol/L ACh in the absence or presence of HM. HM concentrations were 10 μmol/L (1), 40 μmol/L (2), and 160 μmol/L (3) in WT neurons; 2.5 μmol/L (1), 10 μmol/L (2), and 40 μmol/L (3) in α5β2‐KO neurons; and 0.625 μmol/L (1), 2.5 μmol/L (2), and 10 μmol/L (3) in α5β4‐KO neurons. The horizontal scale bar represents 1 s. The vertical scale bar represents 2 nA and 1 nA for α5β2‐KO and α5β4‐KO neurons, respectively. (B2) HM concentration‐response curves of peak current inhibition. Currents as shown in panel B1 were most potently inhibited in α5β4‐KO neurons (IC 50 = 0.73 μmol/L, confidence interval: 0.59–0.89 μmol/L, Hill coefficient: −0.77; n = 17 neurons), followed by α5β2‐KO (9.28 μmol/L, confidence interval: 8.07–10.79 μmol/L: Hill coefficient: −1.8; n = 8) and WT (35.08 μmol/L, confidence interval: 30.61–40.15 μmol/L; Hill coefficient: −1.13; n = 20). The IC 50 values in α5β2‐KO and WT differ significantly (F 1,86 = 146, < 0.0001, F‐test).
Figure 5
Figure 5
Modeling of the contribution of α5‐containing receptors in synaptic transmission and ACh‐induced currents in WT SCG. (A1) HM concentration‐response curves of CAP inhibition for α5β2‐KO and WT ganglia are taken from Fig. 4A2. Circles are the individual data points observed in WT ganglia. The blue dashed curve was generated for the HM inhibition of α3β4α5 receptors by applying a Hill coefficient −1.9 and the fit parameter IC 50b = 568.6 μmol/L derived from Function (2) to the Hill function. The red dotted curve was generated by applying the following values to Function (2): f1 = 0.28 (the contribution of receptors lacking α5, derived from the fitting routine), (1‐f1) = 0.72 (the complementary contribution of α3β4α5 receptors), IC 50a = 126.7 μmol/L (IC 50 for α3β4 receptors), IC 50b = 568.6 μmol/L (IC 50 for α3β4α5 receptors, derived from the fitting routine), and the Hill coefficient −1.9. Please note the almost perfect overlay of the red dotted curve and the HM concentration‐response curve in WT ganglia. Based on this modeling approach, α3β4α5 receptors contribute 72% to overall nAChRs that mediate synaptic transmission in the mouse SCG. Details of the fitting routine: IC 50b = 568.6 μmol/L ± 58.24 μmol/L (10.2%); f 1 = 0.28 ± 0.05 (19%); final sum of squares of residuals: 2498.46; degrees of freedom: 48; rms of residuals: 7.21466; variance of residuals: 52.0514. (A2) The plot differs from the plot shown in A1 by the blue dashed and the red dotted curves. Here, the fitting routine was constrained by inserting a fixed f1 of 0.75 into Function (2), which reflects the proportion of receptors lacking the α5 subunit (as determined by previous IP experiments, David et al. 2010). Even with this constraint, the fit converged by calculating a HM IC 50b of 2.35 mM (for α3β4α5 receptors, blue dashed curve). The red dotted curve was thereafter generated by applying the following values to Function (2): f1 = 0.75, (1‐f1) = 0.25, IC 50a = 126.7 μmol/L, IC 50b = 2.35 mM, and the Hill coefficient −1.9. Please note that the red dotted curve clearly deviates from the data observed in WT ganglia. Details of the fitting routine: IC 50b = 2.35 mM ± 1.11 μmol/L (47.3%); f1 = fixed (0.75); final sum of squares of residuals: 12082; degrees of freedom: 49; rms of residuals: 15.70; variance of residuals: 246.57. Besides the (calculated) high IC 50b for HM, please also note its high variability. (B) HM concentration‐response curves of peak current inhibition in α5β2‐KO and WT neurons are taken from Fig. 4B2. Circles are the individual data points observed in WT SCG neurons. The blue dashed curve was generated for the HM inhibition of α3β4α5 receptors by applying a Hill coefficient ‐1.8 and the fit parameter IC 50b = 72.02 μmol/L derived from Function (2). The red dotted curve was generated by applying the following values to Function (2): f1 = 0.37 (the contribution of receptors lacking α5, derived from the fitting routine), (1‐f1) = 0.63 (the complementary contribution of α3β4α5 receptors), IC 50a = 9.28 μmol/L (IC 50 for α3β4 receptors), IC 50b = 72.02 μmol/L (IC 50 for α3β4α5 receptors, derived from the fitting routine), and the Hill coefficient −1.8. Please note the almost perfect overlay of the red dotted curve and the HM concentration‐response curve in WT ganglia. Based on this modeling approach, α3β4α5 receptors contribute 63% to overall nAChRs that mediate synaptic transmission in the mouse SCG. Details of the fitting routine: IC 50b = 72.02 μmol/L ± 10.57 μmol/L (14.7%); f1 = 0.37 ± 0.04 (12.5%); final sum of squares of residuals: 6641; degrees of freedom: 59; rms of residuals: 10.61; variance of residuals: 112.0.
Figure 6
Figure 6
EPSP amplitudes do not differ between WT, α5β2‐KO, and α5β4‐KO SCG neurons. (A) Example EPSPs recorded in WT, α5β2‐KO, and α5β4‐KO ganglia; the decay phase was fit to a double‐exponential function (red lines). The cells were hyperpolarized to −100 mV with current injection, and EPSPs were induced by stimulating the preganglionic nerve. The horizontal and vertical scale bars represent 100 msec and 4 mV, respectively. (B) Box plots summarizing amplitudes (B1) and the fitting parameters for the decay phase of the EPSPs recorded in WT, α5β2‐KO, and α5β4‐KO neurons (n = 5 per genotype). In panel B2, the open and hatched boxes represent the fast and slow time constants, respectively; in panel B3, the open and hatched boxes represent the amplitudes corresponding to the fast and slow time constants, respectively.

Similar articles

Cited by

References

    1. Bennett, M. R. , and McLachlan E. M.. 1972a. An electrophysiological analysis of the storage of acetylcholine in preganglionic nerve terminals. J. Physiol. 221:657–668. - PMC - PubMed
    1. Bennett, M. R. , and McLachlan E. M.. 1972b. An electrophysiological analysis of the synthesis of acetylcholine in preganglionic nerve terminals. J. Physiol. 221:669–682. - PMC - PubMed
    1. Bierut, L. J. , Stitzel J. A., Wang J. C., Hinrichs A. L., Grucza R. A., Xuei X., et al. 2008. Variants in nicotinic receptors and risk for nicotine dependence. Am. J. Psychiatry 165:1163–1171. - PMC - PubMed
    1. Birks, R. I. , and Isacoff E. Y.. 1988. Burst‐patterned stimulation promotes nicotinic transmission in isolated perfused rat sympathetic ganglia. J. Physiol. 402:515–532. - PMC - PubMed
    1. Bowers, C. W. , and Zigmond R. E.. 1979. Localization of neurons in the rat superior cervical ganglion that project into different postganglionic trunks. J. Comp. Neurol. 185:381–391. - PubMed

Publication types

MeSH terms

LinkOut - more resources