. 2019 Jun 1;316(6):L1094-L1106.
doi: 10.1152/ajplung.00173.2018. Epub 2019 Mar 20.

Cardiac glycosides decrease influenza virus replication by inhibiting cell protein translational machinery

Affiliations

Cardiac glycosides decrease influenza virus replication by inhibiting cell protein translational machinery

Luciano Amarelle et al. Am J Physiol Lung Cell Mol Physiol. .

Abstract

Cardiac glycosides (CGs) are used primarily for cardiac failure and have been reported to have other effects, including inhibition of viral replication. Here we set out to study mechanisms by which CGs as inhibitors of the Na-K-ATPase decrease influenza A virus (IAV) replication in the lungs. We found that CGs inhibit influenza virus replication in alveolar epithelial cells by decreasing intracellular potassium, which in turn inhibits protein translation, independently of viral entry, mRNA transcription, and protein degradation. These effects were independent of the Src signaling pathway and intracellular calcium concentration changes. We found that short-term treatment with ouabain prevented IAV replication without cytotoxicity. Rodents express a Na-K-ATPase-α1 resistant to CGs. Thus we utilized Na-K-ATPase-α1-sensitive mice, infected them with high doses of influenza virus, and observed a modest survival benefit when treated with ouabain. In summary, we provide evidence that the inhibition of the Na-K-ATPase by CGs decreases influenza A viral replication by modulating the cell protein translational machinery and results in a modest survival benefit in mice.

Keywords: Na-K-ATPase; antiviral treatment; intracellular potassium.


Conflict of interest statement

No conflicts of interest, financial or otherwise, are declared by the authors.

Figures

Fig. 1.
Fig. 1.
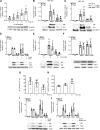
Cardiac glycosides inhibit influenza A virus replication between 4 and 6 h postinfection. AC: A549 cells were infected for 1 h with 1 multiplicity of infection WSN virus, washed, and treated at 0 h postinfection (hpi) with increasing concentrations of ouabain (n = 4; A), digoxin (n = 4–5; B), or cinobufagin (n = 4; C). Twenty-four hpi virus titer was determined by plaque assay of the supernatant. D: A549 cells were treated for 24 h with PBS (CT; n = 9), 20 nM ouabain (Ouab; n = 5), 50 nM digoxin (Dig; n = 4), or 100 nM cinobufagin (Cino; n = 4), and cell death was measured using LDH assay. E: human primary human alveolar type II (ATII) cells were infected as in A; treated at 0 hpi with 20 nM ouabain, 50 nM digoxin, or 100 nM cinobufagin; and 24 hpi virus titer was measured via plaque assay (n = 5). F: human BEAS-2B cells were infected as in A; treated at 0 hpi with 20 nM ouabain, 50 nM digoxin, or 100 nM cinobufagin; and 24 hpi virus titer was measured via plaque assay (n = 4–5). G: time of removal of A549 cells infected as in A and treated 0 hpi with 20 nM ouabain. Ouabain was removed from the media at 2-h intervals, from 0 to 24 hpi. Twenty-four hpi virus titer was measured via plaque assay (n = 4–6). H: time of addition of A549 cells infected as in A and treated with 20 nM ouabain at 2-h intervals [from 0 to 8 hpi]. Twenty-four hpi, virus titer was measured via plaque assay (n = 4–6). I: viral titers were plotted as a function of time-of-addition and time-of-removal. All graphs show means ± SD. Graphs were analyzed by one-way ANOVA with Dunnett's post hoc test. *P < 0.05, **P < 0.01, ***P < 0.001, ****P < 0.0001.
Fig. 2.
Fig. 2.
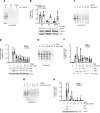
Cardiac glycosides inhibit influenza A virus replication by impairing protein translation. A: A549 cells were infected for 1 h with 1 multiplicity of infection WSN and lysed at 2, 4, 6, 8, and 24 h postinfection (hpi), and protein expression was analyzed by Western blotting. Viral proteins nucleoprotein (NP) and matrix 1 (M1) were detected using specific antibodies. Graph represents viral protein abundance relative to the internal control (β-tubulin) (n = 6). B: representative image of a viral plaque assay from supernatant collected from A549 cells infected as in A and collected 0, 2, 4, 6, 8, and 24 hpi (n = 4). C: A549 cells were preincubated for 2 h with 20 nM ouabain (Ouab), washed, infected as in A, and lysed at 24 hpi for Western blot analysis of viral proteins NP and M1. Graph represents viral protein abundance relative to the internal control (CT; GAPDH) (n = 4). D: A549 cells were infected as in A, PBS or 20 nM ouabain was added at 0 hpi, and NP and M1 mRNA abundance was quantified by quantitative PCR at 24 hpi. Graph represents fold change of viral mRNA of infected cells vs. infected cells treated with ouabain (n = 4). E: A549 cells were infected as in A, and 20 nM ouabain was added at 0 hpi. Cells were lysed at 0, 6, 8, and 24 hpi, and viral proteins NP and M1 were detected by Western blotting using specific antibodies. Graph represents viral protein abundance relative to the internal control (β-tubulin) (n = 4–6). F: A549 cells were infected as in A, 20 nM ouabain was added at 0 hpi, and 24 hpi cells were fixed and NP (red) and nuclei (blue) were analyzed by immunofluorescence microscopy. Graph represents quantification of infected cells analyzed by unpaired t-test (n = 3). G–I: A549 cells were infected as in A and then treated at 0 hpi with 20 nM ouabain in the presence or absence of 1 µM MG-132 (G), 1 µM lactacystin (Lact; H), and 10 µM chloroquine (Chlo; I). At 8 hpi, cells were lysed and proteins were detected by Western blotting using specific antibodies. Graphs represent viral protein abundance relative to the internal control (β-tubulin or actin) (n = 4–5). All graphs show means ± SD. Except for F, graphs were analyzed by one-way ANOVA with Dunnett's post hoc test. *P < 0.05, **P < 0.01, ***P < 0.001, ****P < 0.0001.
Fig. 3.
Fig. 3.
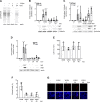
Na-K-ATPase inhibition shuts off the translational machinery via intracellular ionic changes and independently of eukaryotic initiation factor 2α (eIF2α) phosphorylation. A: A549 cells were treated with 20 nM ouabain for 0, 2, 4, 6, and 8 h. Cells were lysed at those time points, and phospho-eIF2α and total-eIF2α were detected by Western blotting using specific antibodies. Graph represents phospho- vs. total-eIF2α (n = 4–6). B: mouse embryonic fibroblast (MEF) cells expressing wild-type (WT) eIF2α (clone S/S) were infected as in A and treated at 0 h postinfection (hpi) with 100 µM ouabain (Ouab). At 24 hpi, proteins were lysed and viral nucleoprotein (NP) and matrix 1 (M1) proteins were detected by Western blotting using specific antibodies. Graph represents viral protein abundance relative to the internal control (CT; actin) (n = 4). C: mouse embryonic fibroblasts cells expressing S51A eIF2α (clone A/A) were infected as in A and treated at 0 hpi with 100 µM ouabain. At 24 hpi, proteins were lysed and viral NP and M1 proteins were detected by Western blotting using specific antibodies. Graph represents viral protein abundance relative to the internal control (β-tubulin) (n = 4). D: A549 cells were infected as in A, and at 0 hpi 20 nM ouabain was added in the presence or absence of 10 µM of the Src inhibitor PP2. At 8 hpi, proteins were lysed and viral proteins M1 and NS1 were detected by Western blotting using specific antibodies. Graph represents viral protein abundance relative to the internal control (actin) (n = 3). E: A549 cells were infected as in A and 0 hpi media were replaced with 5 mM KCl or 0 mM KCl media. At 24, hpi cells were lysed and viral proteins NP and M1 were detected by Western blotting using specific antibodies. Graph represents viral protein abundance relative to the internal control (actin) (n = 4–5). F: A549 cells expressing the Na-K-ATPase rat α1-subunit were infected as in A, and 20 nM ouabain was added at 0 hpi. At 8 hpi, cells were lysed and viral proteins NP and NS1 detected by Western blotting using specific antibodies. Graph represents viral protein abundance relative to the internal control (actin) (n = 5). G and H: A549 cells were treated with 20 nM ouabain for 2, 4, or 6 h, and intracellular potassium concentration was measured by inductively coupled plasma/mass spectrometry (n = 6–7; G) and intracellular sodium concentration by fluorescence assay (n = 5; H). I and J: A549 cells were infected as in A, and at 0 hpi 20 nM ouabain was added in the presence or absence of 10 µM of Na+/Ca2+ exchanger SN-6 (I) or 25 µM of calcium chelator BAPTA-AM (J). Viral proteins NP and NS1 were detected by Western blotting using specific antibodies. Graphs represent viral protein abundance relative to the internal control (actin) (n = 3–5). All graphs show means ± SD. Graphs were analyzed by one-way ANOVA with Dunnett's post hoc test. *P < 0.05, **P < 0.01, ***P < 0.001, ****P < 0.0001.
Fig. 4.
Fig. 4.
Na-K-ATPase inhibition shuts off the protein translational machinery via decreased intracellular potassium. A and B: A549 cells were treated with 20 nM ouabain (Ouab) or media replaced with 0 mM KCl for 24 h. A and B: surface sensing of translation (SUnSET) assay was used to visualize global protein biosynthesis (A), and STAT3 and T-eukaryotic initiation factor 2α (eIF2α) were detected by Western blotting (B) using specific antibodies. Graphs represent protein abundance relative to the internal control (CT; actin) (n = 3–4). C and D: A549 cells were infected for 1 h with 1 multiplicity of infection (MOI) WSN and treated at 0 hpi with increasing concentrations of valinomycin. C and D: SUnSET assay was used to visualize global protein biosynthesis (C) and viral proteins NP and NS1 were detected by Western blotting (D) using specific antibodies. Graphs represent viral protein abundance relative to the internal control (actin) (n = 3–4). E and F: A549 cells were infected for 1 h with 1 multiplicity of infection WSN and treated at 0 hpi with increasing concentrations of L_364. E and F: SUnSET assay was used to visualize global protein biosynthesis (E) and viral proteins M1 and NS1 were detected by Western blotting (F) using specific antibodies. Graphs represent viral protein abundance relative to the internal control (actin) (n = 3–4). G and H: A549 cells were infected for 1 h with 1 MOI WSN and treated at 0 hpi with increasing concentrations of pinacidil. G and H: SUnSET assay was used to visualize global protein biosynthesis (G) and viral proteins NP and NS1 were detected by Western blotting (H) using specific antibodies. Graphs represent viral protein abundance relative to the internal control (actin) (n = 3–4). All graphs show means ± SD. Graphs were analyzed by one-way ANOVA with Dunnett's post hoc test. *P < 0.05, **P < 0.01, ***P < 0.001, ****P < 0.0001.
Fig. 5.
Fig. 5.
Short-term inhibition of protein synthesis prevents viral replication in vitro and ex vivo. A and B: A549 cells were infected for 1 h with 1 multiplicity of infection (MOI) WSN, treated with 20 nM ouabain (Ouab) for 24 h, washed, and lysed at 0 or 24 h postouabain exposure (hpo). A and B: surface sensing of translation (SUnSET) assay was used to visualize global protein biosynthesis (A), and STAT3 and viral nucleoprotein (NP) and NS1 were detected by Western blotting (B) using specific antibodies. Graph represents viral protein abundance relative to the internal control (CT; β-tubulin) (n = 5–6). C: A549 cells were infected as in A and treated with 20 nM ouabain in the presence or absence of 20 mM KCl media for 24 h. Viral proteins NP and matrix 1 (M1) were detected by Western blotting using specific antibodies. Graph represents viral protein abundance relative to the internal control (β-tubulin) (n = 4–5). D: A549 cells were infected with 1 MOI WSN in a multicycle infection and treated with 20 nM ouabain for 24 h. Twenty micromolar KCl was used to counteract the effect of ouabain. Cells were washed and lysed at 0, 24, or 48 hpo and 24 hours postinfection (hpi) for the infected control. Viral proteins were detected by Western blotting using specific antibodies. Graph represents viral protein abundance relative to the internal control (actin) (n = 3). E: LDH assay was performed for the same conditions as in D (n = 3). F and G: S/Smice lungs were cut in 100-µm slices, exposed to multicycle infection with WSN, and treated in the presence or absence of 20 nM ouabain. Incubation with 20 mM KCl was performed for 0, 24, or 48 h. Tissue was fixed and stained for immunofluorescence microscopy. F: graph represents quantification of infected cells (n = 3). G: NP viral protein (red) and nuclei (blue) were visualized. All graphs show means ± SD. Graphs were analyzed by one-way ANOVA with Dunnett's post hoc test. *P < 0.05, **P < 0.01, ***P < 0.001, ****P < 0.0001.
Fig. 6.
Fig. 6.
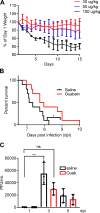
A: cardiac glycoside effects. In vivo S/Smice were treated once a day with ouabain at the indicated dose by intraperitoneal injection for 15 consecutive days. Mice were weighed and clinically evaluated daily (n = 3 mice per group). Two-way ANOVA with Sidak’s post hoc test. B: S/Smice were infected with lethal dose of WSN by intratracheal instillation and injected for 2 consecutive days with saline 0.9% NaCl solution or 50 µg/kg body wt of ouabain. Kaplan-Meier mortality curve of mice injected with ouabain is shown (n = 10 mice per group). *P < 0.05. C: graph represents viral titer [plaque-forming units (PFU)/ml] from lung homogenates harvested from S/Smice 1, 3, and 5 days postinfection and treated with saline 0.9% NaCl solution or 50 µg/kg body wt of ouabain (n = 3 mice per group). **P < 0.01 and not significant (ns) compared with 1 day postinfection (dpo) determined by one-way ANOVA with Sidak's post hoc test.

References

    1. Akimova OA, Tverskoi AM, Smolyaninova LV, Mongin AA, Lopina OD, La J, Dulin NO, Orlov SN. Critical role of the α1-Na+, K+-ATPase subunit in insensitivity of rodent cells to cytotoxic action of ouabain. Apoptosis 20: 1200–1210, 2015. doi:10.1007/s10495-015-1144-y. - DOI - PMC - PubMed
    1. Ashbrook AW, Lentscher AJ, Zamora PF, Silva LA, May NA, Bauer JA, Morrison TE, Dermody TS. Antagonism of the sodium-potassium ATPase impairs Chikungunya virus infection. MBio 7: e00693–e00616, 2016. doi:10.1128/mBio.00693-16. - DOI - PMC - PubMed
    1. Austin J, First EA. Potassium functionally replaces the second lysine of the KMSKS signature sequence in human tyrosyl-tRNA synthetase. J Biol Chem 277: 20243–20248, 2002. doi:10.1074/jbc.M201923200. - DOI - PubMed
    1. Aziz Q, Li Y, Anderson N, Ojake L, Tsisanova E, Tinker A. Molecular and functional characterization of the endothelial ATP-sensitive potassium channel. J Biol Chem 292: 17587–17597, 2017. doi:10.1074/jbc.M117.810325. - DOI - PMC - PubMed
    1. Bertorello AM, Komarova Y, Smith K, Leibiger IB, Efendiev R, Pedemonte CH, Borisy G, Sznajder JI. Analysis of Na+,K+-ATPase motion and incorporation into the plasma membrane in response to G protein-coupled receptor signals in living cells. Mol Biol Cell 14: 1149–1157, 2003. doi:10.1091/mbc.e02-06-0367. - DOI - PMC - PubMed

Publication types

MeSH terms