. 2019 Oct;15(10):1738-1756.
doi: 10.1080/15548627.2019.1596475. Epub 2019 Apr 5.

Cross-regulation of defective endolysosome trafficking and enhanced autophagy through TFEB in UNC13D deficiency

Affiliations

Cross-regulation of defective endolysosome trafficking and enhanced autophagy through TFEB in UNC13D deficiency

Jinzhong Zhang et al. Autophagy. 2019 Oct.

Abstract

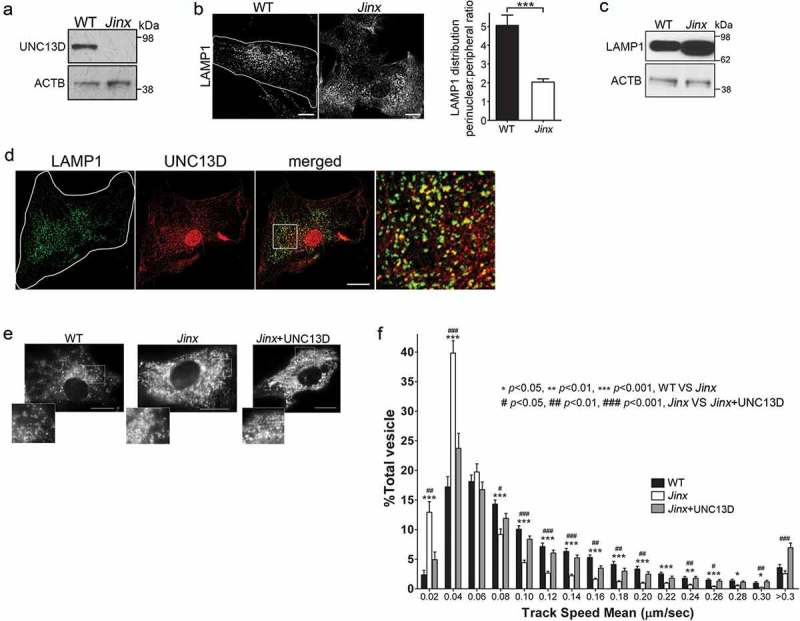
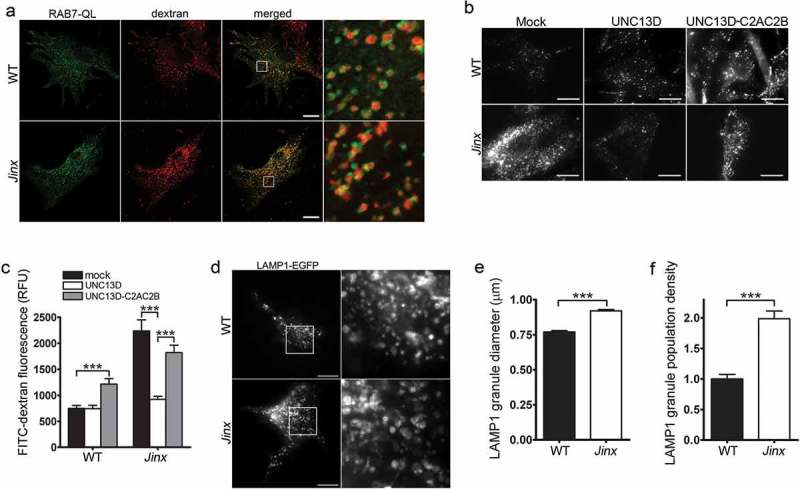
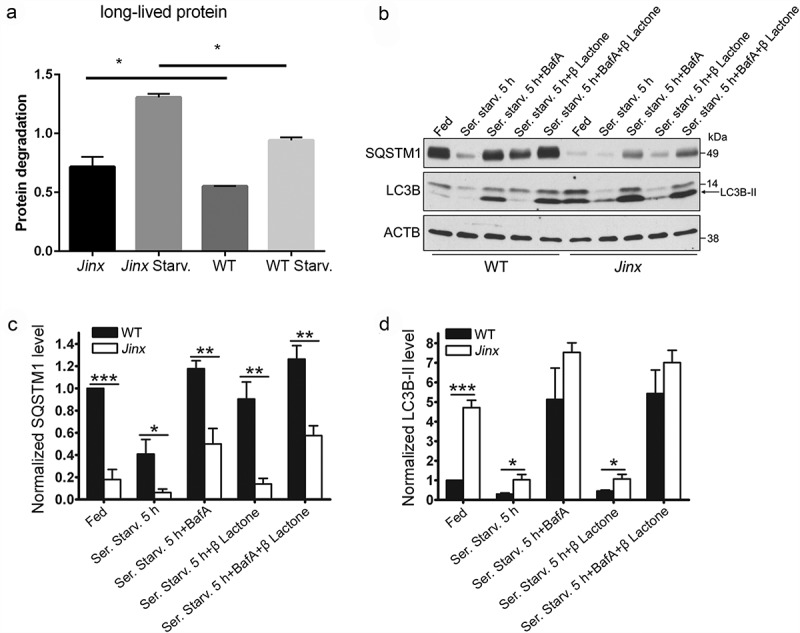
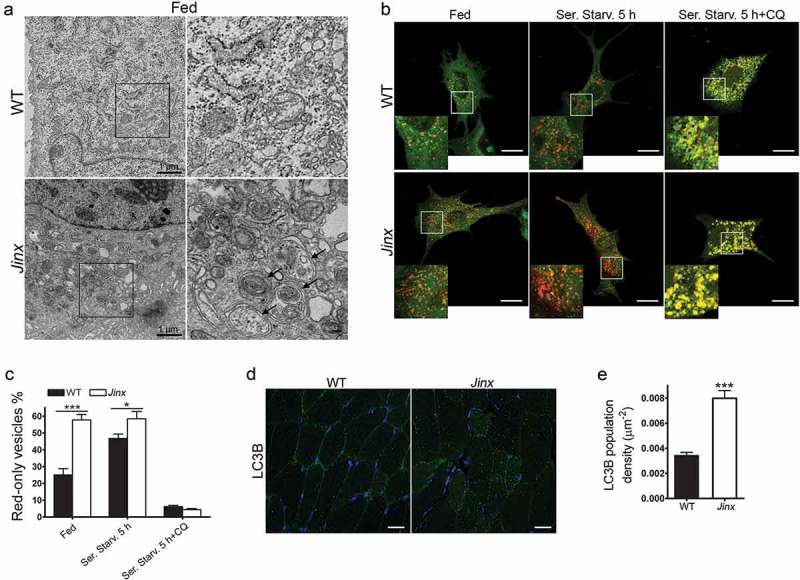
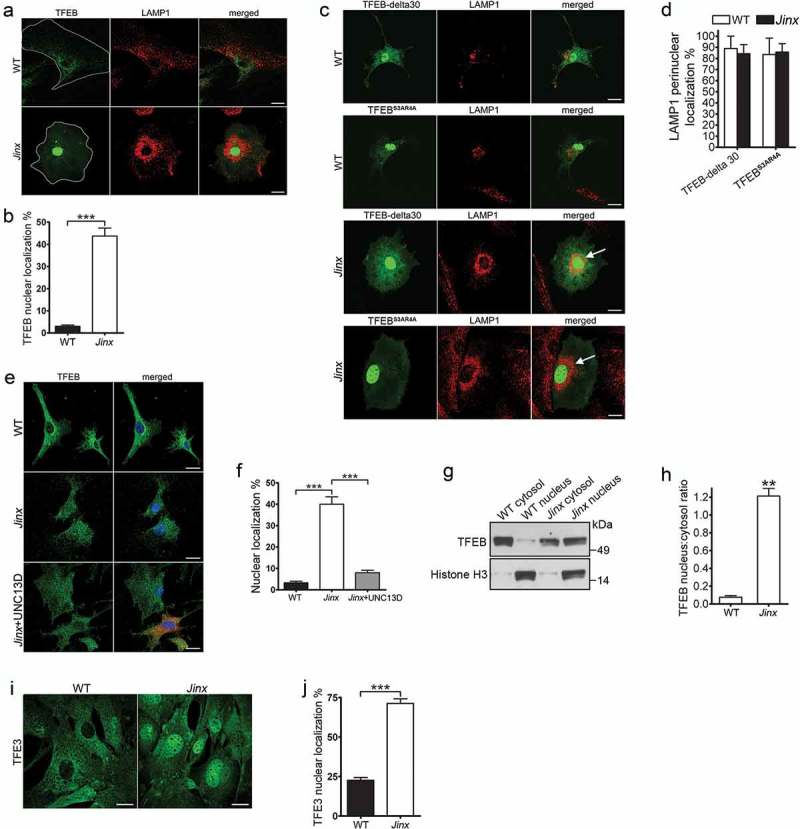
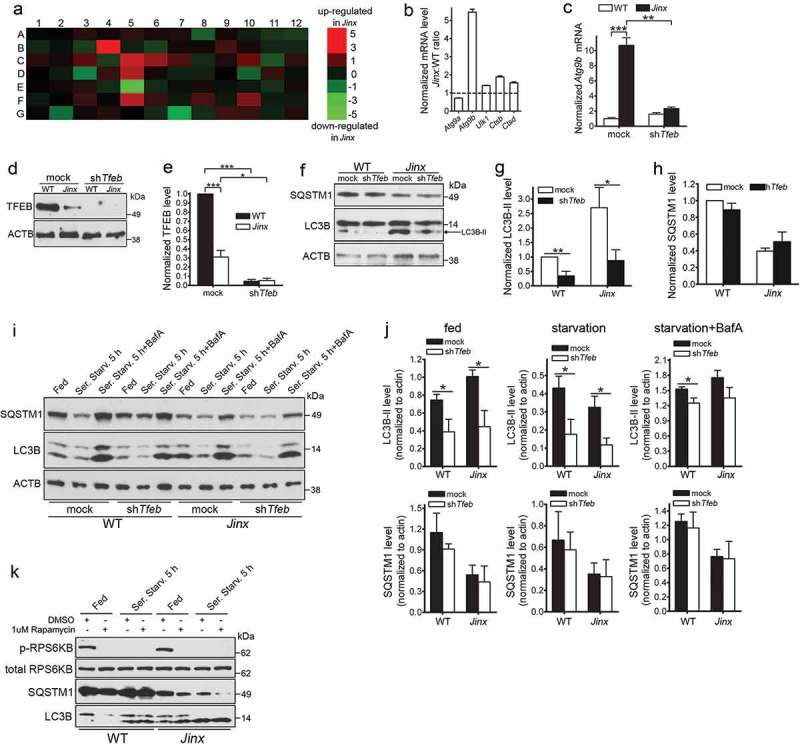
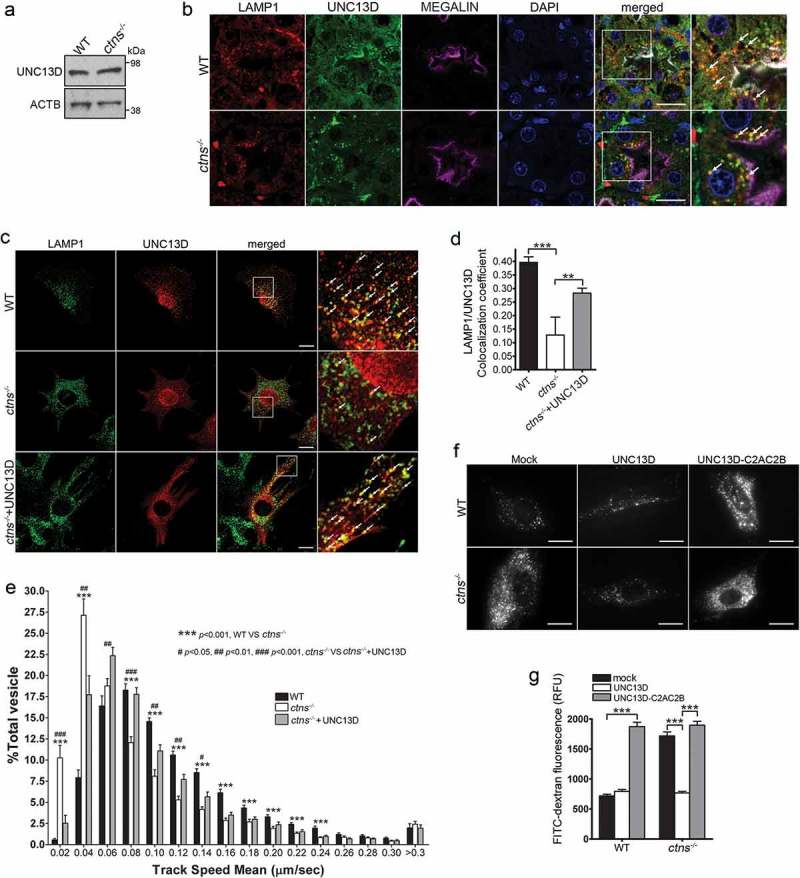
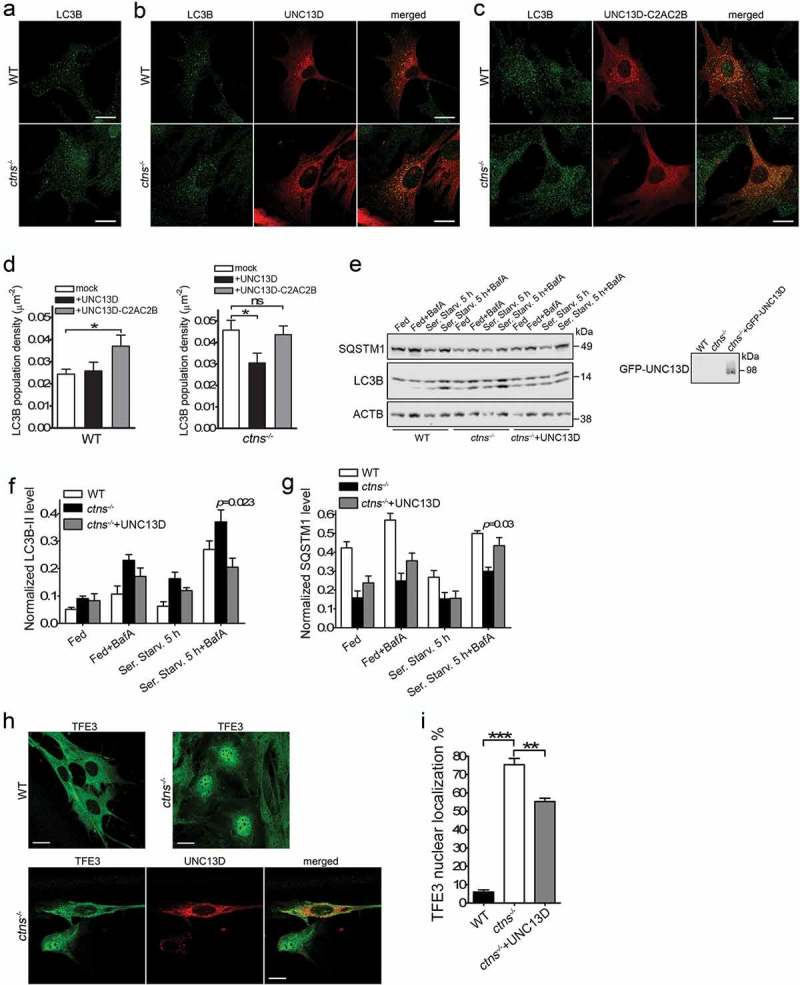
Several lines of evidence support the occurrence of cross-regulation between the endocytic pathway and autophagy, but the molecular mechanisms regulating this process are not well-understood. Here, we show that the calcium sensor UNC13D regulates the molecular mechanism of late endosomal trafficking and endosomal maturation, and defects in UNC13D lead to macroautophagy upregulation. unc13d-null cells showed impaired endosomal trafficking and defective endocytic flux. The defective phenotypes were rescued by the expression of UNC13D but not by its STX7-binding-deficient mutant. This defective endosomal function in UNC13D-deficient cells resulted in increased autophagic flux, increased long-lived protein degradation, decreased SQSTM1/p62 protein levels and increased autolysosome formation as determined by biochemical, microscopy and structural methods. The autophagic phenotype was not associated with increased recruitment of the UNC13D-binding proteins and autophagy regulators, RAB11 or VAMP8, but was caused, at least in part, by TFEB-mediated upregulation of a subset of autophagic and lysosomal genes, including Atg9b. Downregulation of TFEB decreased Atg9b levels and decreased macroautophagy in unc13d-null cells. UNC13D upregulation corrected the defects in endolysosomal trafficking and decreased the number of accumulated autophagosomes in a cellular model of the lysosomal-storage disorder cystinosis, under both fed and starvation conditions, identifying UNC13D as an important new regulatory molecule of autophagy regulation in cells with lysosomal disorders. Abbreviations ACTB: actin, beta; CTSB: cathepsin B; EEA1: early endosome antigen 1; ESCRT: endosomal sorting complex required for transport; FHL3: familial hemophagocytic; lymphohistiocytosis type 3; HEX: hexosaminidase; HLH: hemophagocytic lymphohistiocytosis; LSD: lysosomal storage disorder; MEF: mouse embryonic fibroblast; SEM: standard errors of the mean; SNARE: soluble n-ethylmaleimide-sensitive-factor attachment receptor; STX: syntaxin; SYT7: synaptotagmin VII; TFE3: transcription factor E3; TFEB: transcription factor EB; TIRF: total internal reflection fluorescence ULK1: unc-51 like kinase 1; UNC13D: unc-13 homolog d; VAMP: vesicle-associate membrane protein; WT: wild-type.

Keywords: Autophagy; FHL3; TFEB; endosomal trafficking; fusion; lysosomal signaling; secretion.


Figures

Figure 1.
Figure 1.
UNC13D regulates endo-lysosome trafficking in non-secretory cells. (a) Immunoblot analysis of the expression of UNC13D in wild-type (WT) and unc13d-null (Jinx) mouse embryonic fibroblasts (MEFs). (b) Left panel, Immunofluorescence and confocal microscopy analysis of the distribution of endogenous LAMP1 in WT and Jinx MEFs. Scale bar: 20 µm. Right panel, quantification of LAMP1 distribution. Results are represented as mean ± SEM. At least 25 cells from 3 separate experiments were analyzed. ***p < 0.001, Student’s t-test. (c) Immunoblot analysis of the expression of LAMP1 in WT and Jinx MEFs. (d) Immunofluorescence analysis of endogenous proteins. Quantification of UNC13D and LAMP1 colocalization is shown in Figure 7(d). (e,f) Pseudo-TIRF microscopy analysis of the trafficking of acidic organelles in WT and Jinx cells. (e) Representative images of WT, Jinx and rescued Jinx MEFs labeled with LysoTracker. Scale bar: 20 µm. (f) Quantification of vesicular dynamics, analyzed by pseudo-TIRFM. The histograms represent the track speeds of LysoTracker-labeled vesicles in WT (black bars), Jinx (white bars) and rescued Jinx MEFs (gray bars). The speeds for the independent vesicles were binned in 0.02 µm/s increments and plotted as a percentage of total vesicles for a given cell. Results are represented as mean ± SEM from at least 20 cells. The statistically significant differences between the two groups are indicated in the figure. Student’s t-test.
Figure 2.
Figure 2.
Defective endosomal cargo processing in UNC13D-deficiency is rescued by UNC13D but not by a calcium- and STX7-binding-deficient mutant. (a) Confocal microscopy analysis of the distribution of GFP-RAB7QL and dextran in wild-type (WT) and unc13d-null (Jinx) cells. Scale bar: 20 µm. After 3-hour loading and 3-hour chase dextran was observed exclusively inside RAB7-positive vesicles. (b) Analysis of endosomal cargo processing. WT and Jinx MEFs were mock transfected (mock) or transfected with vectors for the expression of mCherry-UNC13D or the calcium- and STX7-binding-deficient mutant mCherry-UNC13D-C2AC2B, with point mutations D127A, D133A, D941A and D947A to knockout the Ca2+-binding sites in the C2A and C2B domains. After 48 h, the cells were loaded with FITC-dextran at 37°C for 3 h, then washed and chased in complete medium for 3 h. Representative images of accumulated FITC-dextran in cells are shown. Scale bar: 20 µm. (c) Quantification of the results shown in (b). Results are represented as mean ± SEM. At least 60 cells from 3 separate experiments were analyzed. ***p < 0.001, Student’s t-test. RFU, Relative Fluorescence Units. (d) Representative images of pseudo-TIRFM analysis of LAMP1-EGFP-positive organelles in WT and Jinx cells. Scale bar: 20 µm. (e) Quantitative analysis of late endosomal size. Quantification was performed by measuring the diameter of LAMP1-EGFP-positive late endosomes in each cell using ImageJ. Results are represented as mean ± SEM from at least 20 cells. ***p < 0.001, Student’s t-test. (f) Quantitative analysis of late endosome population density was performed by the establishing the ratio of EGFP-LAMP1-positive late endosomes numbers in each cell per cell area. Results are represented as mean ± SEM from at least 20 cells. ***p < 0.001, Student’s t-test.
Figure 3.
Figure 3.
Increased autophagic flux in UNC13D-deficiency. (a) Long-lived protein degradation assays were performed in 35S-methionine labeled wild-type (WT) and unc13d-null cells (Jinx) under fed or starvation (Starv.) conditions as described in Materials and Methods. The data represent the mean ± SEM of 3 biological replicates. *p < 0.05, Student’s t-test. (b) SQSTM1 and LC3B-II protein expression in WT and Jinx MEFs were analyzed by immunoblotting under fed and serum starvation (starv) conditions, in the presence or absence of 100 nM bafilomycin A (BafA) or 1 µM of the proteasome inhibitor Clasto-Lactacystin β-lactone, for 5 h. Quantitation of SQSTM1 (c) and LC3B-II (d) protein expression levels. The data represent mean ± SEM from 3 independent experiments. *p < 0.05, **p < 0.01 and ***p < 0.001, Student’s t-test.
Figure 4.
Figure 4.
Increased number of autophagosomes in UNC13D-deficiency. (a) Electron microscopy analysis in wild-type (WT) and unc13d-null (Jinx) MEFs, respectively, under fed conditions. Black arrows, autophagosomes. (b) Representative images of WT and Jinx cells transfected with the mCherry-GFP-LC3B macroautophagy biosensor under resting conditions (Fed), or after serum starvation (Ser. Starv.) in the presence or absence of the alkalinizing drug chloroquine (CQ). GFP and mCherry florescence was analyzed by confocal microscopy. Yellow vesicles are indicative of autophagosomes. Red-only vesicles are indicative of autolysosomes as GFP fluorescence decreases in the acidic environment of autolysosomes. Scale bar: 20 µm. (c) The percentage of mature autolysosomes (red-only vesicles) was calculated based on the ratio between the number of red-only puncta and the total number of autophagosomes. Quantitative results are represented as mean ± SEM from at least 20 cells. *p < 0.05 and ***p < 0.001, Student’s t-test. (d) Immunofluorescence analysis of mouse skeletal muscle tissue for the expression of endogenous LC3B (green) shows that Jinx tissue has increased LC3B puncta as compared to WT control tissue. Nuclei are shown in blue (DAPI). Scale bar: 20 µm. (e) Quantitative analysis of the LC3B population density was performed using Image Pro. Data are represented as mean ± SEM. At least 35 cells were analyzed. ***p < 0.001, Student’s t-test.
Figure 5.
Figure 5.
TFEB is activated in UNC13D-deficient cells. (a) Confocal microscopy analysis of the localization of TFEB and LAMP1. Wild-type (WT) and unc13d-null (Jinx) cells were transfected with a TFEB-EGFP expression vector and immuno-stained with anti-LAMP1 antibody. Representative images are shown. Scale bar: 20 µm. (b) Quantification of the distribution of TFEB-GFP in WT and Jinx cells. The data is represented as mean ± SEM. At least 20 cells for each group were analyzed. ***p < 0.001, Student’s t-test. (c) Confocal microscopy analysis of the localization of constitutively active TFEB and LAMP1. WT and Jinx MEFs were transfected with EGFP-TFEB-delta30 or EGFP-TFEBS3AR4A expression vectors and immuno-stained with anti-LAMP1 antibody. Representative images are shown. Scale bar: 20 µm. The arrows indicate the change in the distribution of LAMP1-positive puncta showing re-localization towards the perinuclear area. (d) Quantification of the data show in (c). The data is represented as mean ± SEM. At least 20 cells were analyzed. (e) Confocal microscopy analysis of the distribution of endogenous TFEB (green) and nuclei (blue) in WT, Jinx and Jinx MEFs rescued by the expressing mCherry-UNC13D (red). Scale bar: 20 µm. (f) Quantification of the data shown in E. The percentage of MEFs with nuclear localized TFEB is presented as mean ± SEM from at least 50 cells. ***p < 0.001, Student’s t-test. (g) Cytosol and nuclear fractions from WT and Jinx MEFs were analyzed by Western blot. Histone H3 was used as a marker of the nuclear fraction. (h) Quantification of the nucleus:cytosol ratio of TFEB from 3 independent experiments. The results are presented as mean ± SEM. **p < 0.01, Student’s t-test. (i) Confocal microscopy analysis of the distribution of endogenous TFE3 in WT and Jinx MEFs. Scale bar: 20 µm. (j) The percentage of cells with nuclear localized TFE3 are presented as mean ± SEM from the analysis of at least 50 cells. ***p < 0.001, Student’s t-test.
Figure 6.
Figure 6.
Activation of TFEB induces autophagy upregulation in UNC13D-deficient cells. (a) qPCR array was performed using the RT2 Profiler™ PCR Array System and 84 autophagy and lysosomal genes were analyzed in wild-type (WT) and unc13d-null (Jinx) MEFs. The amount of mRNA in the samples, standardized to 5 housekeeping genes, was expressed as ΔΔCT as described in Material and Methods. See Table S1 for gene information. (b) The upregulation of autophagic and lysosomal genes in UNC13D-deficient cells was validated by quantitative RT-PCR. The target gene expression level was calculated using the 2-ΔΔCT method, which was normalized to actin. The expression levels were relative to the fold change of the corresponding control (WT), which were defined as 1. (c) Atg9b mRNA level was analyzed by qPCR in mock and Tfeb-shRNA (shTfeb) treated WT and Jinx MEFs. (d) WT and Jinx MEFs were infected with lentiviral mouse shRNA against Tfeb (TRCN0000085548, Dharmacon) for 96 h. Expression levels of TFEB were analyzed by Western blot. (e) Quantitative analysis of (d), presented as mean ± SEM from 3 independent experiments. *p < 0.05, ***p < 0.001, Student’s t-test. (f) The indicated macroautophagy markers in mock transfected and Tfeb-knockdown cells were analyzed by Western blot and quantified using ImageJ. (g) Quantitative analysis of LC3B-II expression. Results are represented as mean ± SEM from 3 independent experiments. *p < 0.05, **p < 0.01, Student’s t-test. (h) Quantitative analysis of SQSTM1 protein expression. The results are presented as mean ± SEM from 3 independent experiments. (i) SQSTM1 and LC3B-II protein expression levels were analyzed by Western blot in mock and Tfeb-shRNA transfected WT and Jinx cells under fed, serum starvation (starv) and serum starvation with BafA conditions. (j) Quantitative results of (i) are represented as mean ± SEM from 3 independent experiments. *p < 0.05, Student’s t-test. (k) Phospho-RPS6KB, total RPS6KB, SQSTM1 and LC3B levels in wild-type (WT) and unc13d-null (Jinx) MEFs were analyzed by western blot under fed and serum starvation (Starv.) conditions in the presence or absence of 1 µM rapamycin.
Figure 7.
Figure 7.
UNC13D but not the STX7-binding-deficient mutant UNC13D-C2AC2B rescues the endosomal defective phenotype in cystinosin-deficient (ctns−/-) cells. (a) UNC13D expression in ctns−/- cells. The expression level of UNC13D in WT and ctns−/- MEFs were analyzed by Western blot. (b) Immunofluorescence analysis of WT and ctns−/- mouse kidney proximal tubule cells, identified by the expression of the apical receptor LRP2/megalin, and showing the distribution of endogenous LAMP1 and UNC13D. Scale bar: 20 µm. (c) Localization of UNC13D in WT and ctns−/- cells. Confocal microscopy analysis of the distribution of endogenous LAMP1 and UNC13D in WT, ctns−/- and ctns−/- MEFs expressing mCherry-UNC13D was performed as described in Material and Methods. Scale bar: 20 µm. The arrows indicate that UNC13D localizes at LAMP1-positive structures. (d) Quantitative analysis of the colocalization of LAMP1 and UNC13D in WT, ctns−/- and ctns−/-+UNC13D MEFs. Data are presented as mean ± SEM, n = 15. **p < 0.01 and ***p < 0.001. (e) Vesicular dynamics analysis of acidic endolysosomes in WT and ctns−/- cells was performed using pseudo-TIRFM. The histograms represent the track speeds of LysoTracker-labeled vesicles in WT (black bars), ctns−/- (white bars) and ctns−/- MEFs expressing mCherry-UNC13D (gray bars). The speeds of the independent vesicles were binned in 0.02 µm/s increments and plotted as a percentage of total vesicles for a given cell. Results are represented as mean ± SEM from at least 20 cells. The statistical significant differences between the groups are indicated in the figure. Student’s t-test. (f) Analysis of endosomal cargo processing in WT and ctns−/- cells. WT and ctns−/- MEFs were mock-transfected or transfected with vectors for the expression of mCherry-UNC13D or the calcium/STX7-binding-defective mutant mCherry-UNC13D-C2AC2B (described in Figure 2). The cells were used in dextran processing assays as described under Materials and Methods. Representative images of accumulated FITC-dextran in the cells are shown. Scale bar: 20 µm. (g) Quantitative analysis of fluorescent FITC-dextran represented as Mean ± SEM. At least 60 cells from 3 independent experiments were analyzed. ***p < 0.001, Student’s t-test. RFU, Relative Fluorescence Units.
Figure 8.
Figure 8.
UNC13D expression improves autophagy in a model of the lysosomal-storage disease cystinosis. (a–c) WT and ctns−/- mouse embryonic fibroblasts were mock transfected (a), transfected with mCherry-UNC13D (b) or with mCherry-UNC13D-C2AC2B (C) expression vectors and immuno-stained with an anti-LC3B antibody. Representative confocal images are shown. Scale bar: 20 µm. (d) LC3B puncta density was calculated using Image Pro. Data are presented as mean ± SEM. At least 20 cells were analyzed. *p < 0.05. ANOVA followed by Fisher’s post-hoc test. (e–g) Analysis of the effect of UNC13D exogenous expression on autophagic flux in ctns−/- cells under fed, starved and blocked conditions. ctns−/- cells and ctns−/- cells expressing GFP-UNC13D were fed, starved and/or treated with bafilomycin and analyzed for the expression of LC3B and SQSTM1 levels by Western blot. (e) Representative of 4 independent experiments. (f) and (g) The data are presented as Mean ± SEM. (h) and (i), Immunofluorescence analysis and quantification of the nuclear localization of TFE3 in wild-type, ctns−/- and ctns−/- cells expressing mCherry-UNC13D. Scale bar: 20 µm. n = 3; Mean ± SEM. At least 50 cells were analyzed. **p < 0.01 and ***p < 0.001.

Similar articles

Cited by

References

    1. Klionsky D. Autophagy: from phenomenology to molecular understanding in less than a decade. Nat Rev Mol Cell Biol. 2007;8(11):931–937. - PubMed
    1. Boya P, Gonzalez-Polo RA, Casares N, et al. Inhibition of macroautophagy triggers apoptosis. Mol Cell Biol. 2005;25(3):1025–1040. - PMC - PubMed
    1. Mijaljica D, Prescott M, Devenish RJ.. Microautophagy in mammalian cells: revisiting a 40-year-old conundrum. Autophagy. 2011;7(7):673–682. - PubMed
    1. Kaushik S, Cuervo A.. Chaperone-mediated autophagy: a unique way to enter the lysosome world. Trends Cell Biol. 2012;22(8):407–417. - PMC - PubMed
    1. Napolitano G, Johnson JL, He J, et al. Impairment of chaperone-mediated autophagy leads to selective lysosomal degradation defects in the lysosomal storage disease cystinosis. EMBO Mol Med. 2015;7(2):158–174. - PMC - PubMed

Publication types

MeSH terms

Substances