. 2019 Jun 1;316(6):C792-C804.
doi: 10.1152/ajpcell.00010.2019. Epub 2019 Mar 20.

Electrophysiological impact of thiocyanate on isolated mouse retinal pigment epithelial cells

Affiliations

Electrophysiological impact of thiocyanate on isolated mouse retinal pigment epithelial cells

Xu Cao et al. Am J Physiol Cell Physiol. .

Abstract

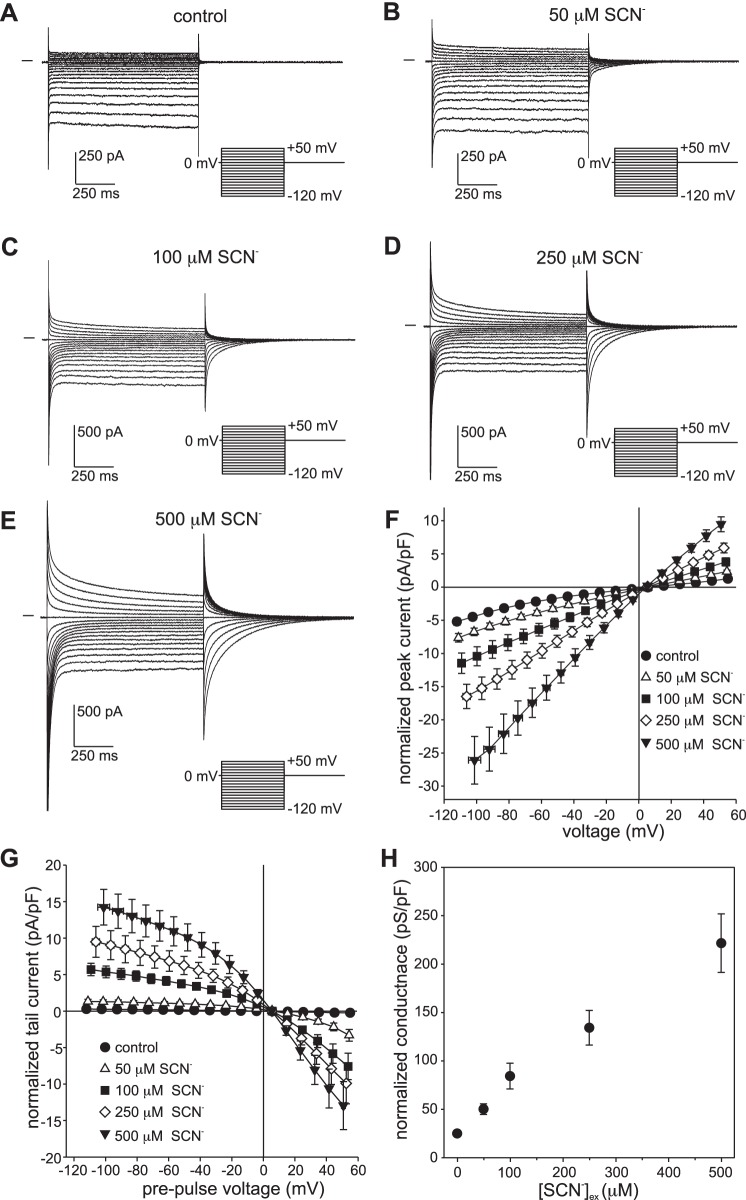
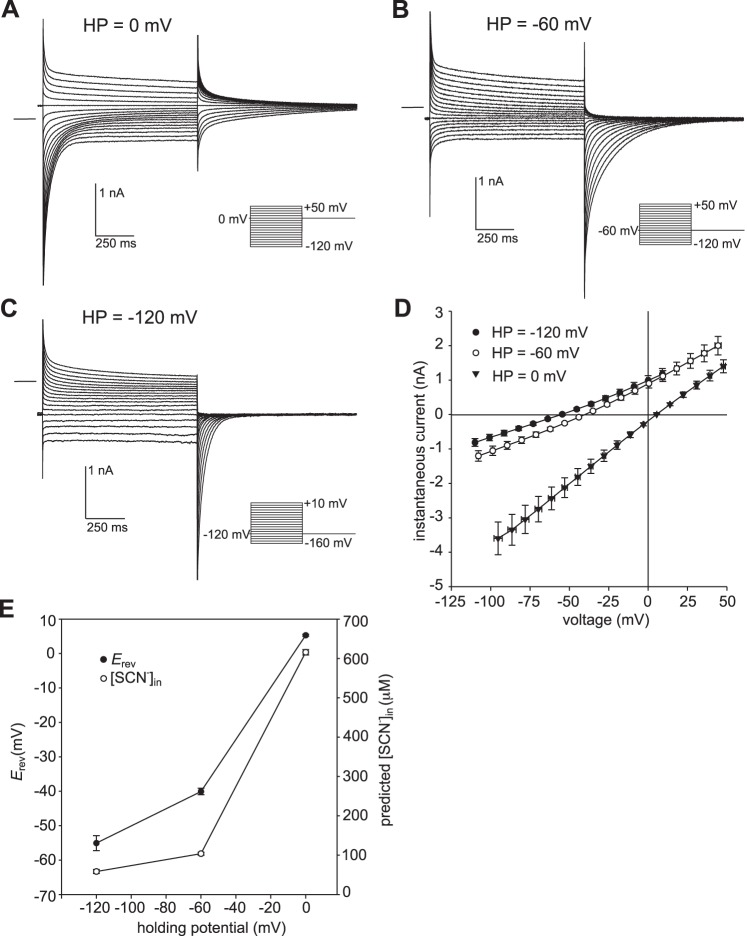
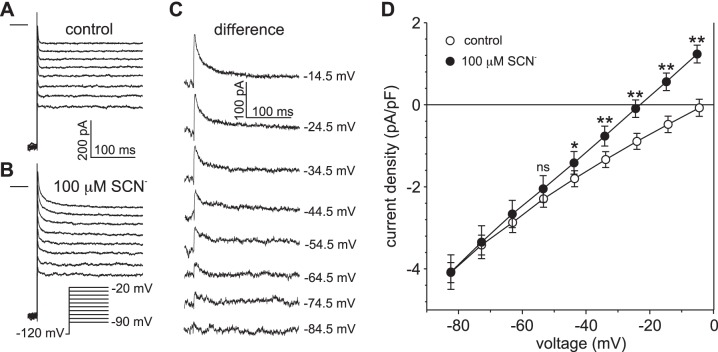
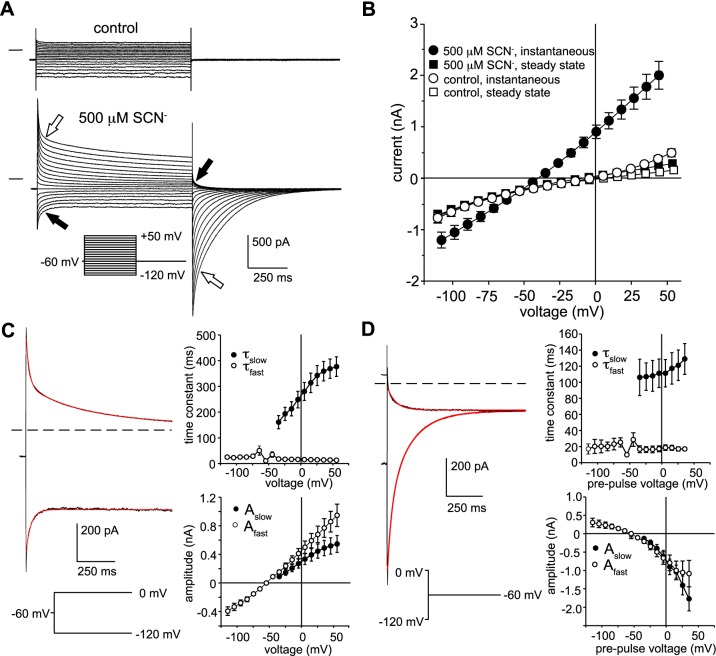
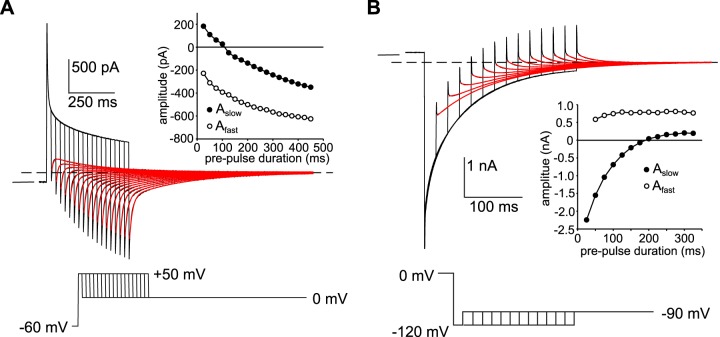
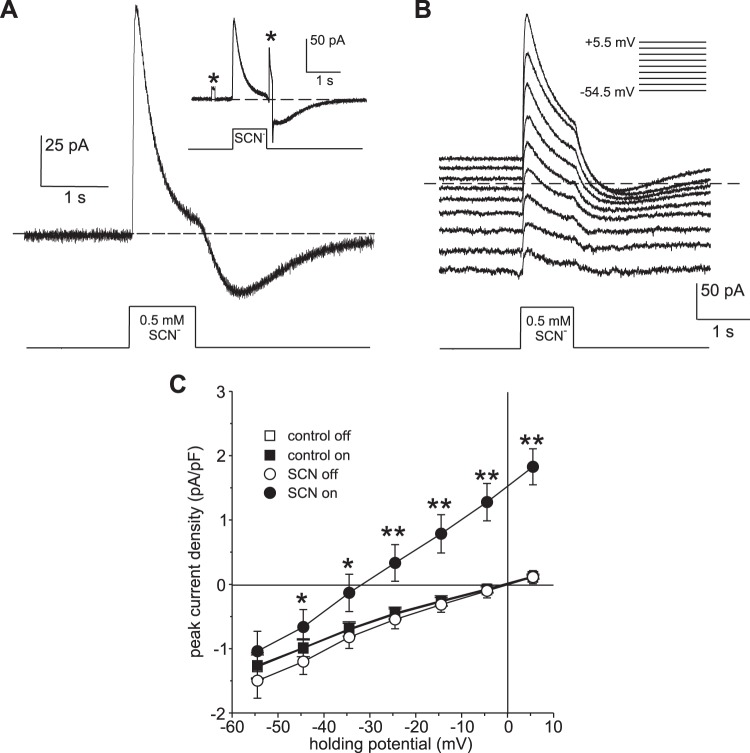
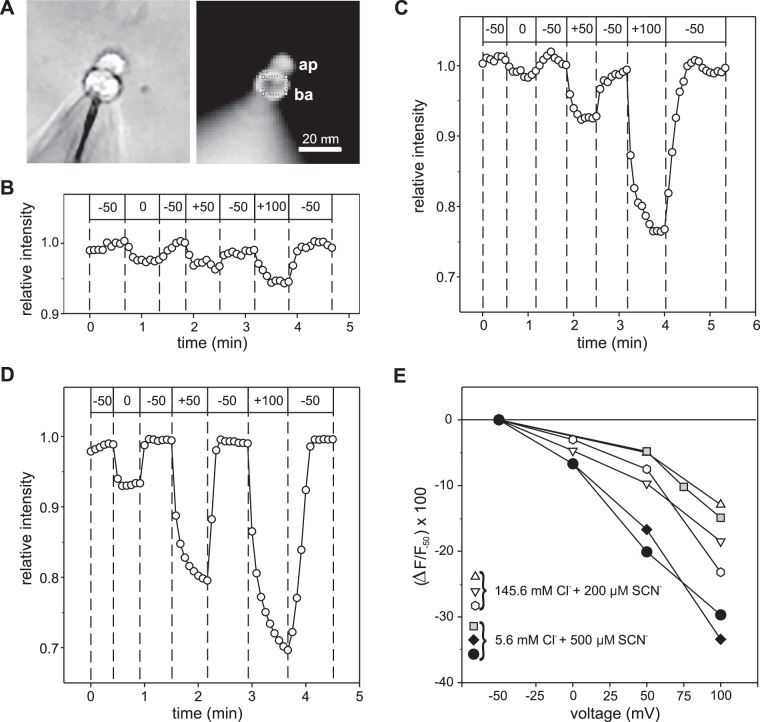
Our recent electrophysiological analysis of mouse retinal pigment epithelial (RPE) cells revealed that in the presence of 10 mM external thiocyanate (SCN-), voltage steps generated large transient currents whose time-dependent decay most likely results from the accumulation or depletion of SCN- intracellularly. In the present study, we investigated the effects of more physiologically relevant concentrations of this biologically active anion. In whole cell recordings of C57BL/6J mouse RPE cells, we found that, over the range of 50 to 500 µM SCN-, the amplitude of transient currents evoked by voltage steps was proportional to the extracellular SCN- concentration. Transient currents were also produced in RPE cells when the membrane potential was held constant and the external SCN- concentration was rapidly increased by pressure-ejecting 500 µM SCN- from a second pipette. Other results indicate that the time dependence of currents produced by both approaches results from a change in driving force due to intracellular SCN- accumulation or depletion. Finally, by applying fluorescence imaging and voltage-clamping techniques to BALB/c mouse RPE cells loaded with the anion-sensitive dye MQAE, we demonstrated that in the presence of 200 or 500 µM extracellular SCN-, depolarizing voltage steps increased the cytoplasmic SCN- concentration to an elevated steady state within several seconds. Collectively, these results indicate that, in the presence of physiological concentrations of SCN- outside the RPE, the conductance and permeability of the RPE cell membranes for SCN- are sufficiently large that SCN- rapidly approaches electrochemical equilibrium within the cytoplasm when the membrane voltage or external SCN- concentration is perturbed.

Keywords: RPE; anion conductance; anion permeability.


Conflict of interest statement

No conflicts of interest, financial or otherwise, are declared by the authors.

Figures

Fig. 1.
Fig. 1.
Dependence of whole cell currents in isolated mouse retinal pigment epithelial (RPE) cells on external thiocyanate (SCN) concentration ([SCN]ex). AE: families of whole cell currents were recorded in the same cell in the presence of 0 µM (A), 50 µM (B), 100 µM (C), 250 µM (D), or 500 µM SCN (E). The pipette and bath solutions contained 140 mM Cl and 145.6 mM Cl, respectively. Currents were evoked from a holding potential of 0 mV by a series of voltage steps in the range of −120 mV to +50 mV. The interval between the start of voltage steps was 3 s. The horizontal trace to the left of each family of currents represents the zero-current level. F: dependence of instantaneous current amplitude on [SCN]ex. Currents were normalized by membrane capacitance, and membrane voltage was corrected for liquid junction potentials and the voltage drop across series resistance (Rs). Symbols represent means and bidirectional error bars represent SE (n = 5–7 cells from 3 C57BL/6J mice); where not visible, the error bars are smaller than the symbols. The mean current at each SCN concentration is significantly larger than control at all voltages in the ranges of −100 mV to −30 mV and +20 mV to +50 mV (P < 0.05, two-way ANOVA followed by Tukey’s multiple-comparisons test). G: dependence of tail current amplitude on [SCN]ex. Currents are normalized by membrane capacitance, and voltages represent the membrane potential before the initiation of tail currents by returning to the holding potential. Symbols represent means and bidirectional error bars represent SE (n = 5–7 cells from 3 C57BL/6J mice). The mean tail current at each SCN concentration is significantly larger compared with control (P < 0.05) for pre-pulses to voltages in the ranges of −120 mV to −30 mV and +20 mV to +50 mV. H: dependence of conductance on [SCN]ex. Slope conductance was calculated from instantaneous currents in cells individually at each concentration. Symbols represent means and error bars represent SE (n = 5–7 cells from 3 C57BL/6J mice). The mean conductance at each concentration is significantly different for all comparisons (P < 0.01, one-way ANOVA followed by Tukey’s multiple comparisons test), except for 50 µM vs. 100 µM.
Fig. 2.
Fig. 2.
The effect of holding potential on currents produced in the presence of 500 µM external thiocyanate (SCN). AC: families of whole cell currents evoked in the same retinal pigment epithelial (RPE) cell from a holding potential of 0 mV (A), −60 mV (B), or −120 mV (C). The zero-current level is shown by the horizontal line to the left of each family of currents. The interval between the start of voltage steps was 7 s for holding potential (HP)  = −120 mV and 3 s for HP = −60 mV and HP = 0 mV. The pipette and bath solutions contained 140 mM Cl and 145.6 mM Cl, respectively. D: summary of similar experiments (repeated measures in 7 cells from 2 C57BL/6J mice) showing current-voltage (I-V) plots of instantaneous current obtained from holding potentials of −120 mV (●), −60 mV (○), and 0 mV (▼). Symbols represent means and bidirectional error bars represent SE. Voltages are corrected for liquid junction potentials and the voltage drop across series resistance (Rs). Membrane potential (Vm) corrected for voltage errors averaged −110.0 ± 0.8 mV, −53.1 ± 0.2 mV, and +5.4 ± 0.1 mV at holding potentials of −120 mV, −60 mV, and 0 mV, respectively. The mean current amplitudes for the three holding potentials are significantly different from each other at all voltages, except for HP = −120 mV vs. HP = −60 mV at +10 mV (P < 0.05, two-way ANOVA followed by Tukey’s multiple-comparison test). E: dependence of reversal potential (Erev, ●, left y-axis) and intracellular SCN concentration predicted for passive distribution (○, right y-axis) on holding potential. Symbols represent means and error bars represent SE (n = 7; P < 0.005, two-way ANOVA followed by Tukey’s multiple-comparison test).
Fig. 3.
Fig. 3.
Determination of the voltage threshold for SCN influx in retinal pigment epithelial (RPE) cells exposed to 100 µM external thiocyanate (SCN). A and B: families of whole cell currents recorded in the same RPE cell in the absence (A) and presence (B) of 100 µM external SCN. Currents were evoked by a series of voltage steps from a holding potential of −120 mV. The horizontal lines to the left of the current families represent the zero-current potential. The pipette and bath solutions contained 140 mM Cl and 145.6 mM Cl, respectively. C: family of SCN-dependent currents obtained by taking the difference between the current traces in B from those in A. The value at the right of each current trace represents the amplitude of the voltage step, corrected for liquid junction potentials. D: current-voltage (I-V) relationships of peak current density obtained in the absence (○) and presence (●) of 100 µM external SCN. Peak currents were measured 6–12 ms after the onset of the voltage steps. Symbols represent means and error bars represent SE; n = 5 cells from 3 C57BL/6J mice. *P < 0.05 compared with control; **P < 0.01 compared with control; ns, not significant, P > 0.05 (two-way ANOVA followed by Sidak’s multiple-comparisons test).
Fig. 4.
Fig. 4.
Time dependence of currents in the presence of 500 µM external thiocyanate (SCN). A: families of currents recorded in the same mouse retinal pigment epithelial (RPE) cell in the absence (top) and presence (bottom) of 500 µM SCN. The membrane potential was held at −60 mV between voltage steps in the range of −120 mV to +50 mV. Open block arrows point to the outward current and inward tail current produced by a voltage step to +50 mV and the closed block arrows indicate the inward current and outward tail current produced by a voltage step to −120 mV. B: voltage dependence of instantaneous and steady-state currents elicited from a holding potential of −60 mV in the absence and presence of 500 µM external SCN. Instantaneous currents were measured 10 ms after the onset of the voltage steps (●), and steady-state currents were measured 10 ms before their termination (■). Symbols represent means and the bidirectional error bars represent SE; n = 7 cells from two C57BL/6J mice. C: kinetics of the time-dependent decay in currents in 500 µM SCN. Left: time course of current decay during voltage steps from a holding potential of −60 to 0 mV (top), fitted by a double-exponential function (red trace) or to −120 mV (bottom), and fitted by a single exponential function (red trace). Right: voltage dependence of the time constant (τ; top) and amplitude (A; bottom) of the fast and slow components of the transient current obtained from single or double-exponential fits. Data shown represent means ± SE; n = 7 cells from 2 C57BL/6J mice). D: kinetics of the time-dependent decay in tail currents in 500 µM SCN. Left: time course of tail current decay at −60 mV following the offset of voltage steps to −120 mV (top) fitted by a single-exponential function (red trace) or to 0 mV (bottom), fitted by a double-exponential function (red trace). Right: voltage dependence of the time constant (top) and amplitude (bottom) of the fast and slow components of the tail current obtained from single or double-exponential fits. Data shown represent means ± SE; n = 5–7 cells from 2 C57BL/6J mice.
Fig. 5.
Fig. 5.
Time-dependent decay in currents is associated with changes in thiocyanate equilibrium potential (ESCN). A: tail currents recorded in a C57BL/6J mouse retinal pigment epithelial (RPE) cell in the presence of 500 µM external thiocyanate (SCN) elicited by stepping the membrane voltage to 0 mV after depolarizing the membrane potential to +50 mV for different durations from a holding potential of −60 mV. The horizontal interrupted line marks the steady-state current at 0 mV and the short horizontal unbroken line the zero-current potential. The pipette and bath solutions contained 140 mM Cl and 145.6 mM Cl, respectively. The red traces are best fits of the tail currents to a double-exponential function. Tail currents following brief depolarizations had a fast inward component followed by a slow outward component. Inset: amplitudes of the slow and fast components of tail current plotted as a function of the duration of the voltage step to +50 mV. The slow component of tail currents was outward for depolarizing voltage steps of short duration and inward for voltage steps of longer duration. The reversal in tail current polarity indicates that the time-dependent decay in outward current is associated with the intracellular accumulation of SCN. Results are representative of experiments in 6 cells from 2 C57BL/6J mice. B: tail currents recorded in a C57BL/6J mouse RPE cell in the presence of 500 µM external SCN elicited by stepping the membrane voltage to −90 mV after hyperpolarizing the membrane potential to −120 mV for different durations from a holding potential of 0 mV. The pipette and bath solutions contained 140 mM Cl and 145.6 mM Cl, respectively. The horizontal interrupted line marks the steady-state current at −90 mV and the short horizontal unbroken line the zero-current potential. The red traces are best fits of the tail currents to a double-exponential function. Inset: amplitudes of the slow and fast components of tail current plotted as a function of the duration of the voltage step to −120 mV. The slow component was inward for hyperpolarizing voltage steps of short duration and outward for voltage steps of long duration. The reversal in tail current polarity indicates that the time-dependent decay in inward current is associated with the depletion of intracellular SCN. Results are representative of experiments in 7 cells from 2 C57BL/6J mice.
Fig. 6.
Fig. 6.
Pressure ejection of thiocyanate (SCN) into the local extracellular environment of retinal pigment epithelial (RPE) cells elicits transient outward currents. A: representative whole cell current response of a C57BL/6J mouse RPE cell voltage clamped to 0 mV to the pressure ejection of 500 µM NaSCN (in 140 mM NMDG-Cl bath solution) via a second pipette to the cell exterior. The horizontal interrupted line marks the zero-current level, and the onset and offset of the pressure step applied to the back of the second pipette are indicated below. The recording chamber was constantly superfused with Na+-free bath solution (NMDG substitution). The local application of SCN elicited an instantaneous outward current that gave way to a slower decline, consistent with rapid SCN influx, followed by a decrease in the influx rate as SCN accumulated intracellularly. Upon termination of the pressure ejection and washout of SCN from the cell exterior, an inward current developed and then declined toward baseline. Because the bath solution was Na+-free, the inward current cannot be attributed to inward Na+ movement but rather likely resulted from the efflux of SCN that had accumulated intracellularly. Inset: changes in current in the same cell evoked by voltage steps from 0 mV to +10 mV for 100 ms before and shortly after the pressure ejection of SCN. Asterisks mark changes in current evoked by the voltage steps. The fact that the second voltage-evoked current change was larger than the first indicates that the membrane conductance had increased during exposure to SCN. B: voltage dependence of the current response to pressure ejection of 500 µM NaSCN (in 140 mM NaCl bath solution). A series of responses were obtained from the same RPE cell at holding potentials ranging from −54.5 mV to +5.5 mV (liquid junction potentials corrected), as indicated by the inset. The horizontal interrupted line marks the zero-current level. The recording chamber was constantly perfused with NaCl bath solution. The amplitude of the SCN-evoked current decreased with increasing hyperpolarization. C: current-voltage (I-V) relationship of the current evoked by the local application of 500 µM SCN by pressure ejection. Symbols represent the mean current density of baseline (○) and peak SCN currents (●) obtained in 5 C57BL/6J mouse RPE cells (3 animals) bathed in 140 mM NaCl solution, to which 500 µM SCN was applied by pressure ejection; error bars indicate the SE (*P < 0.05; **P < 0.002; two-way ANOVA followed by Sidak’s multiple comparisons test). Also shown are control I-V relationships of currents measured before (control off; □) and during (control on; ■) pressure ejection of solution containing 0 SCN (n = 6 cells from 1 C57BL/6J mouse). Symbols representing data from these control experiments overlap, reflecting no significant difference.
Fig. 7.
Fig. 7.
Changes in membrane voltage produce rapid changes in cytoplasmic thiocyanate concentration. A: representative photomicrographs of a BALB/c mouse retinal pigment epithelium (RPE) cell loaded with N-(ethoxycarbonylmethyl)-6-methoxyquinolium bromide (MQAE) imaged with bright-field (left) and fluorescence (right) optics. Patch pipette used for voltage-clamping membrane potential (Vm) and loading the cell with 0.5 mM MQAE can be seen at the bottom left. The circle superimposed on the basolateral pole (right) indicates the region of interest (ROI) from which the MQAE emission fluorescence was measured in the experiments depicted in B and C. ap, apical pole; ba, basolateral pole. B: effect of changes in membrane voltage on relative MQAE fluorescence intensity in a BALB/c mouse RPE cell in the absence of external SCN. The bath solution contained 145.6 mM Cl, and the Cs+-gluconate-based pipette solution contained 5 mM Cl and 0.5 mM MQAE. The command potentials issued by the voltage clamp amplifier are indicated by the values (mV) in the boxes at the top. Depolarization of Vm from −50 mV to 0 mM, +50 mV, and +100 mV produced reversible and proportional decreases in relative fluorescence, indicating MQAE quenching due to Cl influx. C: effect of changes in membrane voltage on relative MQAE fluorescence intensity in the same cell after the addition of 200 µM SCN to the bathing solution. MQAE quenching produced by the depolarizing voltage steps to +50 mV and +100 mV was significantly larger in the presence than in the absence (B) of SCN, reflecting a relatively high rate of conductive SCN flux compared with conductive Cl flux despite its much lower concentration in the bath (0.2 mM SCN vs. 145.6 mM Cl). D: voltage-dependent quenching of MQAE fluorescence by SCN influx under the condition of low external Cl concentration. Time course of relative fluorescence intensity measured in a different BALB/c mouse RPE cell with 5.6 mM Cl, 140 mM isethionate, and 500 µM SCN in the bathing solution and a NMDG-gluconate based pipette solution containing 5 mM Cl and 1 mM MQAE. E: summary of voltage-dependent MQAE fluorescence quenching experiments performed under conditions of low and high external Cl concentrations in 6 cells from 3 BALB/c mice. Each symbol shape represents a different cell, and symbols with the same fill (white, black, or gray) indicate cells from the same mouse. Data are expressed as the percent decrease in fluorescence intensity (∆F) at the test voltage relative to the fluorescence intensity at −50 mV (F−50). The concentrations of external Cl and SCN for each experiment are as indicated.

References

    1. Arai A, Silberg J, Kessler M, Lynch G. Effect of thiocyanate on AMPA receptor mediated responses in excised patches and hippocampal slices. Neuroscience 66: 815–827, 1995. doi:10.1016/0306-4522(94)00616-D. - DOI - PubMed
    1. Aune TM, Thomas EL. Oxidation of protein sulfhydryls by products of peroxidase-catalyzed oxidation of thiocyanate ion. Biochemistry 17: 1005–1010, 1978. doi:10.1021/bi00599a010. - DOI - PubMed
    1. Becker B. The turnover of iodide in the rabbit eye. Arch Ophthalmol 65: 832–836, 1961. doi:10.1001/archopht.1961.01840020834017. - DOI - PubMed
    1. Blaug S, Quinn R, Quong J, Jalickee S, Miller SS. Retinal pigment epithelial function: a role for CFTR? Doc Ophthalmol 106: 43–50, 2003. doi:10.1023/A:1022514031645. - DOI - PubMed
    1. Bösl MR, Stein V, Hübner C, Zdebik AA, Jordt SE, Mukhopadhyay AK, Davidoff MS, Holstein AF, Jentsch TJ. Male germ cells and photoreceptors, both dependent on close cell-cell interactions, degenerate upon ClC-2 Cl− channel disruption. EMBO J 20: 1289–1299, 2001. doi:10.1093/emboj/20.6.1289. - DOI - PMC - PubMed

Publication types

LinkOut - more resources