. 2019 May 15;30(11):1314-1325.
doi: 10.1091/mbc.E18-12-0799. Epub 2019 Mar 20.

In vitro BioID: mapping the CENP-A microenvironment with high temporal and spatial resolution

Affiliations

In vitro BioID: mapping the CENP-A microenvironment with high temporal and spatial resolution

Lucy Remnant et al. Mol Biol Cell. .

Abstract

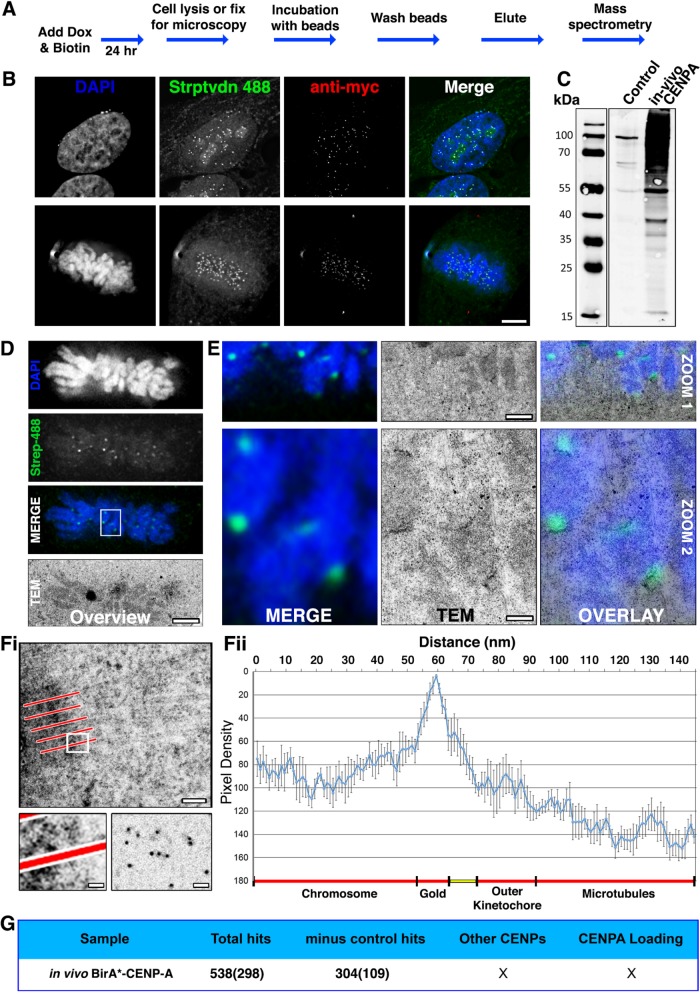
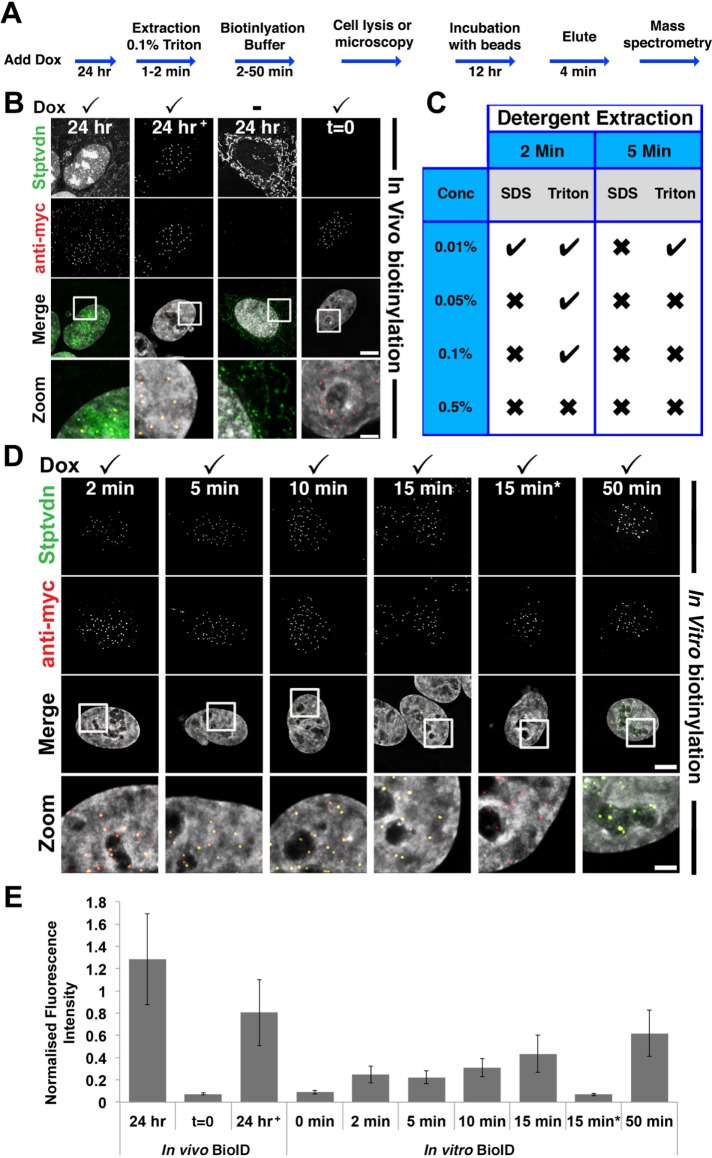
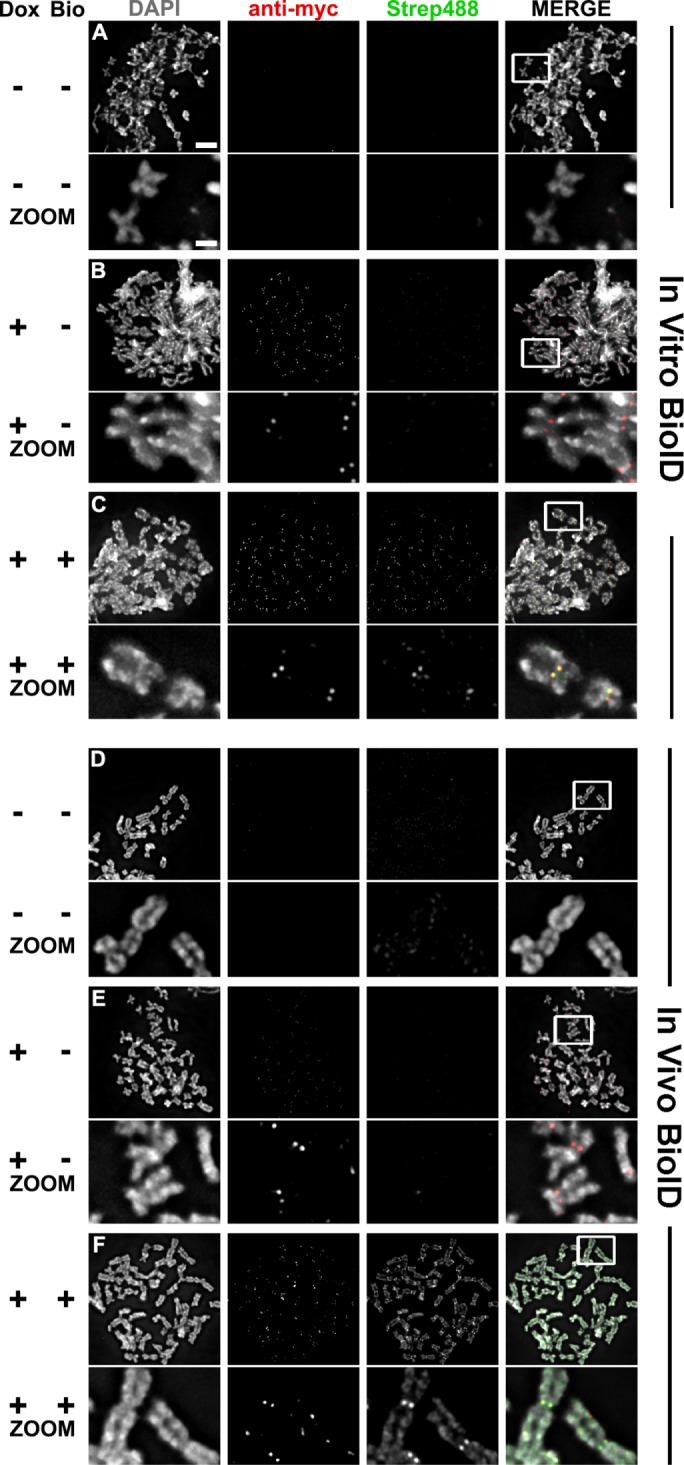
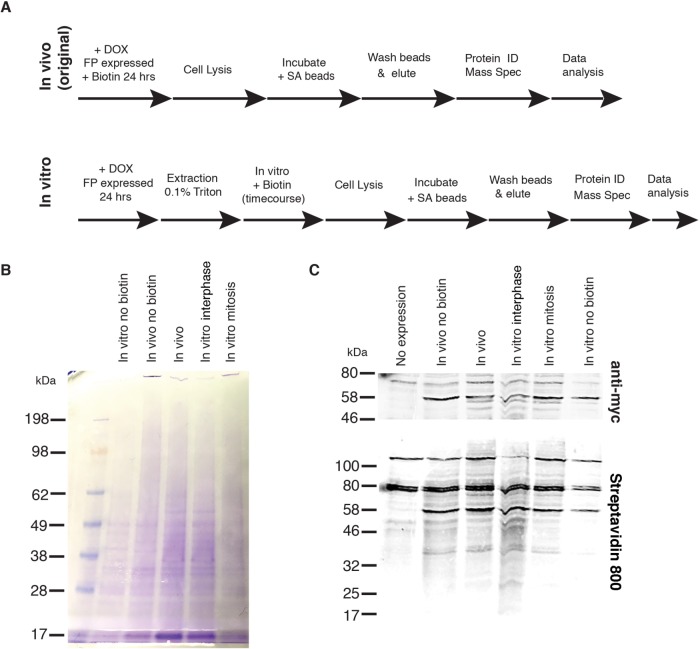
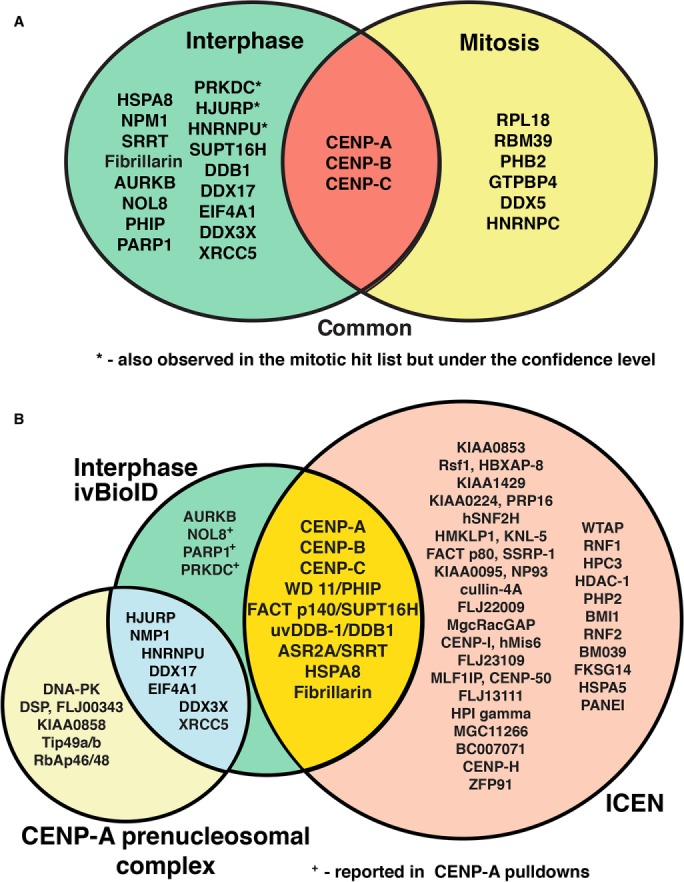
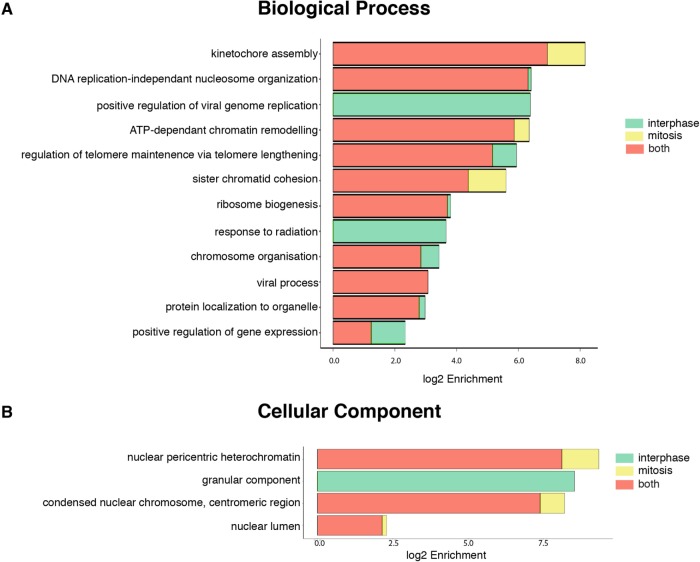
The centromere is located at the primary constriction of condensed chromosomes where it acts as a platform regulating chromosome segregation. The histone H3 variant CENP-A is the foundation for kinetochore formation. CENP-A directs the formation of a highly dynamic molecular neighborhood whose temporal characterization during mitosis remains a challenge due to limitations in available techniques. BioID is a method that exploits a "promiscuous" biotin ligase (BirA118R or BirA*) to identify proteins within close proximity to a fusion protein of interest. As originally described, cells expressing BirA* fusions were exposed to high biotin concentrations for 24 h during which the ligase transferred activated biotin (BioAmp) to other proteins within the immediate vicinity. The protein neighborhood could then be characterized by streptavidin-based purification and mass spectrometry. Here we describe a further development to this technique, allowing CENP-A interactors to be characterized within only a few minutes, in an in vitro reaction in lysed cells whose physiological progression is "frozen." This approach, termed in vitro BioID (ivBioID), has the potential to study the molecular neighborhood of any structural protein whose interactions change either during the cell cycle or in response to other changes in cell physiology.


Figures

FIGURE 1:
FIGURE 1:
Testing in vivo BioID using CENP-A. (A) Flowchart describing how HeLa tet-on cells, stable for the conditional expression of myc-BirA*CENP-A (BirA*–CENP-A), were cultured in media supplemented with doxycycline and 50 µm biotin for 24 h before processing for either microscopy or mass spectrometry. (B) Cells fixed and processed for immunofluorescence. The panels show representative examples of cells in interphase and mitosis probed with streptavidin 488 (green), anti-myc (red), and stained with DAPI (blue). (C) Immunoblot analysis of affinity-purified material from control (parental HeLa cell line) or BirA*–CENP-A expressing cells. Blots were probed with streptavidin 800 IR LI-COR labels. (D–F) HeLa cells were seeded into CLEM dishes and cell culture media was supplemented with doxycycline and 50 μm biotin for 24 h. Cells were fixed, permeabilized, and probed with Alexa Fluor 488 dye–labeled colloidal gold, conjugated to streptavidin (Molecular Probes), and imaged using LM to identify mitotic cells of interest. Cells were embedded in resin, sectioned, and imaged by transmission electron microscopy (TEM). (D) Low-magnification images showing the metaphase plate of mitotic cell chosen for CLEM. Images are DAPI (blue), regions of biotinylation (green), and the same cell reidentified by TEM. (E) Two progressive zooms of the boxed region shown in D, shown as LM merge (left), TEM (middle), and LM-TEM merge (overlay, right). Bottom panels (Zoom 2) show 9× magnifications of the white box in D. Top panels (Zoom 1) are a 3× magnification intermediate of part of the white box in D. Contrast-rich areas are visible corresponding to centromeres. The scale bar shows 100 nm (top) and 20 nm (bottom). (F) Pixel density analysis. Line scans (five to six per kinetochore—indicated in panel Fi, top) were taken through kinetochores, originating in the centromere and terminating in the cytoplasm, among kinetochore microtubules. The bottom left panel is an enlargement of the white box in Fi, showing a representative line scan passing through the kinetochore and terminating in the cytoplasm. The bottom right panel shows gold particles only, spotted onto a carbon film for comparison. Pixel densities were compiled and represented as a histogram (Fii). Predicted subcellular positions are noted beneath the histogram. Ncell = 2. Nkinetochore = 12. Bar = 20 nm. (G) Summary of the MS data returned for in vivo BirA*–CENP-A. Numbers in brackets represent the ranked position of CENP-A within the MS data, based on protein score.
FIGURE 2:
FIGURE 2:
Rapid in vitro biotinylation (ivBioID) of CENP-A. (A) Flowchart of ivBioID method. (B) Immunofluorescence of in vivo prepared BirA*–CENP-A cells. In panels B and E, 24 h+ represents an in vivo BioID sample extracted with 0.1% Triton X-100 before fixation. Panels t = 0 represent a sample with no biotin incubation. (C) Summary of results of cells prepared using the protocol described in A, under a variety of detergent extraction conditions. (D) Immuno­fluorescence of ivBioID–CENP-A prepared cells. Cells were permeabilized with 0.1% Triton X-100 extraction for 2 min. Several biotinylation buffer incubation time points were tested. Cells were fixed and processed for IF as standard and labeled with streptavidin 488 (green) or anti-myc (red). In panels D and E, 15 min* represents cells incubated with biotin buffer lacking ATP. Bar = 5 μm; Zoom bar = 1 μm. (E) Bar graph showing quantification of centromeric immunofluorescence from samples prepared as for B and D. Bars show the mean fluorescence of streptavidin 488 normalized to myc fluorescence. Ncell = 20. Ncentromere = 200.
FIGURE 3:
FIGURE 3:
Chromosome spreads from both in vivo and in vitro prepared samples. Qualitative samples were prepared for comparison of in vivo and in vitro BioID samples. Experimental conditions include cells not expressing BirA*–CENP-A and not treated with biotin (A and D); cells expressing BirA*–CENP-A but not treated with biotin (B and E); cells expressing BirA*–CENP-A and treated with biotin (C and F). All samples were fixed and probed with DAPI, anti-myc (red), and streptavidin 488 (green). Zooms are of the white boxed region in “MERGE.” Bar = 5 and 1 μm.
FIGURE 4:
FIGURE 4:
Production of samples for ivBioID analysis of CENP-A. (A) Comparison of original in vivo BioID (top) and in vitro BioID (bottom) methodologies showing addition of the permeabilization step and post lysis biotinylation. (B) Coomassie blue stain gel of samples submitted for MS showing controls and hit samples. (C) Western blot of samples submitted for MS showing controls and hit samples. Biotinylation can be seen in the bottom panel, and anti-myc–BirA*–CENP-A can be seen in the top panel.
FIGURE 5:
FIGURE 5:
Analysis of the CENP-A neighborhood in interphase and mitosis using ivBioID. (A) Venn diagram showing the final filtered hit lists for interphase (green) and mitotic (yellow) samples and how they overlap with one another. Interphase hits labeled with * were also observed in the mitotic hit list but were under the confidence level. The overlap in red shows those proteins seen in both interphase and mitotic lists. (B) Proteins observed in the interphase ivBioID final hit list (green) show overlap with known CENP-A interacting proteins. The bulk of the proteins detected by ivBioID correspond to proteins previously found in the ICEN complex (yellow overlap; Ando et al., 2002; Obuse et al., 2004; Izuta et al., 2006) and the CENP-A prenucleosomal complex (blue overlap; Foltz et al., 2006). The other proteins not detected in our analysis but found in the original descriptions of the ICEN complex (orange) and CENP-A prenucleosomal complex (pale yellow) are also shown. Hits labeled with + were previously found in pull downs using either CENP-A or themselves as the target.
FIGURE 6:
FIGURE 6:
GO enrichment analysis of interphase and mitotic ivBioID hit lists. GO analysis using the hit lists obtained from the MS reveals enrichment for a subset of biological processes and cellular components. Both sets of samples were run through the g-Profiler toolkit (Reimand et al., 2016) and the significant terms (P < 0.01) for each sample were recorded (Supplemental Table 3). We calculate log2 enrichment for each GO term using the fraction of these terms per sample against the ratio of these terms in the database used by g-Profiler. (A) Biological processes in which the proteins found in the hit lists are enriched. (B) Cellular process in which the proteins found in the hit lists are enriched.

References

    1. Ando S, Yang H, Nozaki N, Okazaki T, Yoda K. (2002). CENP-A, -B, and -C chromatin complex that contains the I-type α-satellite array constitutes the prekinetochore in HeLa cells. Mol Cell Biol , 2229–2241. - PMC - PubMed
    1. Beck DB, Narendra V, Drury WJ, 3rd, Casey R, Jansen PW, Yuan ZF, Garcia BA, Vermeulen M, Bonasio R. (2014). In vivo proximity labeling for the detection of protein-protein and protein-RNA interactions. J Proteome Res , 6135–6143. - PMC - PubMed
    1. Bodor DL, Valente LP, Mata JF, Black BE, Jansen LE. (2013). Assembly in G1 phase and long-term stability are unique intrinsic features of CENP-A nucleosomes. Mol Biol Cell , 923–932. - PMC - PubMed
    1. Boeckmann L, Takahashi Y, Au WC, Mishra PK, Choy JS, Dawson AR, Szeto MY, Waybright TJ, Heger C, Mcandrew C, et al. (2013). Phosphorylation of centromeric histone H3 variant regulates chromosome segregation in Saccharomyces cerevisiae. Mol Biol Cell , 2034–2044. - PMC - PubMed
    1. Booth DG, Cheeseman LP, Prior IA, Royle SJ. (2013). Studying kinetochore-fiber ultrastructure using correlative light-electron microscopy. Methods Cell Biol , 327–342. - PMC - PubMed

Publication types

Substances

LinkOut - more resources