. 2019 May 15;30(11):1298-1313.
doi: 10.1091/mbc.E18-10-0629. Epub 2019 Mar 20.

Hic-5 regulates Src-induced invadopodia rosette formation and organization

Affiliations

Hic-5 regulates Src-induced invadopodia rosette formation and organization

Anushree C Gulvady et al. Mol Biol Cell. .

Abstract

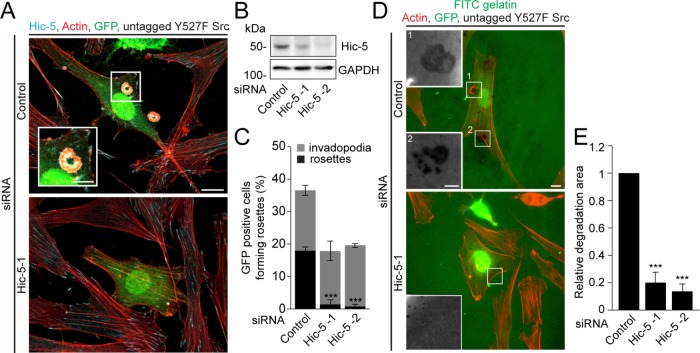
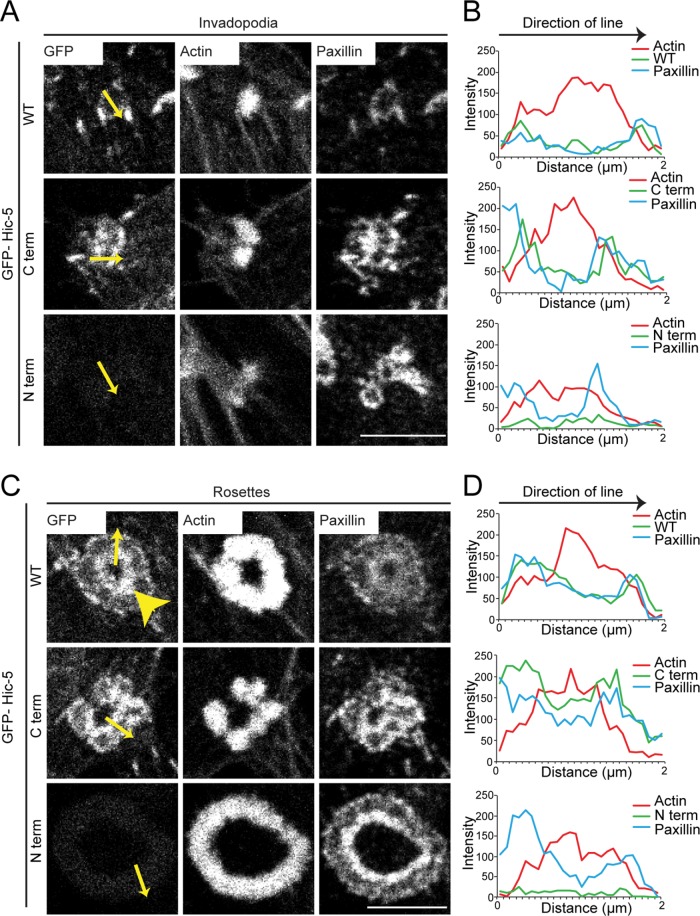
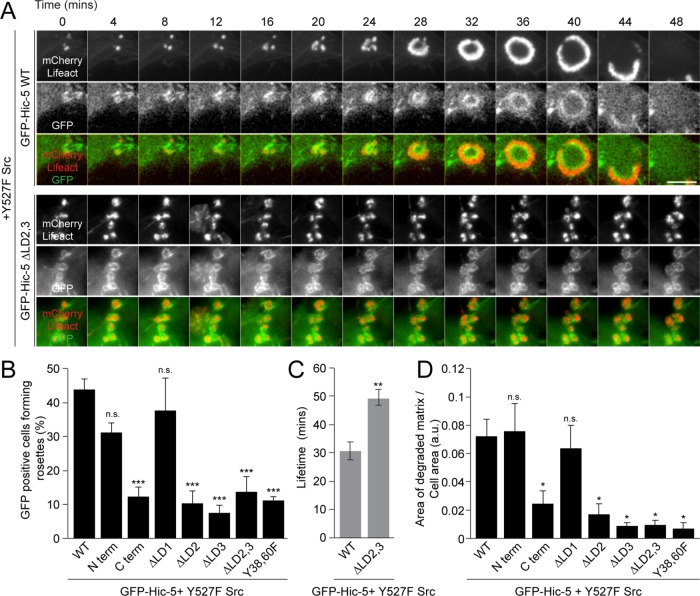
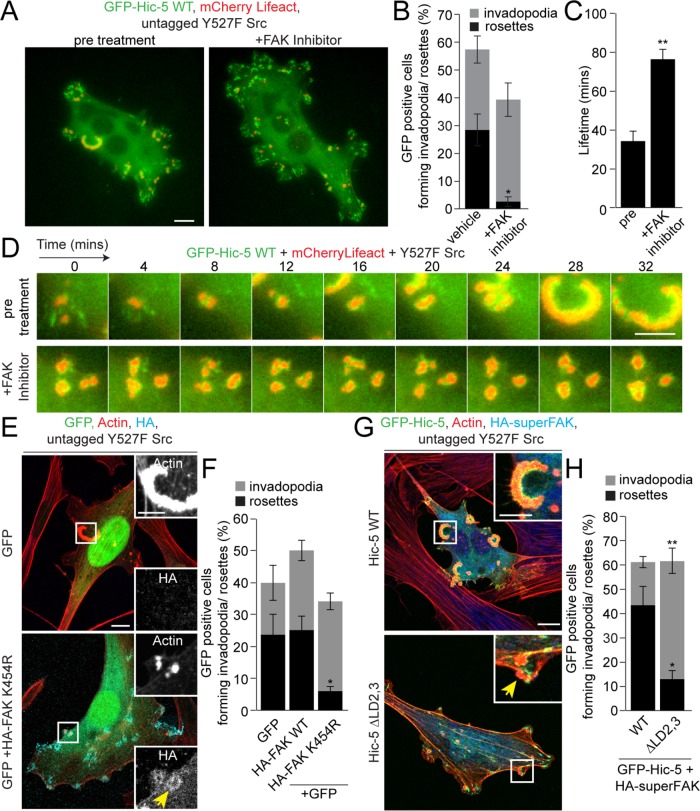
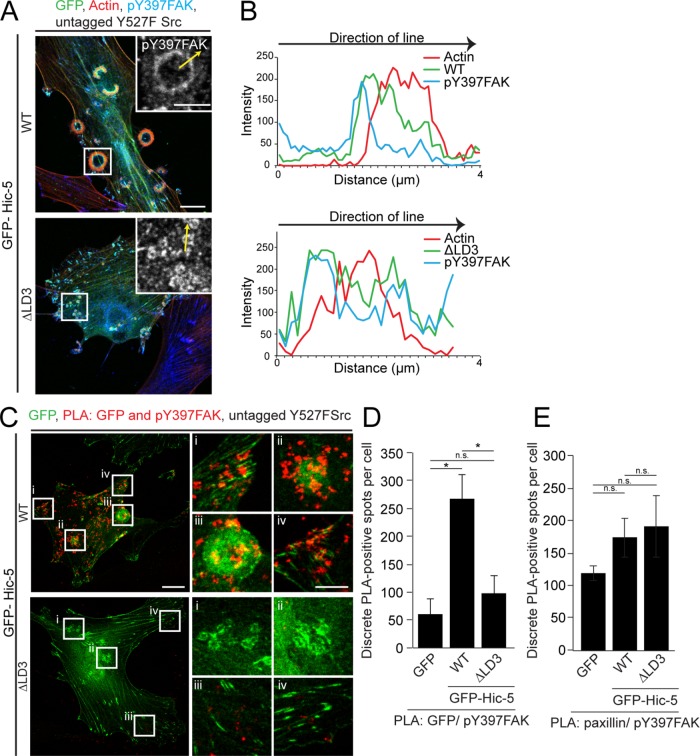
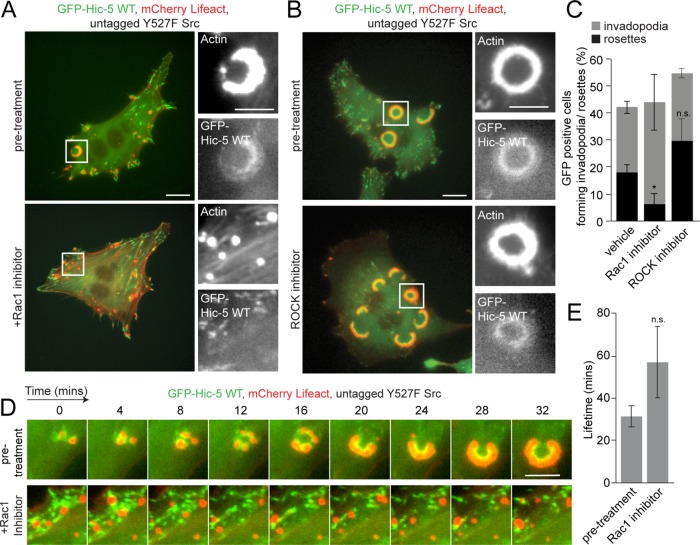
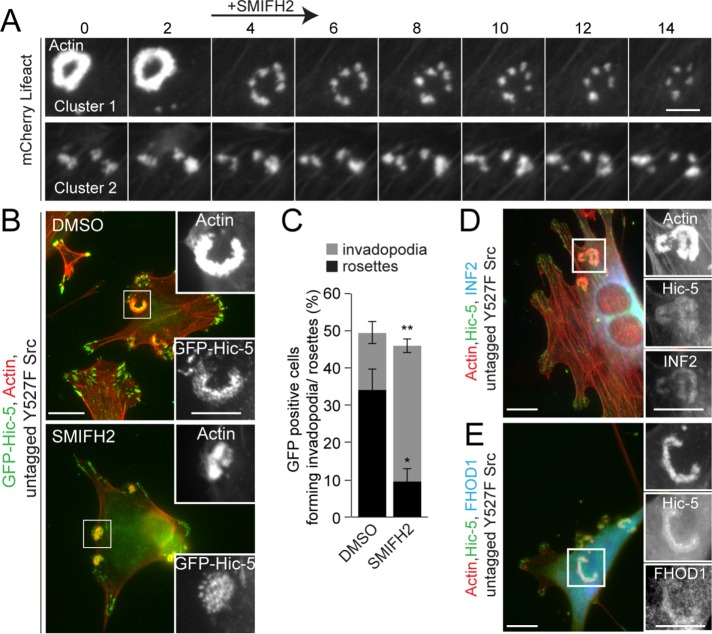
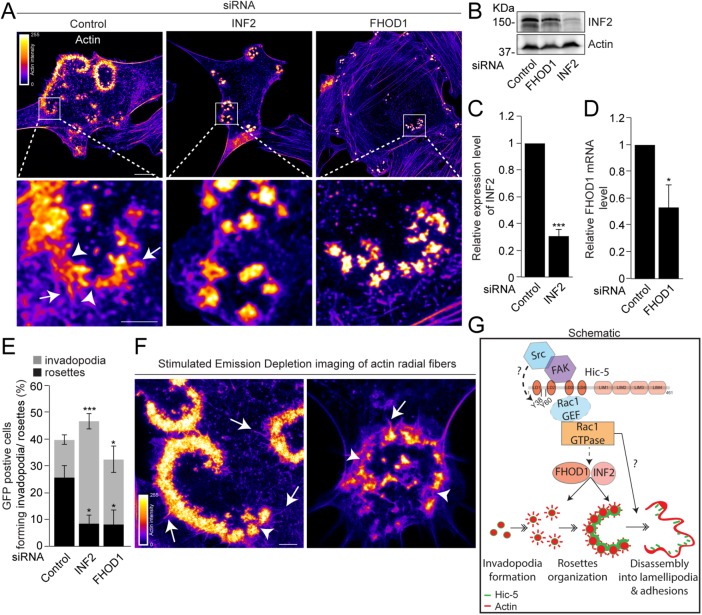
Fibroblasts transformed by the proto-oncogene Src form individual invadopodia that can spontaneously self-organize into large matrix-degrading superstructures called rosettes. However, the mechanisms by which the invadopodia can spatiotemporally reorganize their architecture is not well understood. Here, we show that Hic-5, a close relative of the scaffold protein paxillin, is essential for the formation and organization of rosettes in active Src-transfected NIH3T3 fibroblasts and cancer-associated fibroblasts. Live cell imaging, combined with domain-mapping analysis of Hic-5, identified critical motifs as well as phosphorylation sites that are required for the formation and dynamics of rosettes. Using pharmacological inhibition and mutant expression, we show that FAK kinase activity, along with its proximity to and potential interaction with the LD2,3 motifs of Hic-5, is necessary for rosette formation. Invadopodia dynamics and their coalescence into rosettes were also dependent on Rac1, formin, and myosin II activity. Superresolution microscopy revealed the presence of formin FHOD1 and INF2-mediated unbranched radial F-actin fibers emanating from invadopodia and rosettes, which may facilitate rosette formation. Collectively, our data highlight a novel role for Hic-5 in orchestrating the organization of invadopodia into higher-order rosettes, which may promote the localized matrix degradation necessary for tumor cell invasion.


Figures

FIGURE 1:
FIGURE 1:
Hic-5 is required for formation of rosettes in active Src-transfected NIH3T3 fibroblasts. (A) Representative images of active Src (Y527F mutant)-transfected NIH3T3 fibroblasts after RNAi-mediated knockdown of Hic-5, expressing GFP vector. Scale bar = 10 μm. Inset shows presence of rosettes in the control. Scale bar = 5 μm. (B) Western blot of cell lysates after RNAi-mediated knockdown of Hic-5 using two independent siRNAs in the Y527F Src-transfected NIH3T3 fibroblasts. (C) Quantitation of GFP-positive cells forming either rosettes or invadopodia (n = at least 135 cells). (D) Representative images of cells after RNAi-mediated knockdown of Hic-5, expressing GFP vector and plated on FITC-gelatin matrix. Scale bar = 10 μm. Insets show dark areas of FITC-gelatin degradation. Scale bar = 5 μm. (E) Quantitation of the area of FITC-gelatin degradation per cell area (n = at least 40 cells). Data represent mean ± SEM of at least three independent experiments. A one-way ANOVA with Dunnett’s multiple comparison test was performed. ***p < 0.001.
FIGURE 2:
FIGURE 2:
Hic-5 localizes to invadopodia and rosettes via the C-terminal LIM domains. Representative images of (A) invadopodia and (C) rosettes formed by active Src-transfected NIH3T3 fibroblasts expressing GFP-Hic-5 WT, C-terminus, or the N-terminus of Hic-5. Scale bar = 5 μm. Line profiles drawn across (B) invadopodia and (D) rosettes show intensities of actin, GFP-Hic-5, and paxillin. Yellow arrows indicate directions of lines drawn for line profiles. Yellow arrowhead indicates an enrichment of Hic-5 at the center of the rosette.
FIGURE 3:
FIGURE 3:
The Hic-5 N-terminal LD2 and LD3 motifs, as well as the Y38,60 phosphorylation sites, are required for rosette formation. (A) Time-lapse images of rosette formation in Y527F Src-transfected NIH3T3 fibroblasts expressing mCherry-Lifeact along with GFP-Hic-5 WT or ΔLD2,3 deletion mutant. Scale bar = 5 μm. (B) Quantitation of rosette formation in cells expressing GFP-Hic-5 WT, Hic-5 N-terminus, or C-terminus or ΔLD1, ΔLD2, ΔLD3, ΔLD2,3, or Y38,60F mutants of Hic-5 (n = at least 90 cells). A one-way ANOVA with Dunnett’s multiple comparison test was performed. (C) Quantitation of the lifetime of rosettes or invadopodia clusters in cells expressing either GFP-Hic-5 WT or ΔLD2,3 mutant (n = at least 15 cells). An unpaired Student’s t test was performed. (D) Quantitation of the area of matrix degraded per cell area, by cells expressing GFP-Hic-5 WT, Hic-5 N-terminus, or C-terminus or ΔLD1, ΔLD2, ΔLD3, ΔLD2,3, or Y38,60F mutants of Hic-5 (n = at least 40 cells). A one-way ANOVA with Dunnett’s multiple comparison test was performed. Data represent mean ± SEM of at least three independent experiments. *p < 0.05, **p < 0.01, and ***p < 0.001.
FIGURE 4:
FIGURE 4:
The kinase activity of FAK upstream of Hic-5 is required for rosette formation. (A) Representative images of Y527F Src-transfected NIH3T3 fibroblasts expressing GFP-Hic-5 WT and mCherry-Lifeact before and after treatment with the FAK inhibitor PF-573228 (10 μM). Scale bar = 10 μm. (B) Quantitation of cells forming either invadopodia or rosettes after treatment with either vehicle or FAK inhibitor PF-573228 (10 μM) (n = at least 90 cells). (C) Quantitation of the lifetime of rosettes or invadopodia clusters before and after FAK inhibition (n = at least 11 cells). An unpaired Student’s t test was performed. (D) Time-lapse images of cells before and after the addition of the FAK inhibitor. Scale bar = 5 μm. (E) Representative images of cells expressing GFP vector or HA-K454R FAK (kinase dead) along with GFP vector and untagged Y527F Src. Scale bar = 10 μm. Insets show actin and HA-FAK staining of the rosettes and invadopodia (yellow arrow). Scale bar = 5 μm. (F) Quantitation of cells forming either individual invadopodia or rosettes (n = at least 85 cells). A one-way ANOVA with Dunnett’s multiple comparison test was performed. (G) Representative images of cells expressing GFP-Hic-5 WT or ΔLD2,3 mutant along with HA-superFAK. Scale bar = 10 μm. Insets show higher magnification of invadopodia or rosette (yellow arrow). Scale bar = 5 μm. (H) Quantitation of cells expressing HA-superFAK along with either GFP-Hic-5 WT or ΔLD2,3 mutant and forming either invadopodia or rosettes (n = at least 90 cells). An unpaired Student’s t test was performed. Data represent mean ± SEM of at least three independent experiments. *p < 0.05 and **p < 0.01.
FIGURE 5:
FIGURE 5:
Proximity and potential interaction of FAK with Hic-5 LD3 motif is required for rosette formation. (A) Representative images of Y527F Src-transfected NIH3T3 fibroblasts expressing GFP-Hic-5 WT or ΔLD3 mutant stained for pY397FAK. Scale bar = 10 μm. Insets show pY397FAK staining at the rosette and invadopodia. Scale bar = 5 μm. Yellow arrows indicate the directions of the line profiles drawn. (B) Line profiles drawn across the corresponding rosette and an invadopodium show localization of actin, GFP-Hic-5 WT, or ΔLD3 with respect to pY397FAK. (C) Representative images of PLA-positive spots between GFP and pY397FAK in cells expressing GFP-Hic-5 WT or GFP-Hic-5 ΔLD3 mutant. Scale bar = 10 μm. Insets show higher magnification of adhesions, invadopodia, and rosettes. Scale bar = 5 μm. (D) Quantitation of the number of discrete PLA-positive spots between GFP and pY397FAK, seen in GFP control, GFP-Hic-5 WT, or GFP-Hic-5 ΔLD3 mutant expressing cells (n = at least 15 cells). (E) Quantitation of the number of discrete PLA-positive spots between paxillin and pY397FAK, seen in GFP control, GFP-Hic-5 WT, or GFP-Hic-5 ΔLD3 mutant–expressing cells (n = at least 18 cells). Data represent mean ± SEM of at least three independent experiments. A one-way ANOVA with Tukey’s multiple comparison test was performed. *p < 0.05.
FIGURE 6:
FIGURE 6:
Rac1 but not ROCK-dependent RhoA activity is required for rosette organization. (A) Representative images of Y527F Src-transfected fibroblasts expressing GFP-Hic-5 WT along with mCherry-Lifeact, before and after treatment with the Rac1 inhibitor, NSC23766 (100 μM). Scale bar = 10 μm. Insets show higher magnification of the mCherry-Lifeact and GFP-Hic-5 WT-rich invadopodia and rosettes. Scale bar = 5 μm. (B) Representative images of Y527F Src-transfected fibroblasts expressing GFP-Hic-5 WT along with mCherry-Lifeact, before and after treatment with the ROCK inhibitor Y-27632 (10 μM). Scale bar = 10 μm. Insets show higher magnification of the mCherry-Lifeact and GFP-Hic-5 WT-rich rosettes. Scale bar = 5 μm. (C) Quantitation of cells forming either invadopodia or rosettes after Rac1 or ROCK inhibitor treatment (n = at least 90 cells). A one-way ANOVA with a Dunnett’s multiple comparison test was performed. (D) Time-lapse imaging before and after Rac1 inhibitor treatment. Scale bar = 5 μm. (E) Quantitation of the lifetime of rosettes or invadopodia clusters before and after Rac1 inhibition. An unpaired Student’s t test was performed. Data represent mean ± SEM of at least three independent experiments. *p < 0.05.
FIGURE 7:
FIGURE 7:
Formin activity is required for the coalescence of invadopodia into rosettes. (A) Time-lapse imaging of Y527F Src-transfected cells expressing mCherry-Lifeact treated with a pan-formin inhibitor, SMIFH2 (5 μM). Scale bar = 5 μm. (B) Representative images of cells expressing GFP-Hic-5 WT treated with either DMSO or the formin inhibitor SMIFH2. Scale bar = 10 μm. Insets show higher-magnification images of GFP-Hic-5 and actin staining. Scale bar = 5 μm. (C) Quantitation of cells forming either invadopodia or rosettes before and after treatment with the formin inhibitor (n = at least 90 cells). An unpaired Student’s t test was performed. Representative images of actin, Hic-5, and formins (D) INF2 or (E) FHOD1 staining of the rosettes. Scale bar = 10 μm. Insets show individual channels of actin, Hic-5, and formins INF2 or FHOD1. Scale bar = 5 μm. Data represent mean ± SEM of at least three independent experiments. *p < 0.05 and **p < 0.01.
FIGURE 8:
FIGURE 8:
FHOD1- and INF2-mediated radial actin polymerization is necessary for coalescence of invadopodia clusters into rosettes. (A) Representative actin- stained, deconvolved, confocal images of Y527F Src-transfected NIH3T3 fibroblasts after RNAi-mediated knockdown of the formins INF2 or FHOD1. Pseudocolored look-up table (LUT) highlights changes in the actin intensity. Scale bar = 10 μm. Insets show presence of F-actin-labeled rosettes in the control and clusters of invadopodia in cells deficient in INF2 or FHOD1 expression. Scale bar = 2.5 μm. White arrows point to radial actin fibers emanating outward from the rosettes. White arrowheads point to radial actin fibers seen within rosettes. (B) Western blot of cell lysates after RNAi-mediated knockdown of INF2. (C) Quantitation of the relative expression of INF2 after RNAi-mediated knockdown of INF2 by Western blot. (D) Quantitation of the mRNA levels of FHOD1 after RNAi-mediated knockdown of FHOD1 as measured by qPCR. An unpaired Student’s t test was performed. (E) Quantitation of the GFP-positive cells forming either invadopodia or rosettes after RNAi-mediated knockdown (n = at least 90 cells). A one-way ANOVA with a Dunnett’s multiple comparison test was performed. (F) Stimulated emission depletion (STED) imaging of F-actin-stained rosettes formed by GFP-Hic-5 WT and Y527F Src-transfected cells. Pseudocolored look-up table (LUT) highlights changes in actin intensity. White arrows point to radial actin fibers emanating outward from the rosettes. White arrowheads point to radial actin fibers seen within the rosettes. Scale bar = 2.5 μm. Data represent mean ± SEM of at least three independent experiments. *p < 0.05 and ***p < 0.001. (G) Schematic depicting putative model for Hic-5 regulation of rosette formation. Hic-5 interaction with or close proximity to the active FAK-Src complex requiring the Hic-5 LD3 motif is associated with phosphorylation of Hic-5 at Y38,60 sites. Hic-5–dependent stimulation of Rac1 activity, potentially through recruitment of a Rac1GEF to the LD3 motif of Hic-5, along with Rac1-activated FHOD1 and INF2-mediated radial actin polymerization potentially regulates the fusion of invadopodia clusters into rosettes. Rac1 also drives rosette disassembly, which is coordinated with localized lamellipodia extension and potentially directed invasive migration.

Similar articles

Cited by

References

    1. Alvarez DE, Agaisse H. (2013). The formin FHOD1 and the small GTPase Rac1 promote vaccinia virus actin-based motility. J Cell Biol , 1075–1090. - PMC - PubMed
    1. Artym VV, Zhang Y, Seillier-Moiseiwitsch F, Yamada KM, Mueller SC. (2006). Dynamic interactions of cortactin and membrane type 1 matrix metalloproteinase at invadopodia: defining the stages of invadopodia formation and function. Cancer Res , 3034–3043. - PubMed
    1. Badowski C, Pawlak G, Grichine A, Chabadel A, Oddou C, Jurdic P, Pfaff M, Albiges-Rizo C, Block MR. (2008). Paxillin phosphorylation controls invadopodia/podosomes spatiotemporal organization. Mol Biol Cell , 633–645. - PMC - PubMed
    1. Bellis SL, Miller JT, Turner CE. (1995). Characterization of tyrosine phosphorylation of paxillin in vitro by focal adhesion kinase. J Biol Chem , 17437–17441. - PubMed
    1. Bergman A, Condeelis JS, Gligorijevic B. (2014). Invadopodia in context. Cell Adh Migr , 273–279. - PMC - PubMed

Publication types

MeSH terms