. 2019 Mar 20;15(3):e1007810.
doi: 10.1371/journal.pgen.1007810. eCollection 2019 Mar.

Dynamic transcriptome profiles within spermatogonial and spermatocyte populations during postnatal testis maturation revealed by single-cell sequencing

Affiliations

Dynamic transcriptome profiles within spermatogonial and spermatocyte populations during postnatal testis maturation revealed by single-cell sequencing

Kathryn J Grive et al. PLoS Genet. .

Abstract

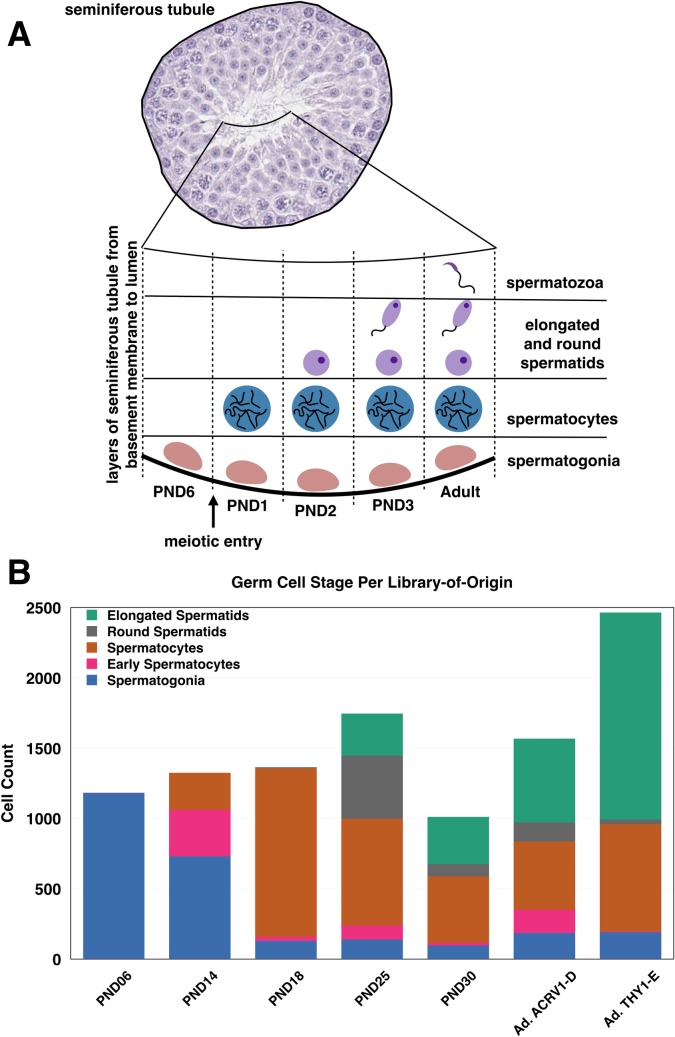
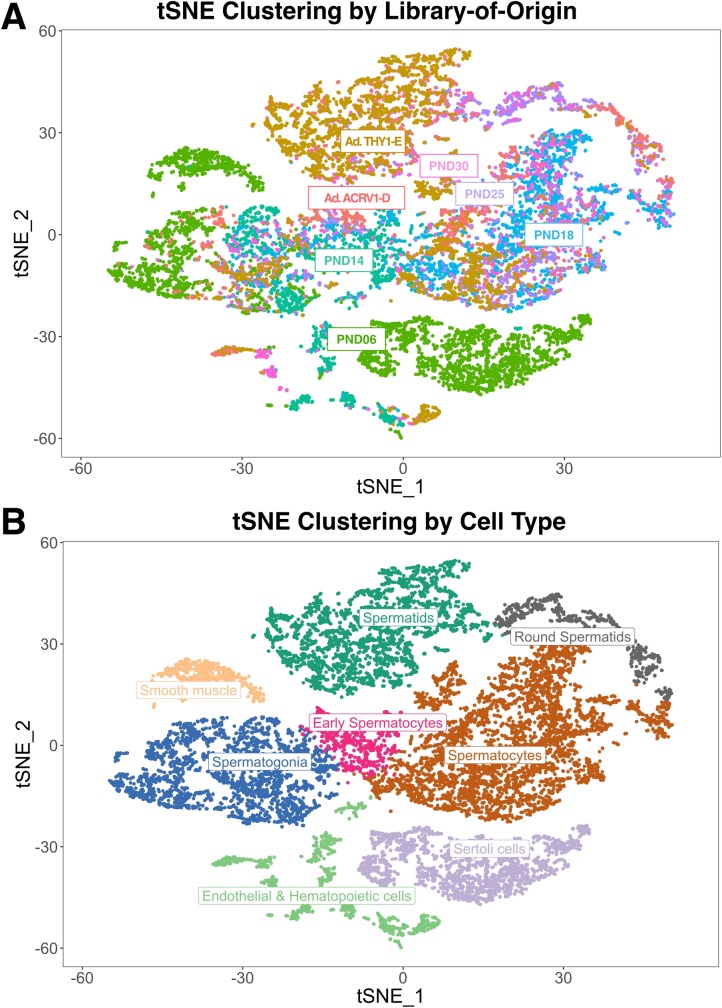
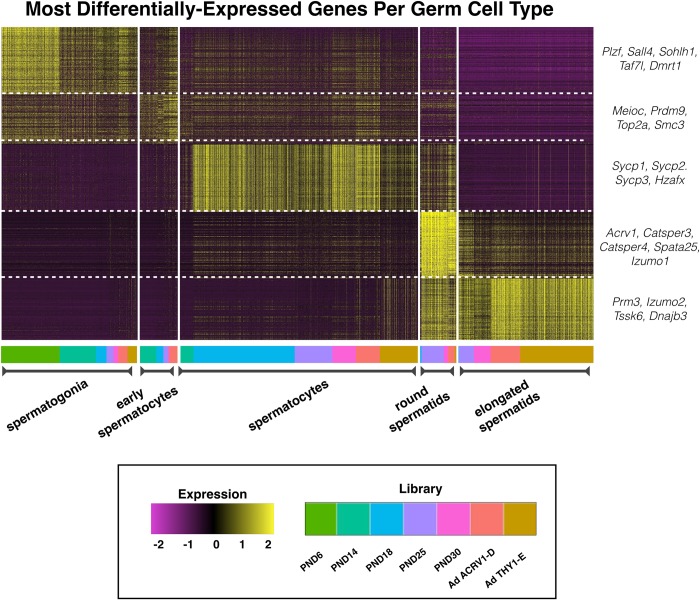
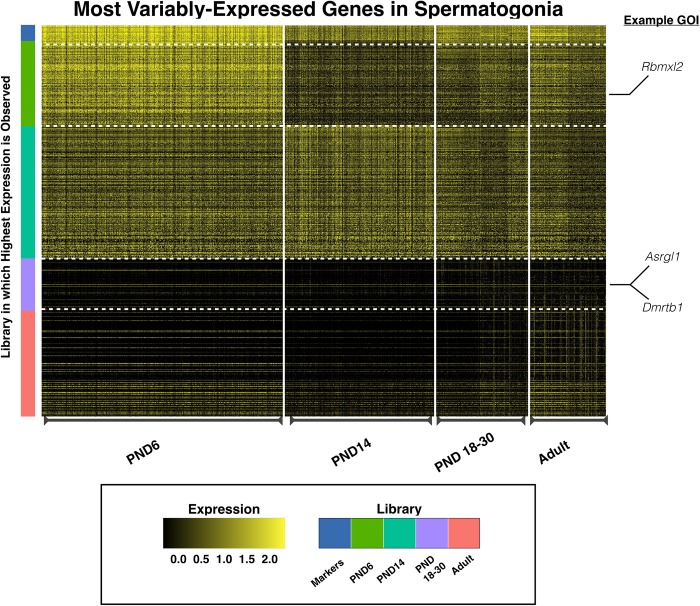
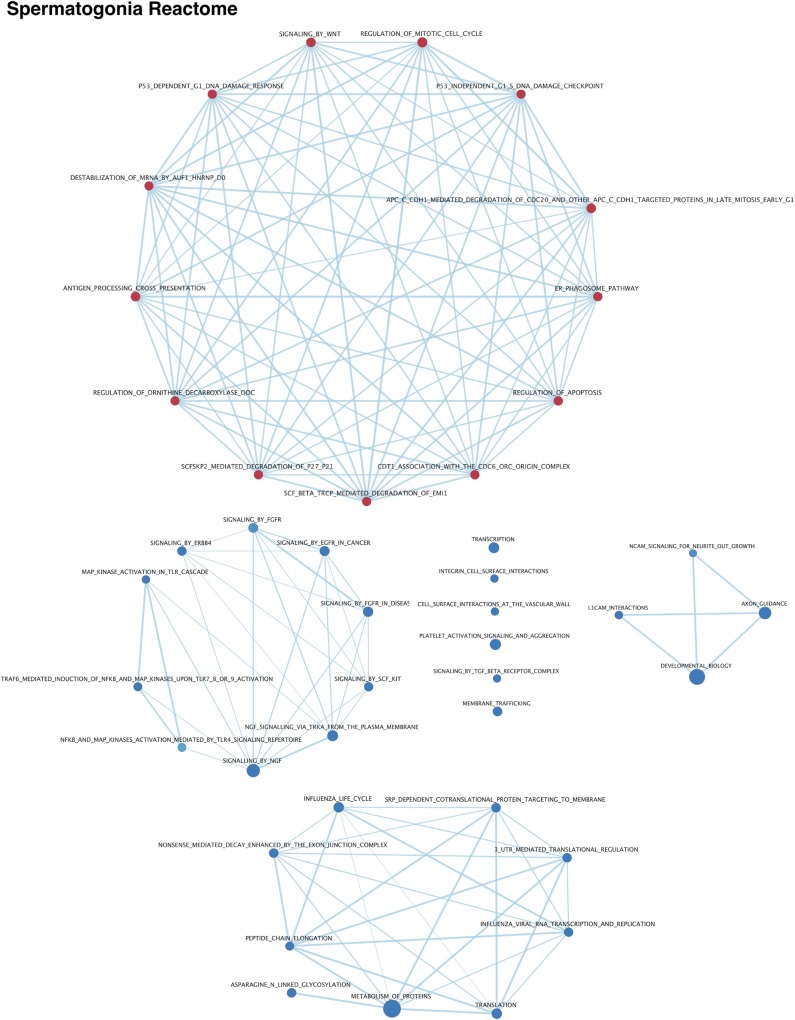
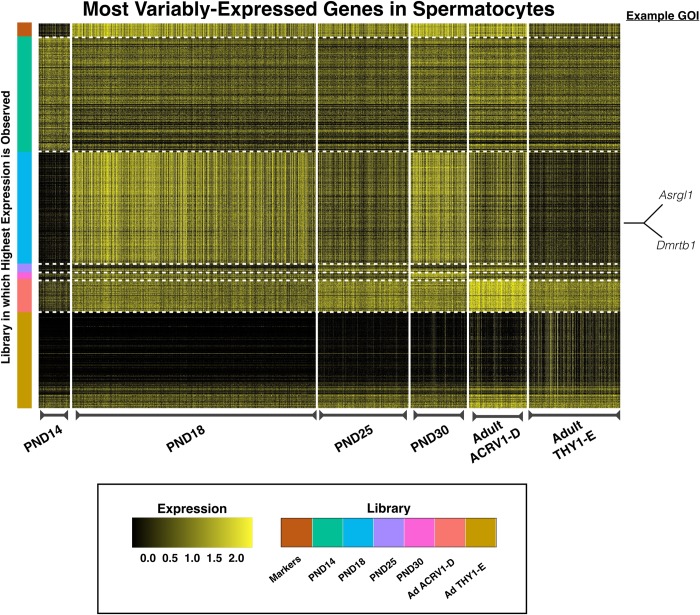
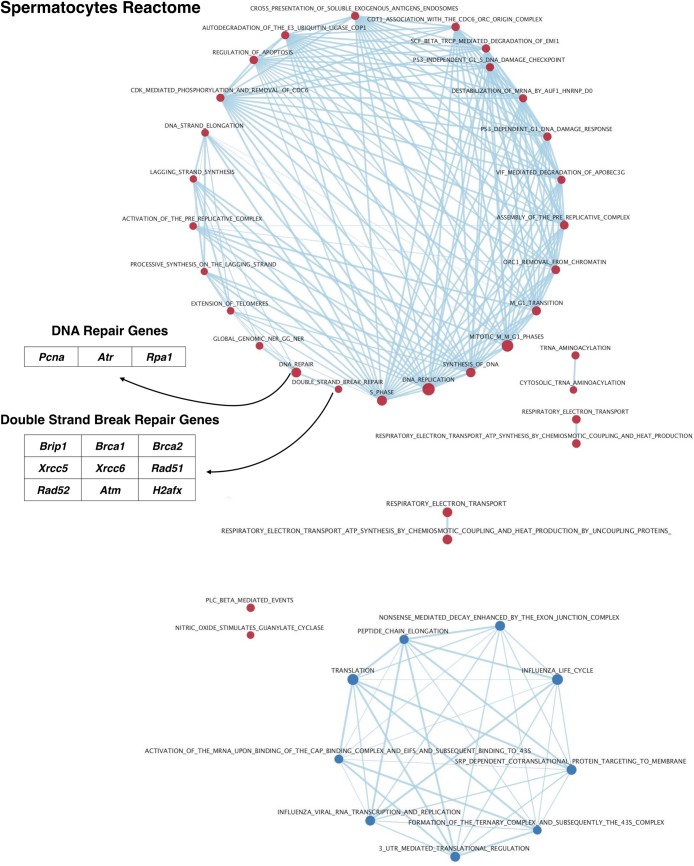
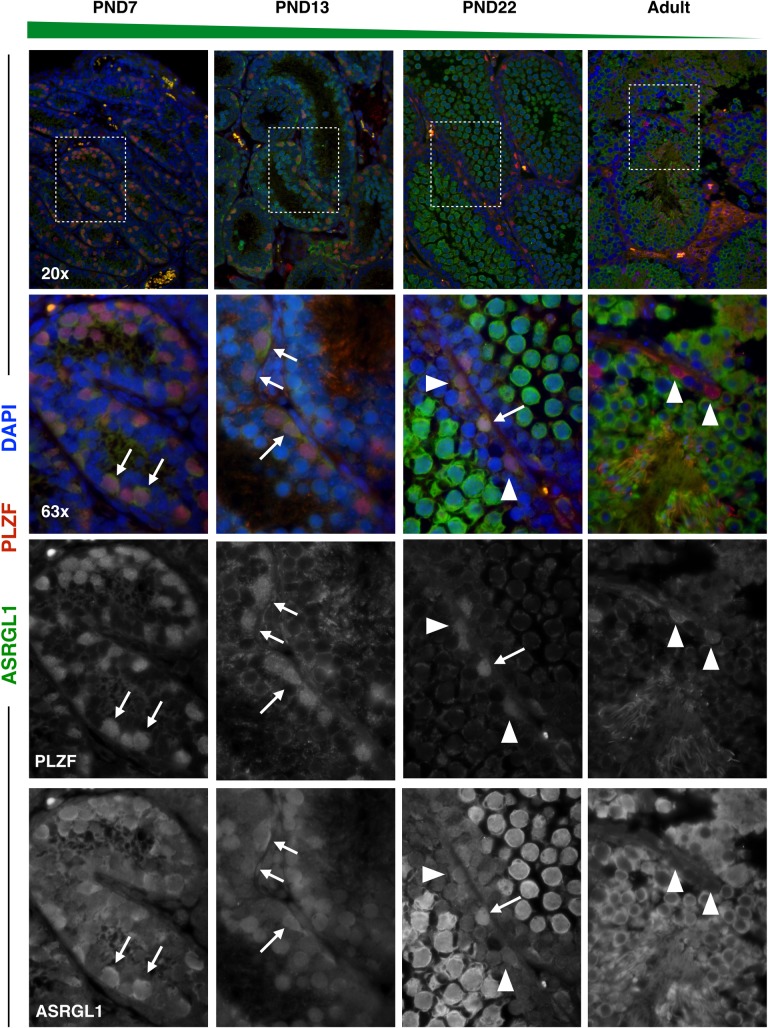
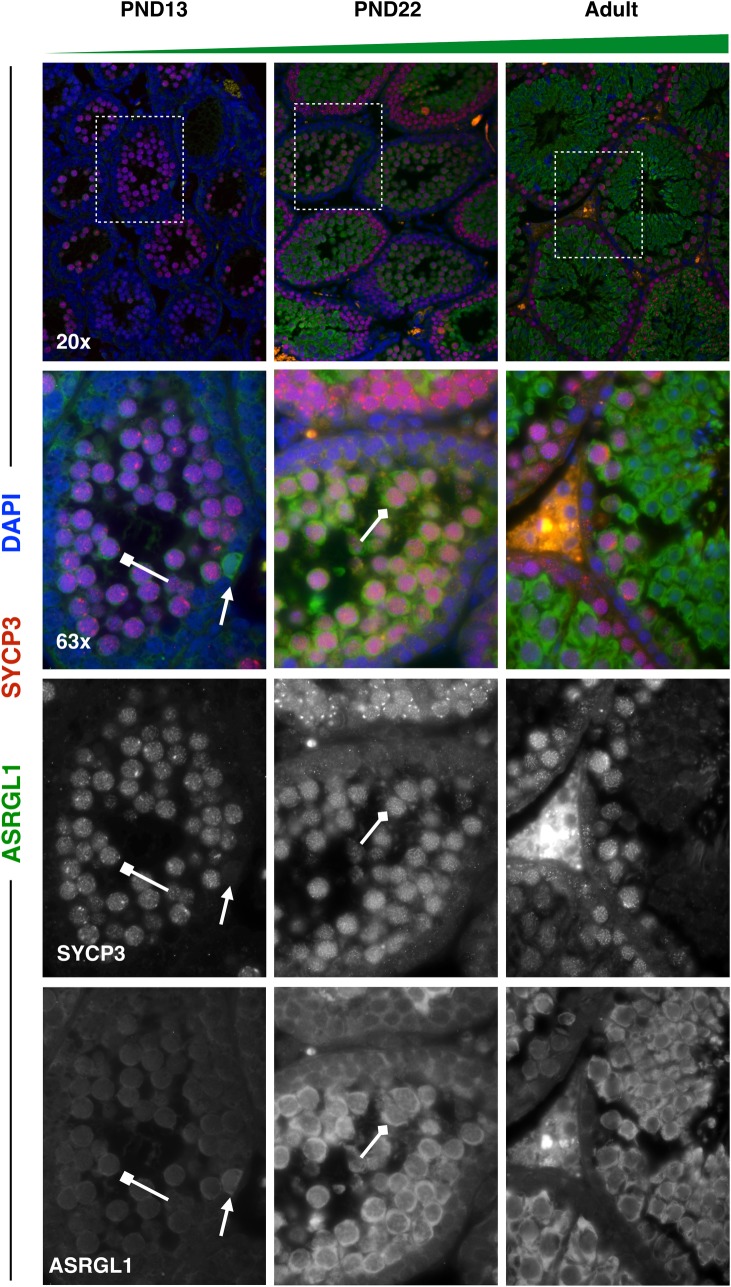
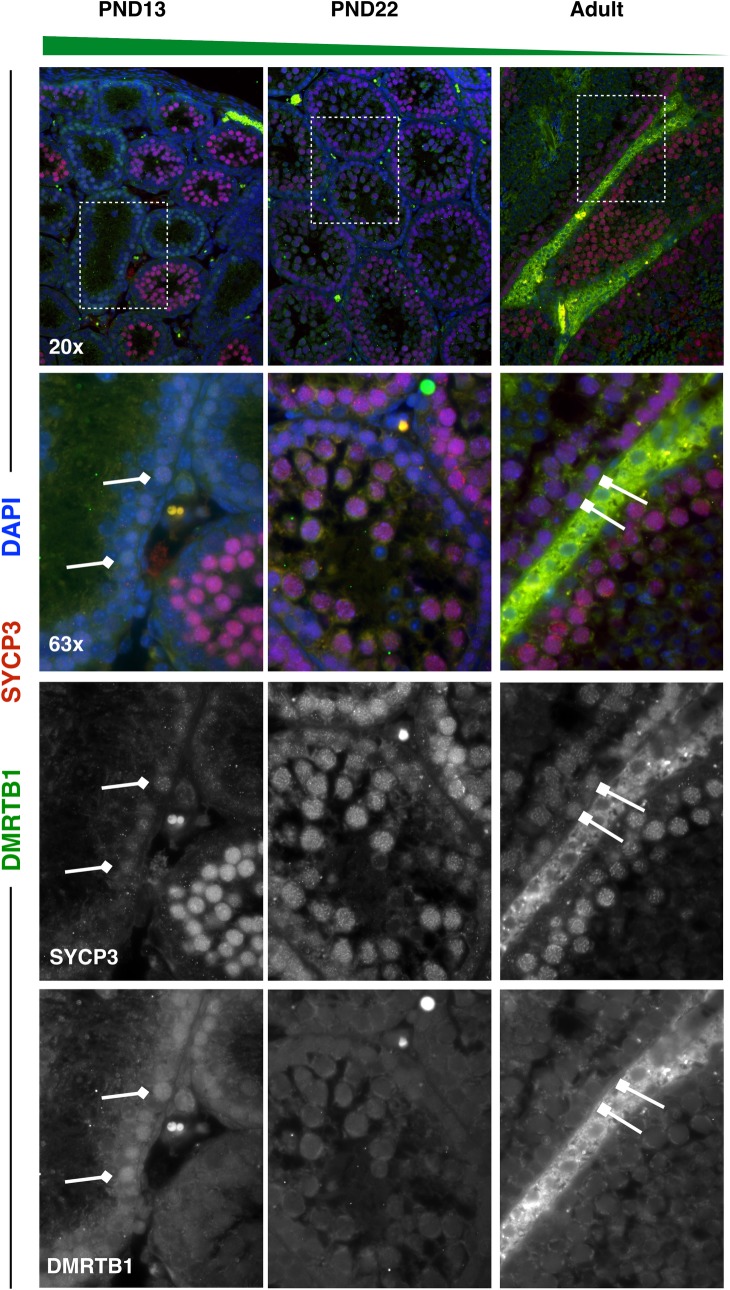
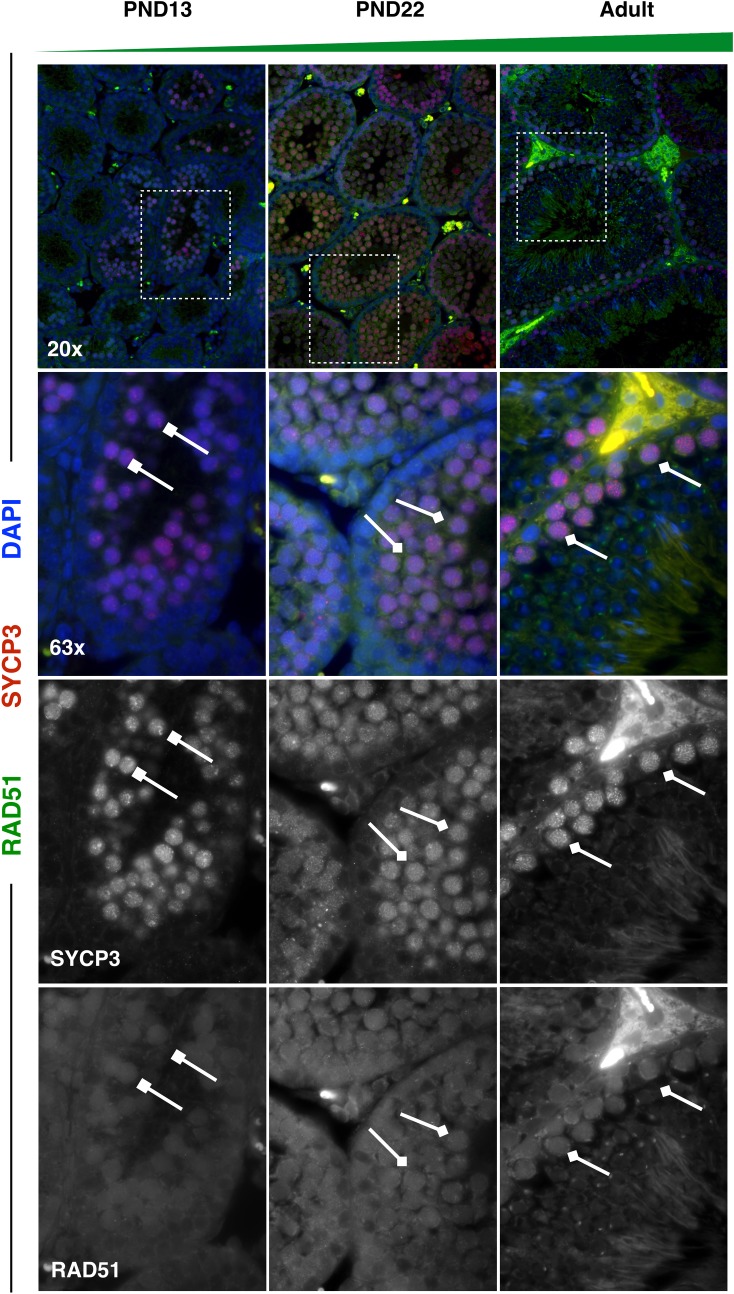
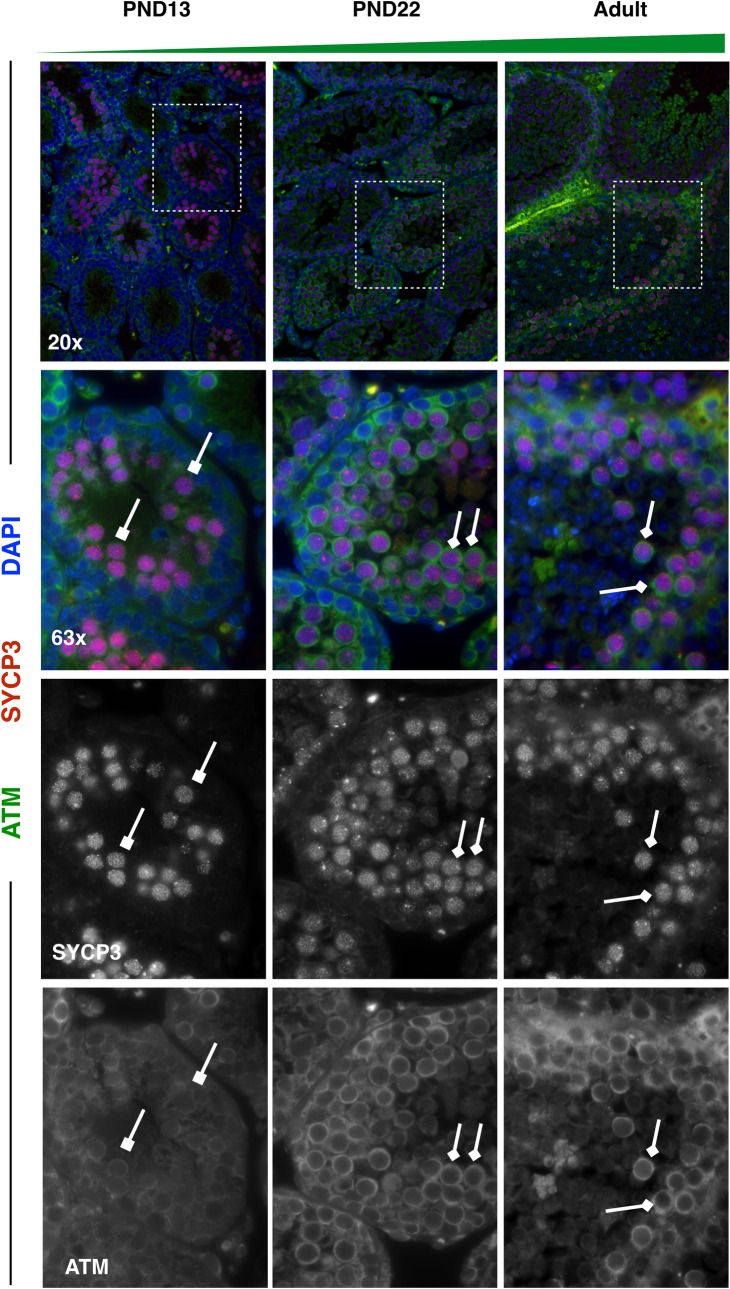
Spermatogenesis is the process by which male gametes are formed from a self-renewing population of spermatogonial stem cells (SSCs) residing in the testis. SSCs represent less than 1% of the total testicular cell population in adults, but must achieve a stable balance between self-renewal and differentiation. Once differentiation has occurred, the newly formed and highly proliferative spermatogonia must then enter the meiotic program in which DNA content is doubled, then halved twice to create haploid gametes. While much is known about the critical cellular processes that take place during the specialized cell division that is meiosis, much less is known about how the spermatocytes in the "first-wave" in juveniles compare to those that contribute to long-term, "steady-state" spermatogenesis in adults. Given the strictly-defined developmental process of spermatogenesis, this study explored the transcriptional profiles of developmental cell stages during testis maturation. Using a combination of comprehensive germ cell sampling with high-resolution, single-cell-mRNA-sequencing, we have generated a reference dataset of germ cell gene expression. We show that discrete developmental stages of spermatogenesis possess significant differences in the transcriptional profiles from neonates compared to juveniles and adults. Importantly, these gene expression dynamics are also reflected at the protein level in their respective cell types. We also show differential utilization of many biological pathways with age in both spermatogonia and spermatocytes, demonstrating significantly different underlying gene regulatory programs in these cell types over the course of testis development and spermatogenic waves. This dataset represents the first unbiased sampling of spermatogonia and spermatocytes during testis maturation, at high-resolution, single-cell depth. Not only does this analysis reveal previously unknown transcriptional dynamics of a highly transitional cell population, it has also begun to reveal critical differences in biological pathway utilization in developing spermatogonia and spermatocytes, including response to DNA damage and double-strand breaks.


Conflict of interest statement

The authors have declared that no competing interests exist.

Figures

Fig 1
Fig 1. Germ cells profiled in single-cell sequencing analysis are representative of known biology of the developing testis.
A) Schematic of the developing testis with germ cell representation at each time point. Only spermatogonia are present during the first week of life, until meiotic entry at PND10, after which germ cells can commit meiosis and progress through spermatogenesis and spermiogenesis, producing the first mature spermatozoa from the first wave around PND30. B) Germ cell composition by proportion and absolute cell number from each library-of-origin. “Ad” indicates adult libraries, ACRV1-D indicates ACRV1+ depletion. and THY1-E indicates THY1+ enrichment.
Fig 2
Fig 2. Clustering of single-cell data into libraries-of-origin and cell type classifications.
A) tSNE representation of all cells with >500 detected genes and >2,000 UMI (unique molecular identifier) counts, color-coded by library-of-origin. “Ad” indicates adult libraries, ACRV1-D indicates ACRV1+ depletion, and THY1-E indicates THY1+ enrichment. B) tSNE representation of all cells with >500 detected genes and >2000 UMIs, color-coded by cell type classification.
Fig 3
Fig 3. Marker gene heatmap of all germ cell types reveals characteristic signatures.
Heatmap of most-differentially-expressed marker genes per germ cell type. Color bar at the bottom indicates library-of-origin time point for cells within each block. Expression is represented as a z-score ranging from -2 to 2. Notable marker genes for each germ cell type are highlighted to the right of the heatmap. “Ad” indicates adult libraries, ACRV1-D indicates ACRV1+ depletion, and THY1-E indicates THY1+ enrichment.
Fig 4
Fig 4. Analysis of variably-expressed genes in spermatogonia.
MAST analysis was used to determine genes variably expressed with age specifically in spermatogonia, represented in a heatmap. All genes represented in the heatmap and listed in S4 Table are differentially expressed with the exception of the marker genes [at the top] which remain consistently expressed. PND18-30 time points have been merged to increase representation of this rare cell type at those time points. Similarly, adult time points have also been merged. Individual cells are plotted along the x-axis and the library of origin is indicated at the bottom of the heatmap. Individual genes are plotted on the y-axis and the color bar at the left indicates library-of-origin from which highest expression is observed. Expression is scaled, ranging from 0 to 2.5.
Fig 5
Fig 5. Differential Reactome pathway utilization in spermatogonia with age.
Gene set enrichment analysis of variably-expressed genes in the Reactome database was visualized in Cytoscape. Results were filtered on a false discovery rate <0.05, and a gene set list >45 genes. Red nodes indicate pathways upregulated with testis age while blue nodes indicate pathways down-regulated with testis age. Edges indicate connections and overlap between pathways.
Fig 6
Fig 6. Analysis of variably-expressed genes in spermatocytes.
MAST analysis was used to determine genes which are variably expressed with age specifically in spermatocytes, represented in a heatmap. All genes represented in the heatmap and listed in S6 Table are differentially expressed with the exception of the marker genes [at the top] which remain consistently expressed. Individual cells are plotted along the x-axis and the library of origin is indicated at the bottom of the heatmap. Individual genes are plotted on the y-axis and the color bar at the left indicates library-of-origin from which highest expression is observed. Expression is scaled, ranging from 0 to 2.5. “Ad” indicates adult libraries, with ACRV1-D indicating ACRV1+ depletion, while THY1-E indicates THY1+ enrichment.
Fig 7
Fig 7. Differential Reactome pathway utilization in spermatocytes with age.
Gene set enrichment analysis of variably-expressed genes in the Reactome database was visualized in Cytoscape. Results were filtered on a false discovery rate <0.05, and a gene set list >15 genes. Red nodes indicate pathways upregulated with time while blue nodes indicate pathways down-regulated with time. Edges indicate connections and overlap between pathways. The tables to the left of the diagrams identify notable genes represented in these pathways.
Fig 8
Fig 8. ASRGL1 is highly expressed specifically in spermatogonia from neonatal and juvenile mice.
Spermatogonial marker PLZF (red) and ASRGL1 (green) were stained in 5μm testis tissue sections from mice ages PND7, PND13, PND22, and adult. DAPI (blue) denotes nuclei. ASRGL1 protein expression decreases in PLZF+ spermatogonia with age. For all images, high-ASRGL1-expressing spermatogonia are indicated by full arrows with a line, while low-ASRGL1-expressing spermatogonia are indicated by arrowheads.
Fig 9
Fig 9. ASRGL1 is highly expressed specifically in spermatocytes of older mice.
Spermatocyte marker SYCP3 (red) and ASRGL1 (green) were stained in 5μm testis tissue sections from mice ages PND13, PND22, and adult. ASRGL1 protein expression increases in SYCP3+ spermatocytes with age. For all images, high-ASRGL1-expressing spermatogonia are indicated by full arrows with a line. High-ASRGL1-expressing spermatocytes are indicated by diamond-headed arrows, while low-ASRGL1-expressing spermatocytes are indicated by square-headed arrows.
Fig 10
Fig 10. DMRTB1 is highly expressed specifically in first-wave spermatocytes from juvenile mice.
Spermatocyte marker SYCP3 (red) and DMRTB1 (green) were stained in 5μm testis tissue sections from mice ages PND13, PND22, and adult. DMRTB1 protein is expressed in the nucleus of first-wave spermatocytes at PND13, with decreasing expression in pachytene spermatocytes with age. For all images, high-DMRTB1-expressing spermatocytes are indicated by diamond-headed arrows, while low-DMRTB1-expressing spermatocytes are indicated by square-headed arrows.
Fig 11
Fig 11. RAD51 has overall reduced protein expression in first-wave spermatocytes from juvenile mice.
Spermatocyte marker SYCP3 (red) and RAD51 (green) were stained in 5μm testis tissue sections from mice ages PND13, PND22, and adult. RAD51 protein expression increases in SYCP3+ spermatocytes with age. For all images, high-RAD51-expressing spermatocytes are indicated by diamond-headed arrows, while low-RAD51-expressing spermatocytes are indicated by square-headed arrows.
Fig 12
Fig 12. ATM has reduced protein expression in first-wave spermatocytes from juvenile mice.
Spermatocyte marker SYCP3 (red) and ATM (green) were stained in 5μm testis tissue sections from mice ages PND13, PND22, and adult. ATM protein expression increases in SYCP3+ spermatocytes with age. For all images, high-ATM-expressing spermatocytes are indicated by diamond-headed arrows, while low-ATM-expressing spermatocytes are indicated by square-headed arrows.
Fig 13
Fig 13. First-wave spermatocytes have persistent autosome-localized γH2AX, but no change in RAD51 foci.
A) Meiotic chromosome spreads were prepared from PND14, PND21, and adult mice, and stained for SYCP3 (red) and RAD51 (green). RAD51 foci were quantified per zygotene-staged cell (n = 2 mice per age, with greater than 30 cells quantified). RAD51 foci are not significantly different at any of the profiled ages (Kruskal-Wallis test). B) Meiotic chromosome spreads were prepared from PND14, PND21, and adult mice, and stained for SYCP3 (red) and γH2AX (green). Persistent γH2AX on autosomes was quantified per pachytene-staged cell (n = 2 mice per age, with greater than 30 cells quantified). The average percentage of cells with at least one persistent γH2AX flare on autosomes is significantly higher in first-wave PND14 spermatocytes than in adult spermatocytes (* = p<0.05, One-Way Anova). C) Representative images of pachytene spermatocytes used to produce the quantification in (B).

Similar articles

Cited by

References

    1. Phillips BT, Gassei K, Orwig KE. Spermatogonial stem cell regulation and spermatogenesis. Philos Trans R Soc Lond B Biol Sci. The Royal Society; 2010;365: 1663–78. 10.1098/rstb.2010.0026 - DOI - PMC - PubMed
    1. Lawson KA, Hage WJ. Germline development. Ciba Foundation Symposium 182. Wiley; 1994.
    1. Anderson R, Copeland TK, Schöler H, Heasman J, Wylie C. The onset of germ cell migration in the mouse embryo. Mech Dev. Elsevier; 2000;91: 61–68. 10.1016/S0925-4773(99)00271-3 - DOI - PubMed
    1. Nakatsuji N, Chuma S. Differentiation of mouse primordial germ cells into female or male germ cells. Int J Dev Biol. UPV/EHU Press; 2001;45: 541–8. 10.1387/IJDB.11417897 - DOI - PubMed
    1. Ewen KA, Koopman P. Mouse germ cell development: From specification to sex determination. Molecular and Cellular Endocrinology. 2010. pp. 76–93. 10.1016/j.mce.2009.12.013 - DOI - PubMed

Publication types