. 2019 Mar 20;15(3):e1007647.
doi: 10.1371/journal.ppat.1007647. eCollection 2019 Mar.

Sympatric versus allopatric evolutionary contexts shape differential immune response in Biomphalaria / Schistosoma interaction

Affiliations

Sympatric versus allopatric evolutionary contexts shape differential immune response in Biomphalaria / Schistosoma interaction

Anaïs Portet et al. PLoS Pathog. .

Abstract

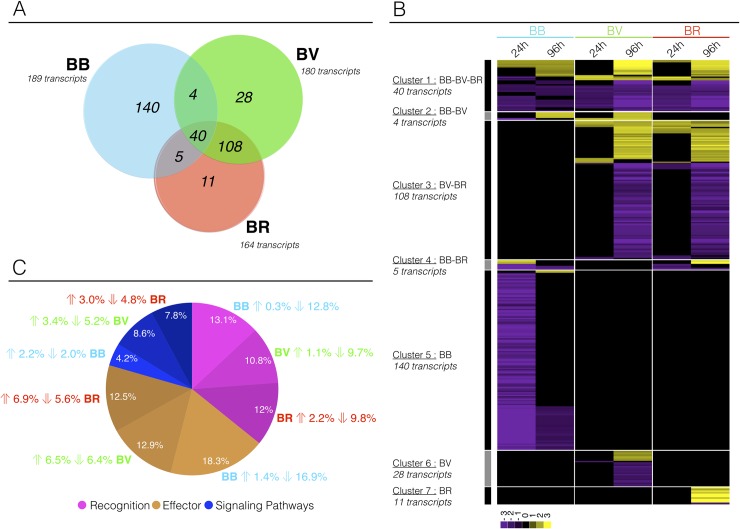
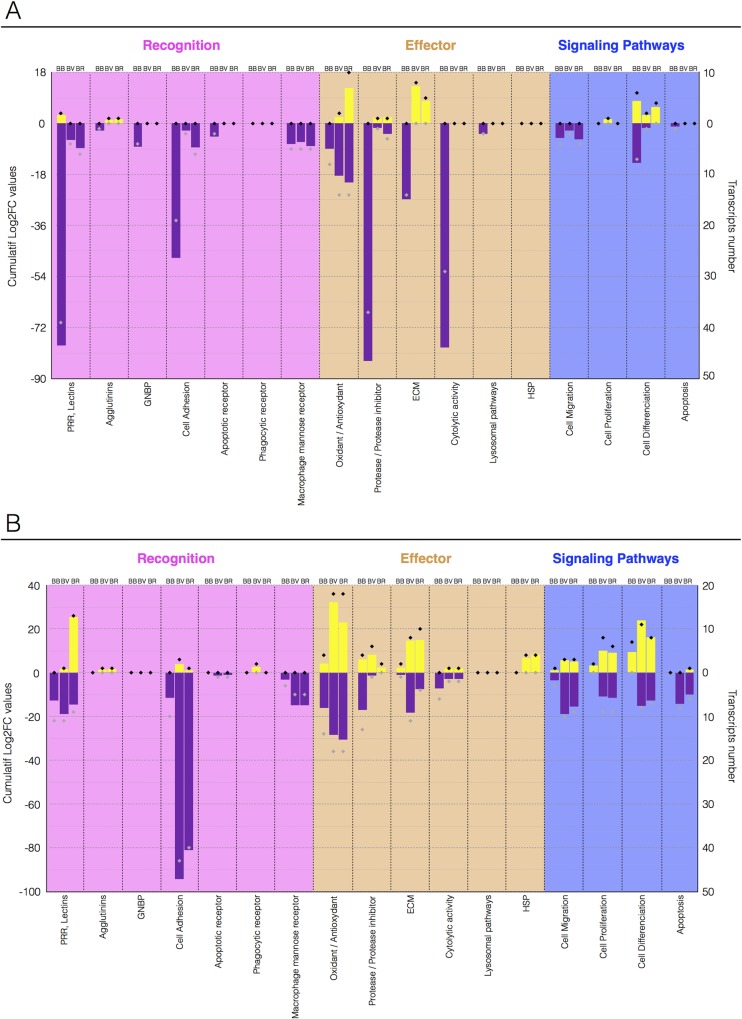
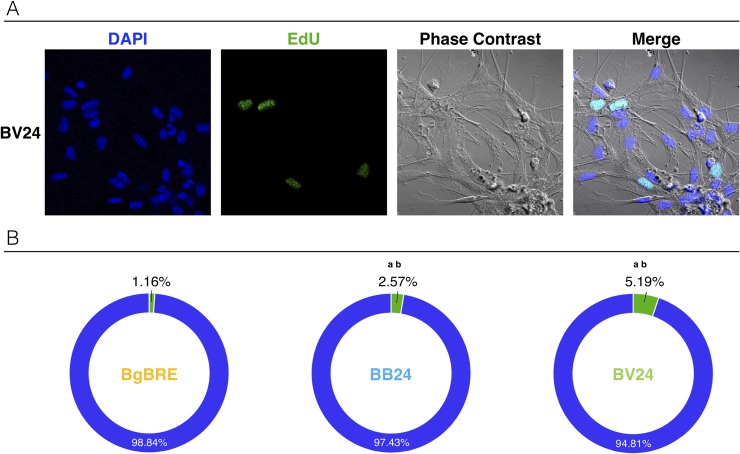
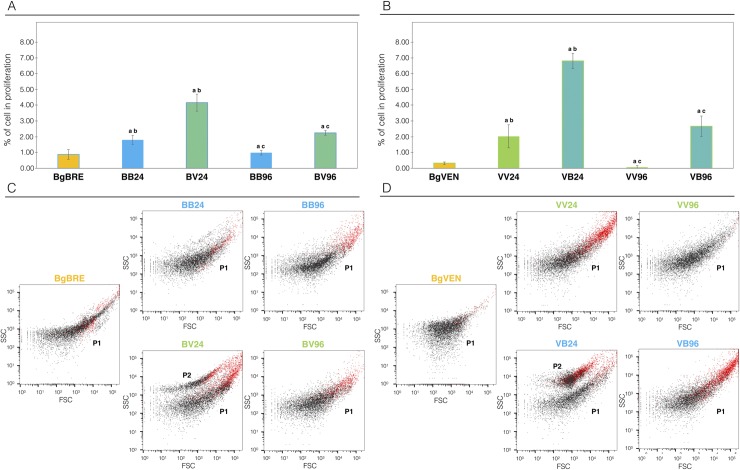
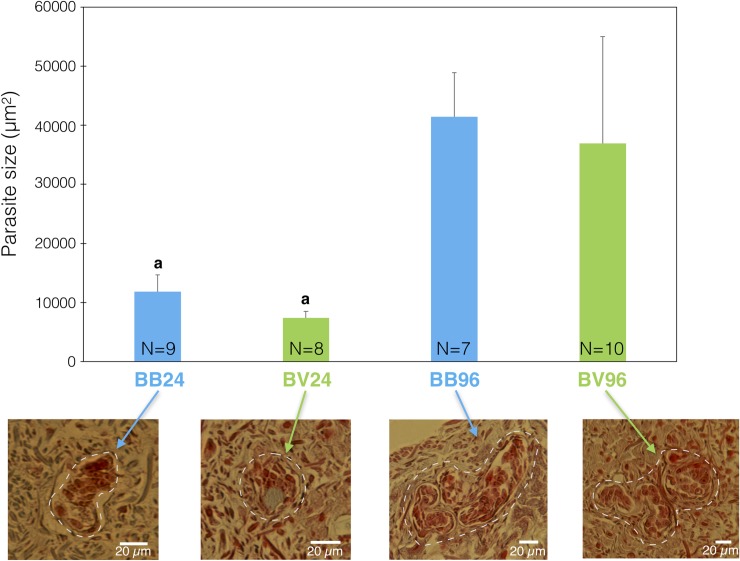
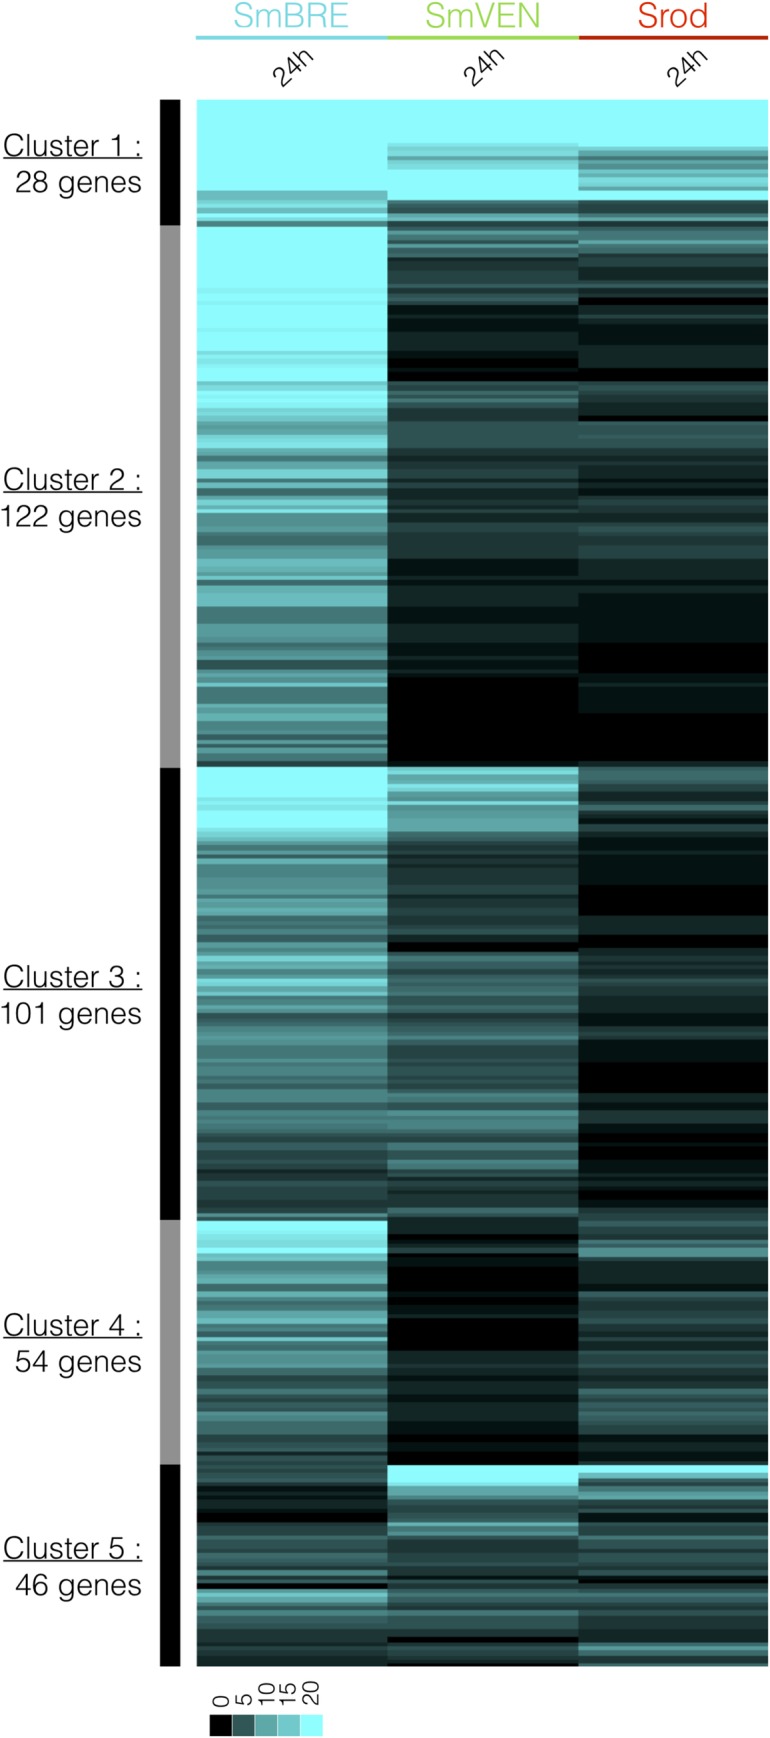
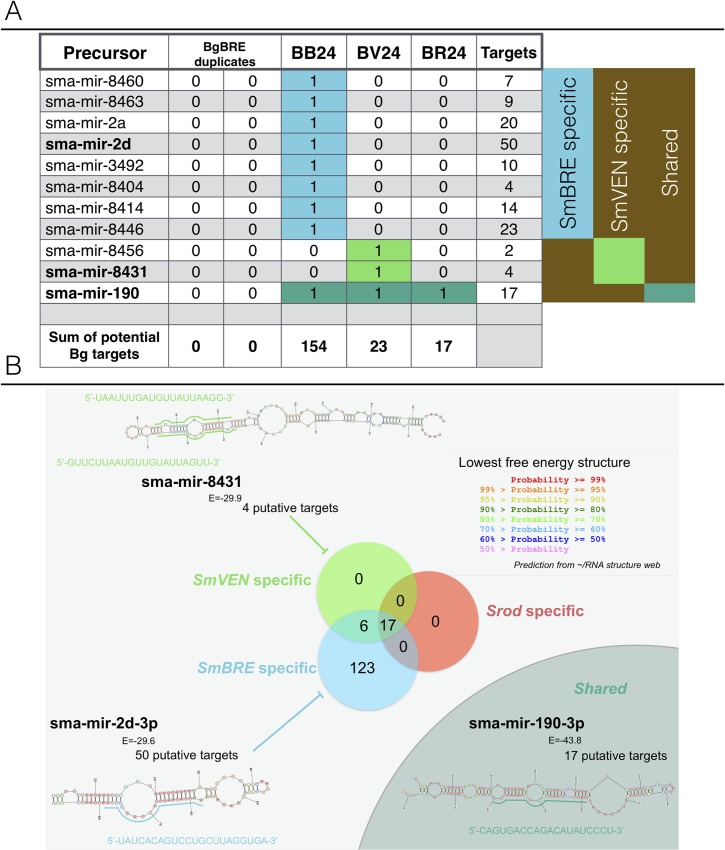
Selective pressures between hosts and their parasites can result in reciprocal evolution or adaptation of specific life history traits. Local adaptation of resident hosts and parasites should lead to increase parasite infectivity/virulence (higher compatibility) when infecting hosts from the same location (in sympatry) than from a foreign location (in allopatry). Analysis of geographic variations in compatibility phenotypes is the most common proxy used to infer local adaptation. However, in some cases, allopatric host-parasite systems demonstrate similar or greater compatibility than in sympatry. In such cases, the potential for local adaptation remains unclear. Here, we study the interaction between Schistosoma and its vector snail Biomphalaria in which such discrepancy in local versus foreign compatibility phenotype has been reported. Herein, we aim at bridging this gap of knowledge by comparing life history traits (immune cellular response, host mortality, and parasite growth) and molecular responses in highly compatible sympatric and allopatric Schistosoma/Biomphalaria interactions originating from different geographic localities (Brazil, Venezuela and Burundi). We found that despite displaying similar prevalence phenotypes, sympatric schistosomes triggered a rapid immune suppression (dual-RNAseq analyses) in the snails within 24h post infection, whereas infection by allopatric schistosomes (regardless of the species) was associated with immune cell proliferation and triggered a non-specific generalized immune response after 96h. We observed that, sympatric schistosomes grow more rapidly. Finally, we identify miRNAs differentially expressed by Schistosoma mansoni that target host immune genes and could be responsible for hijacking the host immune response during the sympatric interaction. We show that despite having similar prevalence phenotypes, sympatric and allopatric snail-Schistosoma interactions displayed strong differences in their immunobiological molecular dialogue. Understanding the mechanisms allowing parasites to adapt rapidly and efficiently to new hosts is critical to control disease emergence and risks of Schistosomiasis outbreaks.


Conflict of interest statement

The authors have declared that no competing interests exist.

Figures

Fig 1
Fig 1. Dual-RNAseq of Biomphalaria immune-related transcripts.
Among the differentially represented transcripts, Blast2GO functional annotation allowed us to identify 336 transcripts that appeared to be related to the Biomphalaria immune response. Abbreviations and colors: blue BB, sympatric interaction between BgBRE and SmBRE; green BV, allopatric interaction between BgBRE and SmVEN; and red BR, allopatric interaction between BgBRE and Srod. For each interaction 40 whole-snails are used, 20 pooled at 24h and 20 at 96h post-infection. A) Venn diagram showing the relationships among the immune transcripts found to be differentially expressed in the sympatric and allopatric interactions. B) Clustering of differentially represented immune transcripts. Heatmap representing the profiles of the 336 differentially represented immune-related transcripts in the BB, BV, or BR interactions along the kinetic of infection (at 24 and 96 h). Each transcript is represented once and each line represents one transcript. Colors: yellow, over-represented transcripts; purple, under-represented transcripts; and black, unchanged relative to levels in control naïve snails. C) Pie chart showing the distribution of the selected immune-related transcripts across three immunological processes: immune recognition (pink), immune effectors (brown), and immune signaling (blue). For each category and interaction, the respective proportion of transcripts and the direction of the effect (over- or underexpression) are indicated.
Fig 2
Fig 2. Differentially represented immune-related transcripts in sympatric and allopatric interactions.
Cumulative expression [Log2FC (fold change) from DESeq2 analysis] of the immune-related transcripts identified as being differentially represented following sympatric or allopatric infection. Transcripts were grouped into the three immunological groups described in Fig 1, and from there into functional categories. The yellow histograms correspond to cumulatively over-represented transcripts, while the purple histograms show under-represented transcripts. The black (over-represented) and gray (under-represented) diamonds correspond to the number of transcripts analyzed in each functional category. Abbreviations: BB, BgBRE/SmBRE interaction; BV, BgBRE/SmVEN interaction; and BR, BgBRE/Srod interaction. A. Immune transcript expression at 24 h post-infection. B. Immune transcript expression at 96 h post-infection.
Fig 3
Fig 3. Microscopic analyse of snail hemocyte proliferations.
In vitro EdU labeling of hemocytes was conducted for sympatric and allopatric interactions A) Hemocytes were collected at 24 h post-infection for in vitro analysis. Confocal microscopy of EdU-labeled hemocytes from snails subjected to the allopatric BV interaction (BgBRE/SmVEN). Colors: blue/DAPI; green/EdU; white/phase contrast. B) Microscopic counting of EdU-labeled hemocytes from naïve control snails (BgBRE) (n = 1,811) and those subjected to the sympatric interaction (BB: BgBRE/SmBRE) (n = 2,064) or an allopatric interaction (BV: BgBRE/SmVEN) (n = 1,366) recovered from 3 individual snails by condition. Colors: green, EdU-positive cells; and blue, EdU-negative cells. Between-group differences in the percentage of proliferation were tested using a Fisher exact test, with statistical significance accepted at p<0.05. The “a” indicates a significant difference between the naïve and infective conditions, while “b” indicates a significant difference between the infective conditions.
Fig 4
Fig 4. Flow cytometry analyse of the hemocyte response in sympatric and allopatric interactions.
A) Flow cytometry was used to count in vivo EdU-labeled hemocytes at 24 h and 96 h after infection in sympatric and allopatric interactions. A total number of hemocytes of n = 10,000were recoveredfor6 biological replicates of 3 snails. Control naïve snails (BgBRE, yellow) were compared to those subjected to the sympatric interaction (BB, BgBRE/SmBRE, blue) or an allopatric interaction (BV, BgBRE/SmVEN, green). B) The experiment described in A was repeated using the BgVEN snail strain. Control naïve snails (BgVEN, yellow) were compared to those subjected to the sympatric interaction (VV, BgVEN/SmVEN, green) or an allopatric interaction (VB, BgVEN/SmBRE, blue). C) FSC (forward-scattered light, representing cell size) and SSC (side-scattered light, representing cell granularity) circulating hemocyte patterns in BgBRE snails under the naïve condition (yellow) or 24 h and 96 h after infections in sympatry (BB24/96, BgBRE/SmBRE, blue) or allopatry (BV24/96, BgBRE/SmVEN, green). D) FSC and SSC circulating hemocyte patterns in BgVEN snails under the naïve condition (yellow) or 24 h and 96 h after infections in sympatry (VV24/96, BgVEN/SmVEN, blue) or allopatry (VB24/96, BgVEN/SmBRE, green). The red dots correspond to EdU-positive hemocytes. Between-group differences in the percentage of proliferation were tested using the Mann-Whitney U-test, with statistical significance accepted at p<0.05. The “a” indicates a significant difference between the naïve and infective condition, “b” indicates a significant difference between the infective conditions at 24h, and “c” indicates a significant difference between the infective conditions at 96h.
Fig 5
Fig 5. Development of parasites into snail tissues.
A histological approach was used to monitor parasite size along the course of snail infection. The sympatric interaction (BgBRE x SmBRE) is shown in blue, and the allopatric interaction (BgBRE x SmVEN) is shown in green. For each experimental interaction, the parasite sizes were quantified at 24 and 96 h after infection. Morpho-anatomical aspects of the parasite are depicted to highlight a potential difference in parasite survival. N = 7 to 10sporocystes were used as indicated in the figure.Between-group parasite size differences were assessed using the Mann-Whitney U-test, with significance accepted at p<0.05 (indicated by “a” on the histograms).
Fig 6
Fig 6. Clustering of intra-molluscalSchistosoma expression patterns.
RNAseq library mapping enabled us to identify 351 genes expressed by Schistosoma parasites in Biomphalaria snail tissues. Colors: blue, S. mansoni Brazil (SmBRE); green, S. mansoni Venezuela (SmVEN); and red, S. rodhaini (Srod). The heatmap represents the profiles of the 351 genes expressed by the different parasites at 24 h after infection. Each transcript is represented once and each line represents one transcript. The expression level is highlighted by the different shades of blue.
Fig 7
Fig 7. In-silico identification of parasite miRNAs.
miRNAs were assessed using libraries obtained from naïve snails and snails infected for 24 h under the various interaction conditions (BB24, BgBRE x SmBRE; BV24, BgBRE x SmVEN; BR24, BgBRE x Srod). A) Table highlighting the precursor miRNAs that may have targets among the immune-related snail transcripts selected in the present work. They include eight precursors specifically recovered in BB24, two in BV24, and one shared across the three infected conditions. The total numbers of potential targets in each condition are indicated. B) Venn diagram showing the potential targets according to the sympatric or allopatric interactions. Shown is an example miRNA stem-loop precursor that presents the highest number of potential host targets.

Similar articles

Cited by

References

    1. WHO. Schistosomiasis Fact Sheet No 115 World Health Organisation; 2010.
    1. Basch PF. Intermediate host specificity in Schistosoma mansoni. Experimental Parasitology. 1976;39(1):150–69. - PubMed
    1. Theron A, Pages JR, Rognon A. Schistosoma mansoni: distribution patterns of miracidia among Biomphalaria glabrata snail as related to host susceptibility and sporocyst regulatory processes. Experimental Parasitology. 1997;85(1):1–9. 10.1006/expr.1996.4106 - DOI - PubMed
    1. Theron A, Rognon A, Gourbal B, Mitta G. Multi-parasite host susceptibility and multi-host parasite infectivity: a new approach of the Biomphalaria glabrata/Schistosoma mansoni compatibility polymorphism. Infection Genetics and Evolution. 2014;26:80–8. - PubMed
    1. Prugnolle F, de Meeus T, Pointier JP, Durand P, Rognon A, Theron A. Geographical variations in infectivity and susceptibility in the host-parasite system Schistosoma mansoni/Biomphalaria glabrata: no evidence for local adaptation. Parasitology. 2006;133(Pt 3):313–9. 10.1017/S0031182006000412 - DOI - PubMed

Publication types