. 2019 Jun;46(6):2610-2620.
doi: 10.1002/mp.13503. Epub 2019 Apr 22.

Quantitative assessment of breast density using transmission ultrasound tomography

Affiliations

Quantitative assessment of breast density using transmission ultrasound tomography

James Wiskin et al. Med Phys. 2019 Jun.

Abstract

Purpose: Breast density is important in the evaluation of breast cancer risk. At present, breast density is evaluated using two-dimensional projections from mammography with or without tomosynthesis using either (a) subjective assessment or (b) a computer-aided approach. The purpose of this work is twofold: (a) to establish an algorithm for quantitative assessment of breast density using quantitative three-dimensional transmission ultrasound imaging; and (b) to determine how these quantitative assessments compare with both subjective and objective mammographic assessments of breast density.

Methods: We described and verified a threshold-based segmentation algorithm to give a quantitative breast density (QBD) on ultrasound tomography images of phantoms of known geometric forms. We also used the algorithm and transmission ultrasound tomography to quantitatively determine breast density by separating fibroglandular tissue from fat and skin, based on imaged, quantitative tissue characteristics, and compared the quantitative tomography segmentation results with subjective and objective mammographic assessments.

Results: Quantitative breast density (QBD) measured in phantoms demonstrates high quantitative accuracy with respect to geometric volumes with average difference of less than 0.1% of the total phantom volumes. There is a strong correlation between QBD and both subjective mammographic assessments of Breast Imaging - Reporting and Data System (BI-RADS) breast composition categories and Volpara density scores - the Spearman correlation coefficients for the two comparisons were calculated to be 0.90 (95% CI: 0.71-0.96) and 0.96 (95% CI: 0.92-0.98), respectively.

Conclusions: The calculation of breast density using ultrasound tomography and the described segmentation algorithm is quantitatively accurate in phantoms and highly correlated with both subjective and Food and Drug Administration (FDA)-cleared objective assessments of breast density.

Keywords: breast density; image segmentation; medical imaging; transmission ultrasound; ultrasound tomography.


Conflict of interest statement

All authors are employees of QT Ultrasound, LLC.

Figures

Figure 1
Figure 1
Photograph of the multimodality transmission and reflection ultrasound imaging system. [Color figure can be viewed at wileyonlinelibrary.com]
Figure 2
Figure 2
Summary of segmentation algorithm. [Color figure can be viewed at wileyonlinelibrary.com]
Figure 3
Figure 3
Photograph (left) and schematic (right) of the cylindrical phantom with cylindrical inclusions. On the schematic, the label Ø symbol indicates diameter (not radius) of the associated holes. All measurements are in millimeters. [Color figure can be viewed at wileyonlinelibrary.com]
Figure 4
Figure 4
Photographs of (a) polyurethane phantom with spherical inclusions (left) and (b) isolated spherical inclusions (right). [Color figure can be viewed at wileyonlinelibrary.com]
Figure 5
Figure 5
Isometric (left) and planar (right) views of the calibration phantom. On the planar view, the label Ø indicates diameter and THRU indicates through holes. There are four (4 × ) through holes in the phantom which are filled with water upon placement of the phantom in water. All dimensions are in millimeters.
Figure 6
Figure 6
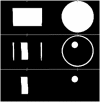
Segmented transmission ultrasound images (coronal and axial views) of the cylindrical phantom with cylindrical inclusions for geometric comparison. Top row: segmented total volume, middle row shows segmented peripheral capsule and internal cylinder. Bottom row: segmented internal cylinder without the peripheral capsule (representing skin). Quantitative breast density score is volume in bottom row divided by volume in top row.
Figure 7
Figure 7
Top row, speed of sound images of the cylindrical phantom with spherical inclusions; Bottom row, high speed spheres segmented out.
Figure 8
Figure 8
Quantitative breast density segmentation algorithm applied to calibration phantom; (left) speed of sound image, (middle) segmented peripheral capsule and high‐speed spheres and rods. The segmentation is based on speed of sound > 1489 m/s.
Figure 9
Figure 9
Steps in the quantitative breast density algorithm: Top row, speed of sound images. Middle row, breast separated from the water bath with skin and fibroglandular tissue segmented from the total breast tissue volume. Bottom row, remaining fibroglandular tissue following the segmentation and removal of skin. The segmentation is based on speed of sound > 1489 m/s.
Figure 10
Figure 10
Comparison of quantitative breast density (QBD) values and BIRADS‐based subjective breast density scores.17 The vertical axis is the percentage of total breast volume that is fibroglandular tissue — either the QBD value or the subjective value assigned to BiRADS composition categories. [Color figure can be viewed at wileyonlinelibrary.com]
Figure 11
Figure 11
Comparison of quantitative breast density and Volpara density scores. The Spearman rank correlation r is 0.96
Figure 12
Figure 12
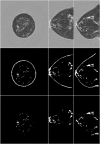
Transmission ultrasound images of a fatty breast quantitative breast density (QBD = 10.9%). Top row, speed of sound image; L to R: coronal, axial sagittal image. Middle row, fibroglandular tissue and skin segmented from the total breast tissue volume. Bottom row, remaining fibroglandular tissue following the segmentation and removal of skin. The segmentation is based on speed of sound > 1489 m/s.
Figure 13
Figure 13
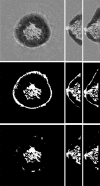
Transmission ultrasound images of a heterogeneously dense breast quantitative breast density (QBD = 29.5%). Top row, speed of sound (SOS). L to R: coronal, axial, sagittal. Middle row, segmentation with skin. Bottom row, corresponding total breast volume. There is clear correlation between the total breast volume, the segmentation, and the high‐speed tissue. The segmentation is based on SOS > 1489 m/s.
Figure 14
Figure 14
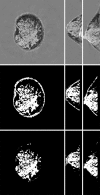
Transmission ultrasound images of a dense breast quantitative breast density (QBD = 62.4%). Top row, speed of sound (SOS). L to R: coronal, axial, sagittal. Middle row, segmentation with skin. Bottom row, corresponding total breast volume. There is clear correlation between the total breast volume, the segmentation, and the high‐speed tissue. The segmentation is based on SOS > 1489 m/s.
Figure 15
Figure 15
Cube containing cross‐shaped truncated cone (light gray). Left, top view. Right, side view. The volume fraction of the light gray area is only ~12%, but on the side projection (right panel), the light gray area occupies ~49% of the total square.

Similar articles

Cited by

References

    1. Pettersson A, Hankinson SE, Willett WC, Lagiou P, Trichopoulos D, Tamimi RM. Nondense mammographic area and risk of breast cancer. Breast Cancer Res. 2011;13:R100. - PMC - PubMed
    1. Martin LJ, Boyd NF. Mammographic density. Potential mechanisms of breast cancer risk associated with mammographic density: hypotheses based on epidemiological evidence. Breast Cancer Res. 2008;10:201. - PMC - PubMed
    1. Boyd NF, Martin LJ, Yaffe MJ, Minkin S. Mammographic density and breast cancer risk: current understanding and future prospects. Breast Cancer Res. 2011;13:223. - PMC - PubMed
    1. Harvey JA, Bovbjerg VE. Quantitative assessment of mammographic breast density: relationship with breast cancer risk. Radiology. 2004;230:29–41. - PubMed
    1. Boyd NF, Lockwood GA, Byng JW, Tritchler DL, Yaffe MJ. Mammographic densities and breast cancer risk. Cancer Epidemiol Biomark Prev. 1998;7:1133–1144. - PubMed