. 2019 Mar 19;26(12):3212-3220.e4.
doi: 10.1016/j.celrep.2019.02.073.

Entosis Controls a Developmental Cell Clearance in C. elegans

Affiliations

Entosis Controls a Developmental Cell Clearance in C. elegans

Yongchan Lee et al. Cell Rep. .

Abstract

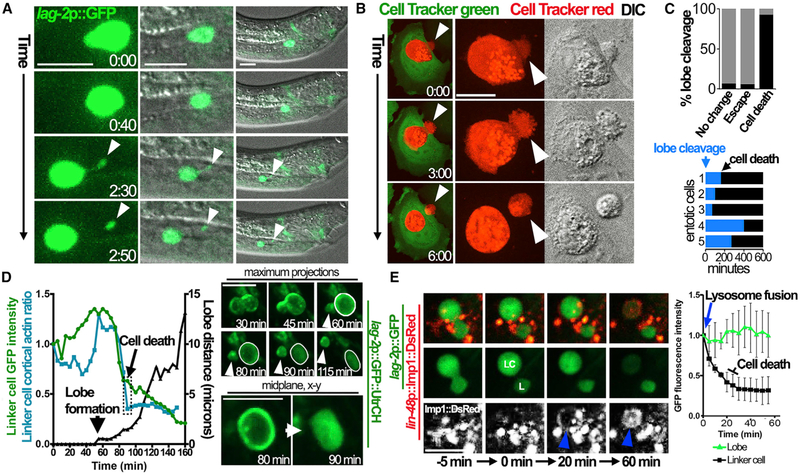
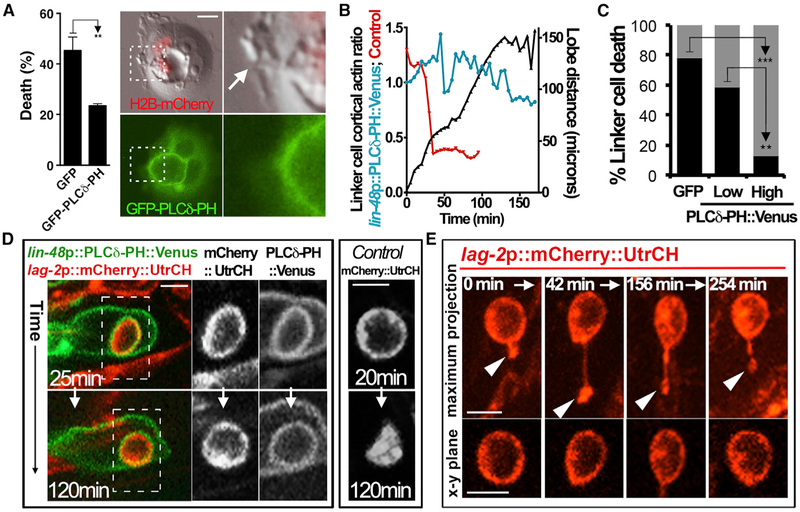
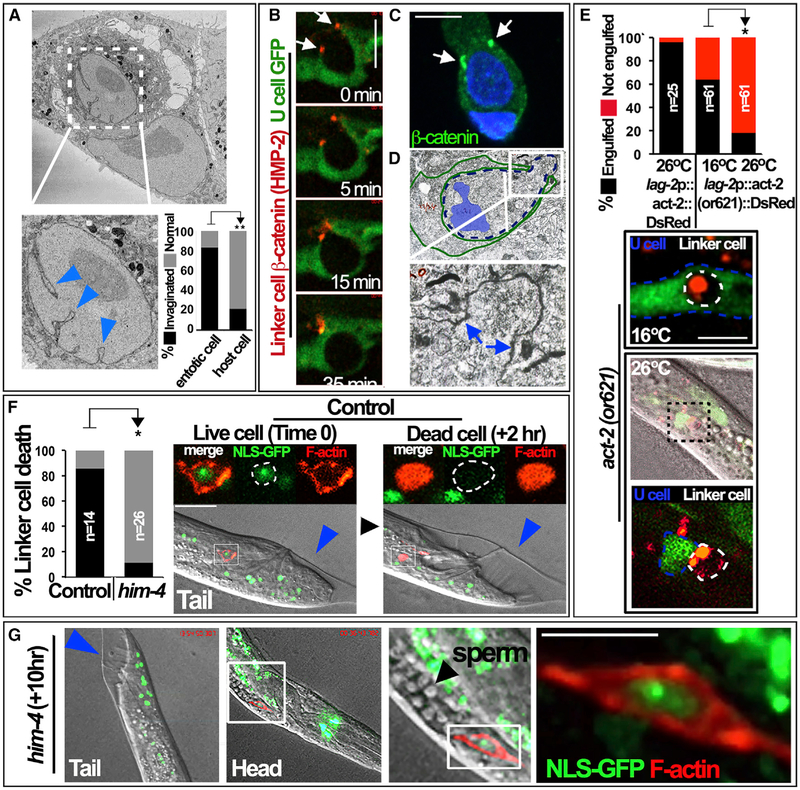
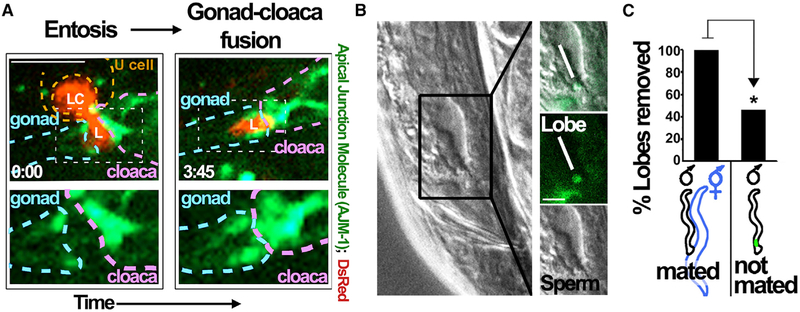
Metazoan cell death mechanisms are diverse and include numerous non-apoptotic programs. One program called entosis involves the invasion of live cells into their neighbors and is known to occur in cancers. Here, we identify a developmental function for entosis: to clear the male-specific linker cell in C. elegans. The linker cell leads migration to shape the gonad and is removed to facilitate fusion of the gonad to the cloaca. We find that the linker cell is cleared in a manner involving cell-cell adhesions and cell-autonomous control of uptake through linker cell actin. Linker cell entosis generates a lobe structure that is deposited at the site of gonad-to-cloaca fusion and is removed during mating. Inhibition of lobe scission inhibits linker cell death, demonstrating that the linker cell invades its host while alive. Our findings demonstrate a developmental function for entosis: to eliminate a migrating cell and facilitate gonad-to-cloaca fusion, which is required for fertility.

Keywords: cell adhesion; cell cannibalism; engulfment; entosis; entotic cell death; gonad; linker cell death; lobe; scission; uropod.


Figures

Figure 1.
Figure 1.. Linker Cell Engulfment and Entotic Cell Death Involve Separation of a Lobe Structure
(A) 4D imaging of linker cell engulfment shows the formation and separation of a lobe (arrowhead). Images are maximum projections, times are h:min. See Video S1. (B) Entotic cells form lobes. Images show MCF-7 cells labeled with green and red Cell Tracker dyes imaged by 4D microscopy; times are h:min. Arrowhead indicates lobe that undergoes cleavage. See Video S3A. (C) Lobe cleavage is a feature of entotic cell death. Top graph shows percent entotic MCF-7 cells imaged for 20 h that exhibit lobe cleavage (black bars) and one of three possible fates: remaining inside of hosts without dying (“no change”), escape from hosts, or cell death. Gray bars show the percentage of cells without lobe cleavage. For no change, n = 16; escape, n = 34; and cell death, n = 14; n represents the total number of cells imaged from more than three biological replicates. Bottom graph shows five representative lobe cleavages and entotic cell death events; relative times start at lobe cleavage (blue bars, arrow), and cell deaths are indicated by black bars. Scale bars, 10 μm. (D)Graph shows cortical to cytoplasmic ratio of GFP::UtrCH (blue line, left y-axis) in a linker cell from the time of engulfment marked by lobe formation (arrowhead). Green line shows GFP intensity over time; black line (righty axis) shows distance of lobe separation from linker cell. Hatched box represents timing of linker cell death (arrow) determined by cortical actin ratio and GFP intensity (see Figure S1D for additional examples). Right images show linker cell quantified in graph. Top rows show maximum projections of GFP::UtrCH fluorescence; arrowhead indicates lobe. Bottom row shows the x-y confocal plane of GFP::UtrCH fluorescence from the same cell. Note cortical GFP::UtrCH fluorescence at 80 min redistributes to the cytoplasm by 90 min. See also Video S4B. (E)Lysosome fusion to the linker cell vacuole precedes loss of GFP fluorescence. Images are x-y confocal planes of U cell lmp-1::mDsRed-labeled lysosomes (red) and linker cell GFP fluorescence. Time 0 is the time of lobe separation (L) from the linker cell (LC). Note that the linker cell vacuole becomes labeled with lmp-1::mDsRed fluorescence 20 min after lobe separation (bottom row, blue arrow), which is followed by loss of linker cell GFP. See also Video S5. Graph shows quantification of fluorescence intensities of the linker cell (black line) versus separated lobe (green line) over time after lysosome fusion (time 0). Data are means ± SD from three independent biological repeats. Scale bars, 10 μm.
Figure 2.
Figure 2.. Entotic and Linker Cell Death, and Lobe Scission, Are Disrupted by Expression of a PIP2 Sensor
(A) Entotic death in MCF-7 cells is inhibited by GFP-PLCδ-PH expression. Graph shows the mean percentage of entotic cells from three independent biological repeats that underwent cell death over 24 h of time-lapse imaging. Error bars represent SEM. n = 35 total cells analyzed for GFP control, n = 36 for GFP-PLCδ-PH. Right images show representative entotic cell that did not undergo cell death and maintained a lobe (arrow) protruding from a host cell expressing GFP- PLCδ-PH (green). H2B-mCherry expression in cell nuclei is shown in red. **p = 0.04 (Student’s t test). (B) Expression of PLCδ-PH::Venus in U cells inhibits linker cell cytoplasmic translocation of mCherry::UtrCH. Graph shows the cortical-to-cytoplasmic ratio of mCherry::UtrCH fluorescence (blue line, left y axis) in a linker cell from the time of engulfment marked by lobe formation. Red line shows the cortical actin ratio from control linker cell for comparison (from Figure 1D). Black line (right y axis) shows the distance of lobe separation from linker cell over time. (C) High-level PLCδ-PH::Venus expression (>2-fold over background fluorescence intensity), but not low-level expression (<2-fold over background), in U cells inhibits linker cell death. Graph shows the percentage of linker cells that underwent cell death (determined by loss of cortical actin) within 45 min of lobe formation inside of U cells expressing GFP (n = 32) or low (n = 12) and high (n = 23) levels of PLCδ-PH::Venus. **p < 0.015; ***p < 0.001 (Fisher’s exact test). (D) Representative images of a U cell expressing lin-48p::PLCδ-PH::Venus (green) with an engulfed mCherry::UtrCH-expressing linker cell 25 min (top) and 120 min (bottom) after lobe formation. Grayscale images show mCherry::UtrCH and PLCδ-PH::Venus fluorescence from the region indicated by the hatched box. Note that the linker cell maintains cortical actin as compared to the linker cell from a control experiment (right images, GFP-expressing U cell). See also Video S6. (E) A surviving linker cell inside a PLCδ-PH::Venus-expressing U cell maintains an attached lobe. Images show linker cell mCherry::UtrCH fluorescence over the indicated time course. Note that the lobe (arrow, top images, maximum projections) stays attached, and cortical actin (bottom images, individual x-y plane images) is maintained. See also Video S7. Scale bars, 10 μm.
Figure 3.
Figure 3.. Linker Cell Clearance and Entosis Involve Nuclear Crenellation, Cell Adhesions, and Cell-Autonomous Control through Actin
(A) Entotic cells exhibit nuclear invagination. Image shows a scanning electron micrograph (serial block face) of an internalized entotic cell and host cell. Nuclear invaginations indicated with blue arrowheads. Graph shows the percentage of entotic cell (n = 6) or host cell (n = 14) nuclei with invaginated (black bars) or normal (gray bars) morphology. **p < 0.02 (Fisher’s exact test). (B) DsRed-tagged HMP-2 expressed in the linker cell (lag-2p::hmp-2::DsRed) forms foci that colocalize with the ends of engulfing U cell arms(arrows). U cell GFP (lin-48p::GFP) is shown in green. (C) β-catenin forms foci during entosis. Images show immunofluorescence staining of β-catenin (green) in MCF-7 cells undergoing entosis. DAPI-stained nuclei are shown in blue. (D) A partially engulfed linker cell exhibits cell adhesions with a U cell. Transmission electron micrograph of a partially engulfed linker cell from a late L4-stage worm is shown (courtesy of WormAtlas). Green outline shows the shape of an engulfing U cell, and the blue hatched line indicates a linker cell. Boxed region shows lobe structure with cell-cell adhesions evident between the linker cell and U cell (arrows). The linker cell nucleus (pseudocolored in blue) appears crenellated. (E) Linker cell actin is required for engulfment. Graph shows the percentage of linker cells expressing wild-type actin (act-2, left bar) or a temperature-sensitive (ts), dominant-negative mutant of actin (lag-2p::act-2(or621)::DsRed) (right bars) that are engulfed at the permissive (16°C) versus restrictive (26°C) temperature into U cells expressing GFP (lin-48p::GFP). *p < 0.05 (Fisher’s exact test). Images show representative engulfed linker cell at the permissive temperature (top) and a representative linker cell in contact with a U cell, but not engulfed at the restrictive temperature (middle and bottom). Dashed lines indicate linker cell (white) and U cell (blue) outlines. n indicates the total number of worms analyzed from more than three independent experiments. Scale bars, 10 μm. (F)Linker cell death is inhibited by the him-4 mutation that disrupts migration. Graph shows the percent linker cells that undergo cell death (determined by loss of cortical actin and NLS-GFP) by 8 h after the onset of the L4-to-adult transition in control or him-4 mutant C. elegans with disrupted migration. n indicates the total number of worms analyzed from more than three independent experiments. *p < 0.05 (Fisher’s exact test). Images show a control linker cell at the onset of the L4-to -adult transition (time 0, blue arrow), with cortical actin and nuclear-localized GFP, and 2 h after the L4-to-adult transition (+2 hr), by which point it is engulfed and dead, as evidenced by loss of cortical actin and NLS-GFP. (G)Images show a linker cell in him-4 mutant that migrates toward the head and is still alive with cortical actin and NLS-GFP 10 h after the onset of the L4-to-adult transition. Sperm are visible (black arrowhead) in the gonad that extends behind the linker cell. See also Video S8. Scale bars, 10 μm.
Figure 4.
Figure 4.. Persistence of the Linker Cell Lobe and Entosis Model
(A) The linker cell lobe remains at the site of gonad-to-cloaca fusion after cleavage. Images from 4D imaging show the linker cell (LC) and lobe (L) in red (DsRed) and the cell adhesion marker apical junction molecule 1 (AJM-1) in green (ajm-1p::ajm-1::GFP) that marks cell junctions. The gonad is outlined in by the dashed blue region and the cloaca by the dashed purple region, and the hypothetical positioning of the engulfing U cell (left) is shown by the dashed orange region. Bottom images show regions indicated by hashed white boxes in the top images. The lobe (left) lies between the gonad and cloaca and remains at this site even after the linker cell body is cleared and the gonad and cloaca appear to undergo fusion (right images). Times are indicated as h:min; scale bar, 10 μm. (B) The linker cell lobe is observable in adult male worms posterior to sperm. Green fluorescence shows lag-2p::GFP expression; the lobe and sperm are indicated in the boxed region (right). Scale bar, 5 μm. (C) Mating facilitates lobe removal. Graph shows the percentage of adult male worms with lag-2p::GFP-labeled lobes after mating with hermaphrodites (left bar, n = 12) or growth in the absence of hermaphrodites (right bar, n = 13). *p < 0.02 (Fisher’s exact test).

Similar articles

Cited by

References

    1. Abdu Y, Maniscalco C, Heddleston JM, Chew TL, and Nance J (2016). Developmentally programmed germ cell remodelling by endodermal cell cannibalism. Nat. Cell Biol 18, 1302–1310. - PMC - PubMed
    1. Abraham MC, Lu Y, and Shaham S (2007). A morphologically conserved nonapoptotic program promotes linker cell death in Caenorhabditis elegans. Dev. Cell 12, 73–86. - PubMed
    1. Ahmed N, Yang P, Huang Y, Chen H, Liu T, Wang L, Nabi F, Liu Y, and Chen Q (2017). Entosis acts as a novel way within sertoli cells to eliminate spermatozoa in seminiferous tubule. Front. Physiol 8, 361. - PMC - PubMed
    1. Altun ZF, Herndon LA, Wolkow CA, Crocker C, Lints R, and Hall DH (2002-2006). WormAtlas. http://www.wormatlas.org.
    1. Blum ES, Abraham MC, Yoshimura S, Lu Y, and Shaham S (2012). Control of nonapoptotic developmental cell death in Caenorhabditis elegans by a polyglutamine-repeat protein. Science 335, 970–973. - PMC - PubMed

Publication types

MeSH terms