. 2019 Mar 19;26(12):3284-3297.e3.
doi: 10.1016/j.celrep.2019.02.070.

Nanoscale Subsynaptic Domains Underlie the Organization of the Inhibitory Synapse

Affiliations

Nanoscale Subsynaptic Domains Underlie the Organization of the Inhibitory Synapse

Kevin C Crosby et al. Cell Rep. .

Abstract

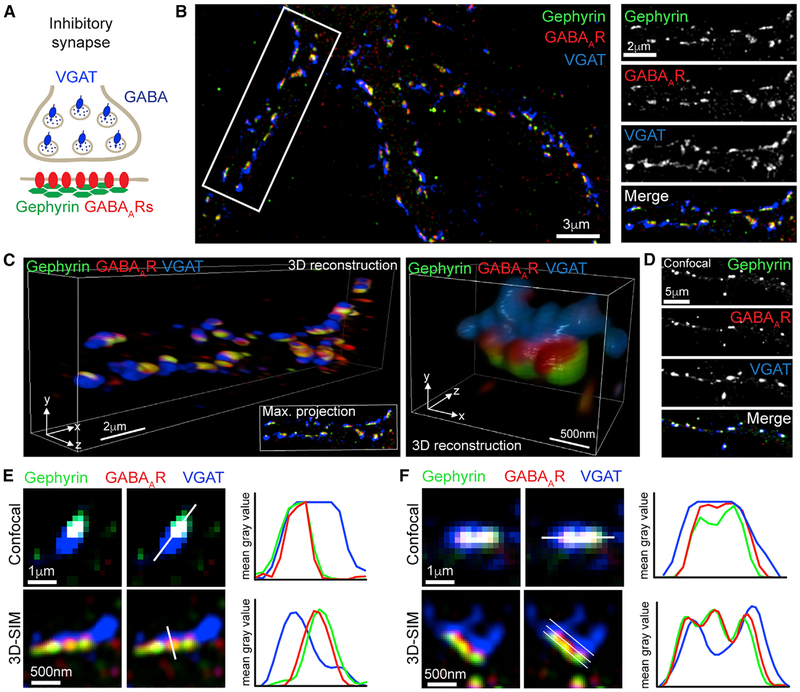
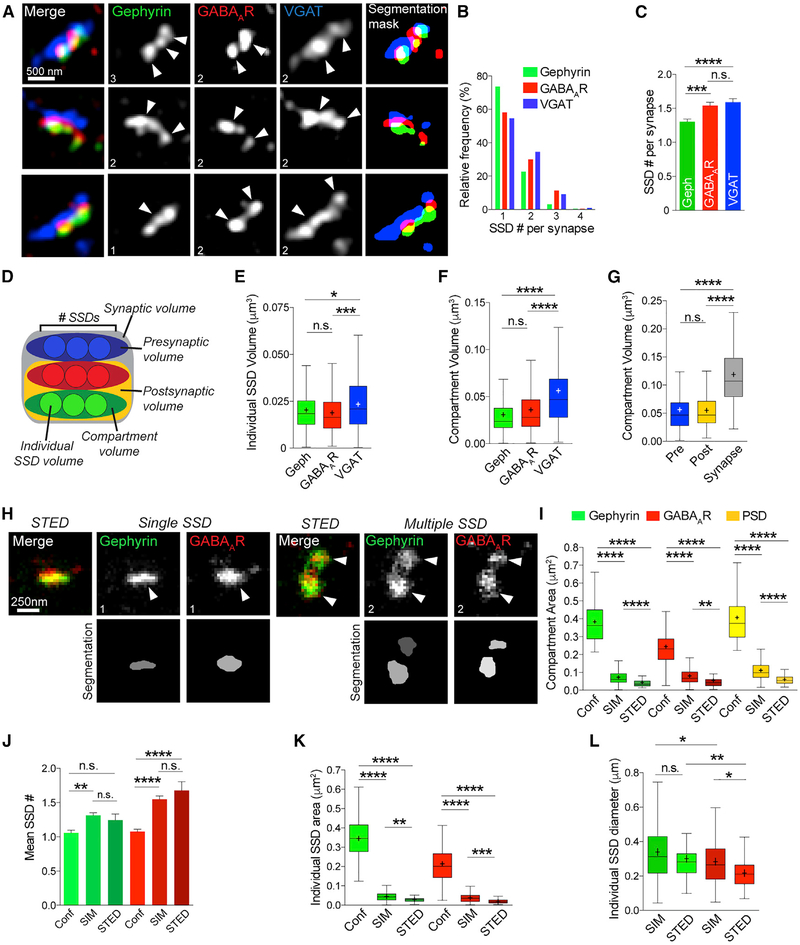
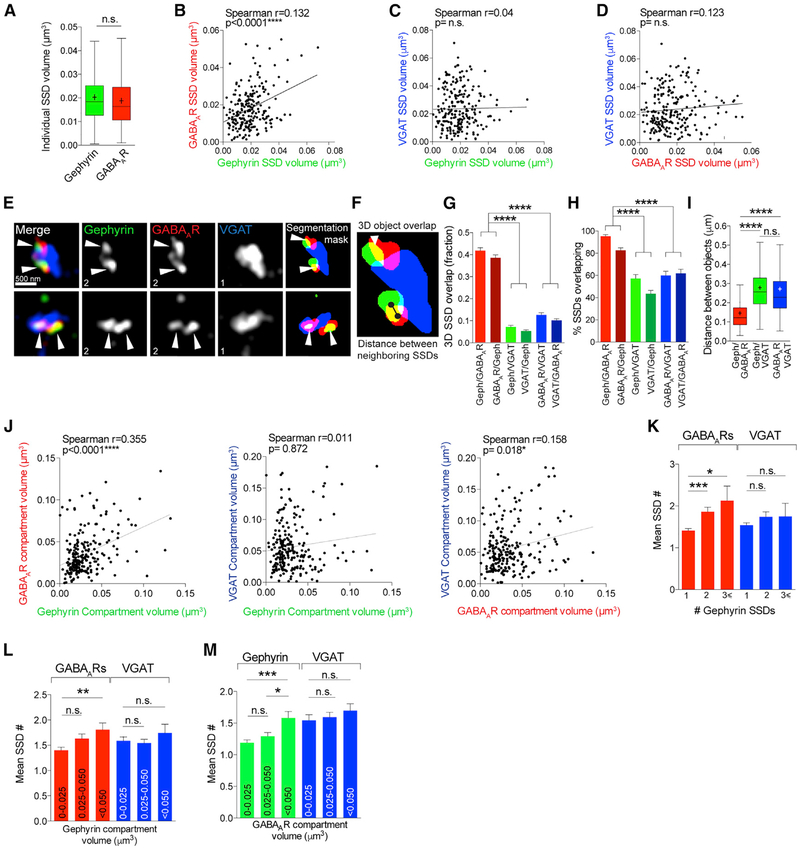
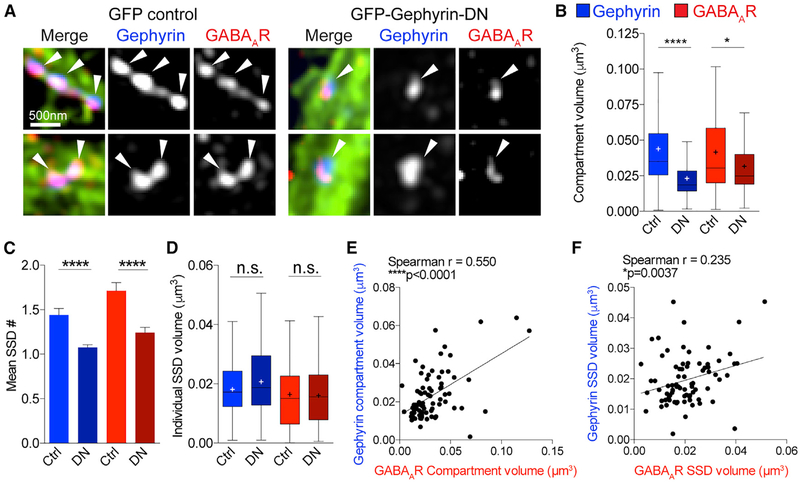
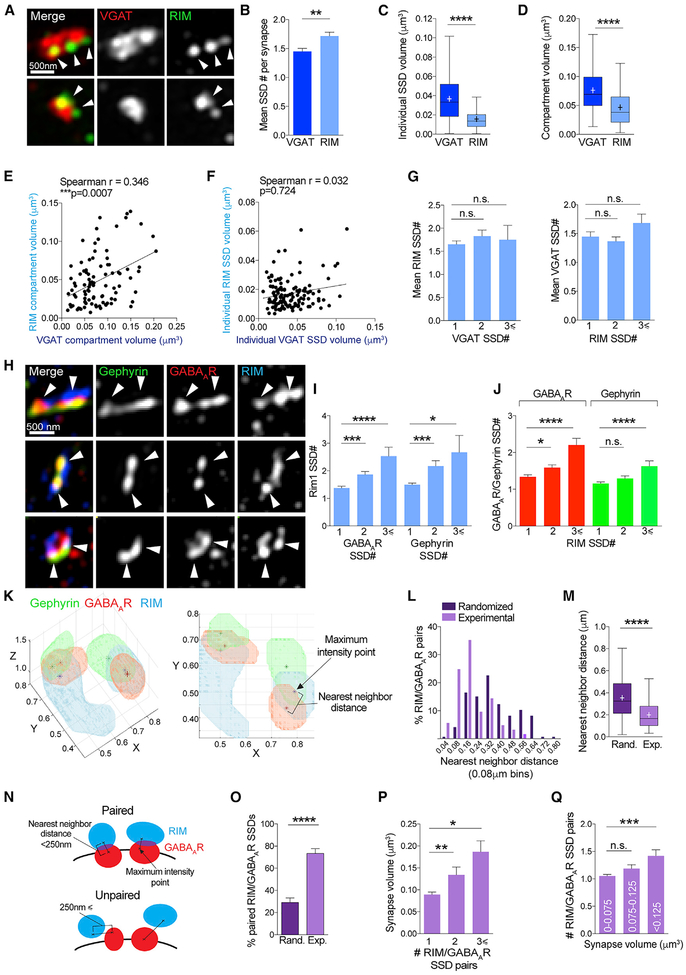
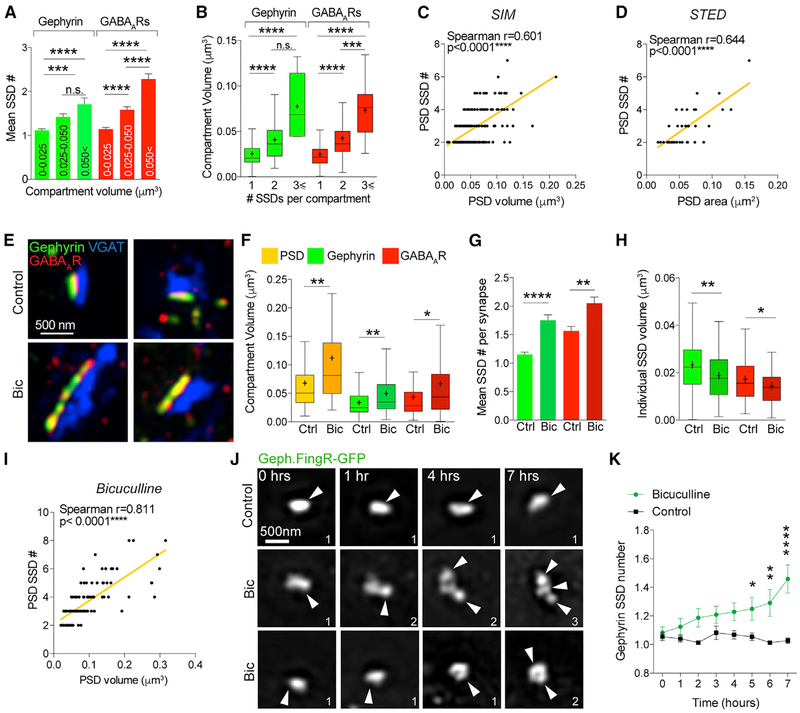
Inhibitory synapses mediate the majority of synaptic inhibition in the brain, thereby controlling neuronal excitability, firing, and plasticity. Although essential for neuronal function, the central question of how these synapses are organized at the subsynaptic level remains unanswered. Here, we use three-dimensional (3D) super-resolution microscopy to image key components of the inhibitory postsynaptic domain and presynaptic terminal, revealing that inhibitory synapses are organized into nanoscale subsynaptic domains (SSDs) of the gephyrin scaffold, GABAARs and the active-zone protein Rab3-interacting molecule (RIM). Gephyrin SSDs cluster GABAAR SSDs, demonstrating nanoscale architectural interdependence between scaffold and receptor. GABAAR SSDs strongly associate with active-zone RIM SSDs, indicating an important role for GABAAR nanoscale organization near sites of GABA release. Finally, we find that in response to elevated activity, synapse growth is mediated by an increase in the number of postsynaptic SSDs, suggesting a modular mechanism for increasing inhibitory synaptic strength.

Keywords: GABA(A) receptor; RIM; VGAT; gephyrin; homeostatic plasticity; inhibitory synapse; structured illumination microscopy; super-resolution nanoscopy.


Conflict of interest statement

DECLARATION OF INTERESTS

The authors declare no competing interests.

Figures

Figure 1.
Figure 1.. 3D-SIM of Inhibitory Synapses
(A) Schematic of the inhibitory synapse showing that synaptic GABAARs are anchored by gephyrin opposite GABAergic terminals labeled with VGAT. (B) Three-dimensional structured illumination microscopy (3D-SIM) maximum projection of hippocampal neuron labeled with antibodies to gephyrin (green), GABAARs (red), and VGAT (blue); region in white box is the dendrite on the right. (C) 3D reconstructions of the dendrite in (B) and a single synapse. Also see Video S1. (D) Confocal maximum projection of hippocampal neuron stained under identical conditions to (B). (E and F) Magnifications of synapses from confocal and SIM images, with line scans perpendicular (E) or parallel (F) to the synapse axis, showing nanoscale subsynaptic domains (SSDs) in the SIM image. White lines show path of line scans.
Figure 2.
Figure 2.. The Inhibitory Postsynaptic Domain Is Composed of Nanoscale SSDs
(A) Maximum projection SIM images of hippocampal inhibitory synapses and object masks generated by segmentation analysis. Numbers denote number of SSDs in compartment. (B) Frequency distribution graph of number of SSDs per synapse for gephyrin, GABAAR, and VGAT compartments. (C) Mean number of SSDs per compartment. ****p < 0.0001 (Kruskal-Wallis); n = 220 synapses. Data are represented as mean ± SEM. (D) Schematic of volume parameters measured by segmentation. (E) Box plots of individual SSD volumes for gephyrin, GABAARs, and VGAT. ****p < 0.0001 (Kruskal-Wallis); n = 220 synapses. Cross denotes mean; horizontal line denotes median. (F) Box plots of compartment volumes for gephyrin, GABAARs, and VGAT. ****p < 0.0001 (Kruskal-Wallis); n = 220 synapses. Cross denotes mean; horizontal line denotes median. (G) Box plots of compartment volumes for the presynaptic site, postsynaptic site, and whole synapse ****p < 0.0001 (Kruskal-Wallis); n = 220 synapses. Cross denotes mean; horizontal line denotes median. (H) STED images of gephyrin (green) and GABAARs (red) from hippocampal neuronal dendrites. Numbers denote number of SSDs in compartment. (I) Box plots of compartment area for gephyrin, GABAARs, and PSD derived from confocal, SIM, and STED images. ****p < 0.0001 (Kruskal-Wallis); n = 54/220/37 synapses. Cross denotes mean; horizontal line denotes median. (J) Mean number of SSDs per synapse for gephyrin and GABAARs derived from confocal, SIM, and STED images. ****p < 0.0001 (Kruskal-Wallis); n = 54/220/37 synapses. Data are represented as mean ± SEM. (K) Boxplots of individual SSD area for gephyrin and GABAARs derived from confocal, SIM, and STED images. ****p < 0.0001 (Kruskal-Wallis); n = 54/220/37 synapses. Cross denotes mean; horizontal line denotes median. (L) Boxplots of SSD diameter for gephyrin and GABAARs derived from SIM and STED images. ****p < 0.0001 (Kruskal-Wallis); n = 54/220/37 synapses. Cross denotes mean; horizontal line denotes median. See also Figure S1.
Figure 3.
Figure 3.. Gephyrin SSDs Cluster Synaptic GABAAR SSDs
(A) Boxplot comparing gephyrin and GABAAR individual SSD volumes n.s. (Mann-Whitney); n = 220 synapses. Cross denotes mean; horizontal line denotes median. (B) Correlation plot of mean GABAAR SSD volume and gephyrin SSD volume per synapse. n = 220 synapses. (C) Correlation plot of mean VGAT SSD volume and gephyrin SSD volume per synapse. n = 220 synapses. (D) Correlation plot of mean VGAT SSD volume and GABAAR SSD volume per synapse. n = 220 synapses. (E) Maximum projection SIM images of hippocampal inhibitory synapses and object masks generated by segmentation analysis. Arrowheads point to regions of overlap between gephyrin and GABAAR SSDs. Numbers denote number of SSDs in compartment. (F) Object segmentation mask showing 3D SSD overlap and center-to-center distance between SSDs. (G) Mean overlap fraction for gephyrin, GABAARs, and VGAT. ****p < 0.0001 (Kruskal-Wallis, Dunn’s post hoc); n = 220 synapses. Data are represented as mean ± SEM. (H) Mean percentage of overlapping SSDs. ****p < 0.0001 (Kruskal-Wallis, Dunn’s post hoc); n = 38–40 cells. Data are represented as mean ± SEM. (I) Boxplot of center-to-center distances between neighboring SSDs. ****p < 0.0001 (Kruskal-Wallis, Dunn’s post hoc); n = 290–340 SSDs. Cross denotes mean; horizontal line denotes median. (J) Correlation plots of mean compartment volumes for GABAAR, gephyrin, and VGAT. n = 220 synapses. (K) Mean SSD number per GABAAR or VGAT compartment for gephyrin compartments with 1, 2, or R3 SSDs per compartment. Gephyrin/GABAAR, ****p < 0.0001; gephyrin/VGAT, p = 0.236 (Kruskal-Wallis, Dunn’s post hoc); n = 220 synapses. Data are represented as mean ± SEM. (L) Mean SSD number per GABAAR or VGAT compartment for a range of gephyrin compartment volumes. Gephyrin/GABAAR, **p < 0.0073; gephyrin/VGAT, p = 0.755 (Kruskal-Wallis, Dunn’s post hoc); n = 220 synapses. Data are represented as mean ± SEM. (M) Mean SSD number per gephyrin or VGAT compartment for a range of GABAAR compartment volumes. GABAAR/gephyrin ***p < 0.0003; GABAAR /VGAT, p = 0.237 (Kruskal-Wallis, Dunn’s post hoc); n = 220 synapses. Data are represented as mean ± SEM. See also Figure S2.
Figure 4.
Figure 4.. Disruption of Gephyrin SSDs Reduces GABAAR Nanoscale Subsynaptic Clustering
(A) Maximum projection SIM images of inhibitory synapses from GFP control and GFP-gephyrin-DN expressing hippocampal neurons. Arrowheads indicate SSDs. (B) Boxplots of compartment volumes for gephyrin and GABAARs in control and GFP-gephyrin-DN conditions. ****p < 0.0001 and *p < 0.020 (Mann-Whitney tests); n = 73–79 synapses. Cross denotes mean; horizontal line denotes median. (C) Mean number of SSDs per compartment for gephyrin and GABAARs in GFP control and GFP-gephyrin-DN conditions. ****p < 0.0001 (Mann-Whitney tests); n = 73–79 synapses. Data are represented as mean ± SEM. (D) Boxplots of individual SSD volumes for gephyrin and GABAARs in GFP control and GFP-gephyrin-DN conditions. n.s. (Mann-Whitney tests); n = 73–79 synapses. Cross denotes mean; horizontal line denotes median. (E) Correlation plot of mean gephyrin compartment volume and GABAAR compartment volume per synapse in GFP-gephyrin-DN neurons. n = 79 synapses. (F) Correlation plot of mean gephyrin SSD volume and GABAAR SSD volume per synapse in GFP-gephyrin-DN neurons. n = 79 synapses.
Figure 5.
Figure 5.. GABAAR SSDs Correlate with Active-Zone RIM SSDs
(A) Maximum projection SIM images of VGAT and RIM-labeled inhibitory synapses. (B) Mean number of SSDs per compartment for VGAT and RIM. **p < 0.0026 (Mann-Whitney tests); n = 127 synapses. Data are represented as mean ± SEM. (C) Boxplot of individual SSD volumes for VGAT and RIM ****p < 0.0001 (Mann-Whitney tests); n = 127 synapses. Cross denotes mean; horizontal line denotes median. (D) Boxplot of compartment volumes for VGAT and RIM. ****p < 0.0001 (Mann-Whitney tests); n = 127 synapses. Cross denotes mean; horizontal line denotes median. (E) Correlation plot of VGAT compartment volume and RIM compartment volume per synapse; n = 127 synapses. (F) Correlation plot of VGAT individual SSD volume and RIM individual SSD volume per synapse; n = 127 synapses. (G) Mean SSD number per RIM compartment for VGAT compartments with 1, 2, or ≥3 SSDs per compartment and vice versa. n.s. (Kruskal-Wallis, Dunn’s post hoc); n = 127 synapses. Data are represented as mean ± SEM. (H) Maximum projection SIM images of gephyrin, GABAAR, and RIM-labeled inhibitory synapses. (I) Mean RIM SSD number per gephyrin or GABAAR compartments with 1, 2, or ≥3 SSDs per compartment. ****p < 0.0001 (Kruskal-Wallis, Dunn’s post hoc); n = 180 synapses. Data are represented as mean ± SEM. (J) Mean GABAAR or gephyrin SSD number per RIM compartments with 1, 2, or ≥3 SSDs per compartment. RIM/GABAAR, ****p < 0.0001; RIM/gephyrin, p = 0.301 (Kruskal-Wallis, Dunn’s post hoc); n = 180 synapses. Data are represented as mean ± SEM. (K) 3D and 2D rendering of example inhibitory synapse with 2 SSDs of gephyrin, GABAAR, and RIM (μm). Stars denote maximum intensity point within each SSD. (L) Frequency distribution of experimental and randomized nearest neighbor distances. (M) Boxplot of nearest neighbor distance for randomized and experimental datasets. ****p < 0.0001 (Mann-Whitney test); n = 146 RIM/GABAAR SSDs. Cross denotes mean; horizontal line denotes median. (N) Cartoon showing nearest neighbor distances between maximum intensity points within GABAAR and RIM SSDs in geometrically paired and unpaired SSD synapses. (O) Bar graph showing percentage of paired RIM and GABAAR SSDs per synapse in randomized and experimental datasets. ****p < 0.0001 (Mann-Whitney test); n = 121 synapses. Data are represented as mean ± SEM. (P). Mean volume of synapses with 1, 2, or ≥3 RIM/GABAAR SSD pairs per synapse. **p < 0.0019 (Kruskal-Wallis, Dunn’s post hoc); n = 121 synapses. Data are represented as mean ± SEM. (Q) Mean number of RIM/GABAAR SSD pairs per synapse for a range of synapse volumes. ***p < 0.0004 (Kruskal-Wallis, Dunn’s post hoc); n = 121 synapses. Data are represented as mean ± SEM. See also Figure S3.
Figure 6.
Figure 6.. SSDs Are Building Blocks of the Inhibitory Postsynaptic Domain
(A) Mean number of SSDs per compartment for a range of gephyrin and GABAAR compartment sizes. ****p < 0.0001 (Kruskal-Wallis, Dunn’s post hoc); n = 220 synapses. Data are represented as mean ± SEM. (B) Mean compartment volume for gephyrin and GABAAR compartments with 1, 2, or ≥3 SSDs per compartment. ****p < 0.0001 (Kruskal-Wallis, Dunn’s post hoc); n = 220 synapses. Cross denotes mean; horizontal line denotes median. (C) Correlation plot of number of PSD SSDs versus PSD volume from SIM images. n = 220 synapses. (D) Correlation plot of number of PSD SSDs versus PSD volume from STED images. n = 37 synapses. (E) Maximum projection SIM images of hippocampal inhibitory synapses from neurons treated with 10 μm bicuculline (Bic; 24 h) or control conditions. (F) Boxplot of compartment volumes for PSD, gephyrin, and GABAAR compartments in control and Bic conditions. PSD, **p = 0.037; gephyrin, **p = 0.0084; GABAARs, **p = 0.0052 (Mann-Whitney); n = 85/98 synapses. Cross denotes mean; horizontal line denotes median. (G) Mean SSD number per compartment for control and Bic conditions. Gephyrin, ****p < 0.0001; GABAARs, **p = 0.001 (Mann-Whitney); n = 85/98 synapses. Data are represented as mean ± SEM. (H) Boxplot of mean individual SSD volume per synapse. Gephyrin, p** < 0.0051; GABAARs, p* = 0.040 (Mann-Whitney); n = 85/98 synapses. Cross denotes mean; horizontal line denotes median. (I) Correlation plot of number of PSD SSDs versus PSD volume for synapses from bicuculline condition. n = 98 synapses. (J) Maximum projection SIM images of gephyrin intrabody (Geph.FingR-GFP) acquired live in control or bicuculline treated conditions. Numbers denote number of SSDs in compartment. (K) Graph summarizing gephyrin SSD number over time in control or Bic conditions. ****p < 0.0001 and **p < 0.01 (two-way ANOVA with Sidak’s post hoc test); n = 73/48 synapses. Data are represented as mean ± SEM. See also Figure S4.

Similar articles

Cited by

References

    1. Ball G, Demmerle J, Kaufmann R, Davis I, Dobbie IM, and Schermelleh L (2015). SIMcheck: a toolbox for successful super-resolution structured illumination microscopy. Sci. Rep 5, 15915. - PMC - PubMed
    1. Biederer T, Kaeser PS, and Blanpied TA (2017). Transcellular nanoalignment of synaptic function. Neuron 96, 680–696. - PMC - PubMed
    1. Blundell J, Tabuchi K, Bolliger MF, Blaiss CA, Brose N, Liu X, Südhof TC, and Powell CM (2009). Increased anxiety-like behavior in mice lacking the inhibitory synapse cell adhesion molecule neuroligin 2. Genes Brain Behav 8, 114–126. - PMC - PubMed
    1. Bourne JN, and Harris KM (2011). Coordination of size and number of excitatory and inhibitory synapses results in a balanced structural plasticity along mature hippocampal CA1 dendrites during LTP. Hippocampus 21, 354–373. - PMC - PubMed
    1. Bowen AB, Bourke AM, Hiester BG, Hanus C, and Kennedy MJ (2017). Golgi-independent secretory trafficking through recycling endosomes in neuronal dendrites and spines. eLife 6, e27362. - PMC - PubMed

Publication types