. 2019 Mar 19;26(12):3429-3443.e3.
doi: 10.1016/j.celrep.2019.02.081.

Multi-dimensional Transcriptional Remodeling by Physiological Insulin In Vivo

Affiliations

Multi-dimensional Transcriptional Remodeling by Physiological Insulin In Vivo

Thiago M Batista et al. Cell Rep. .

Abstract

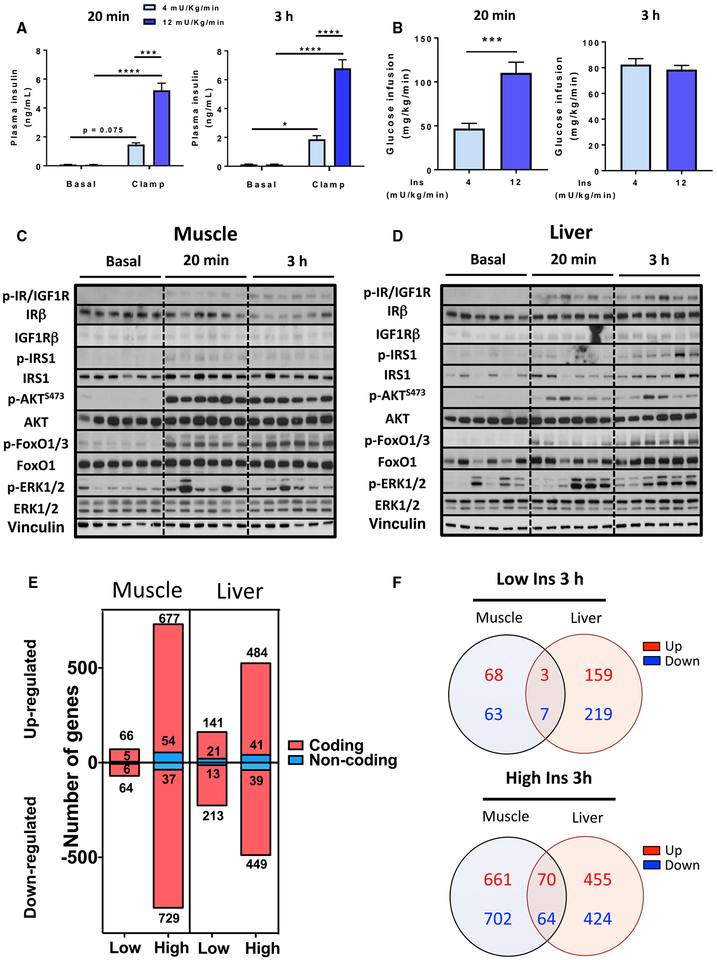
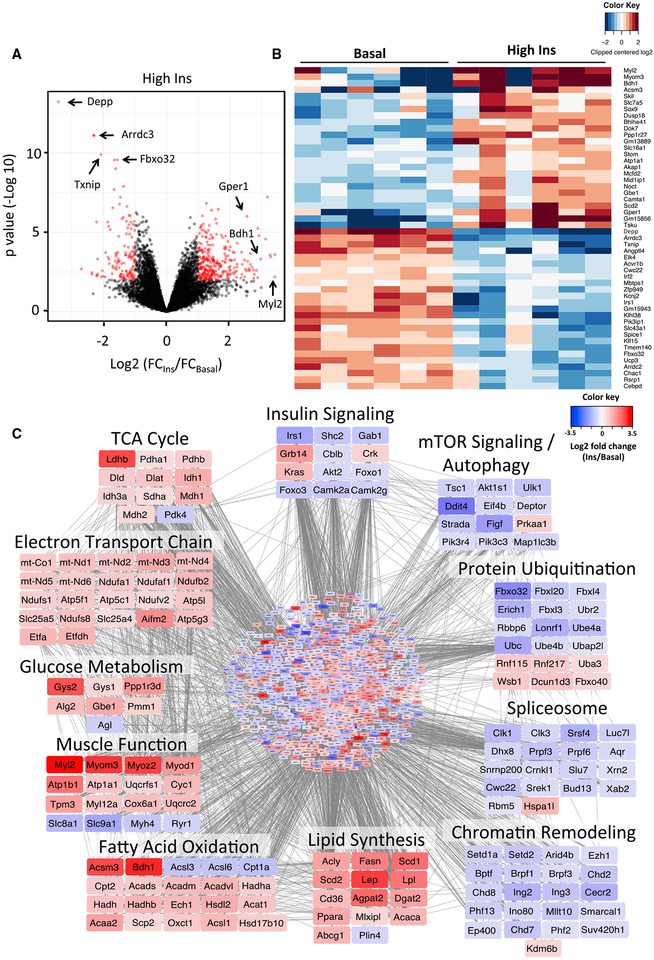
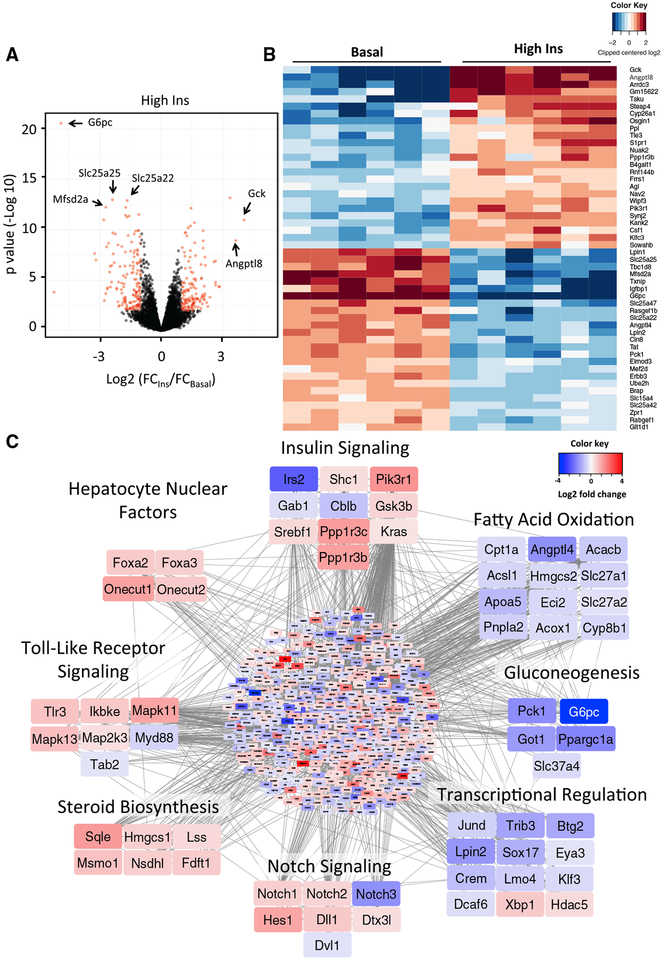
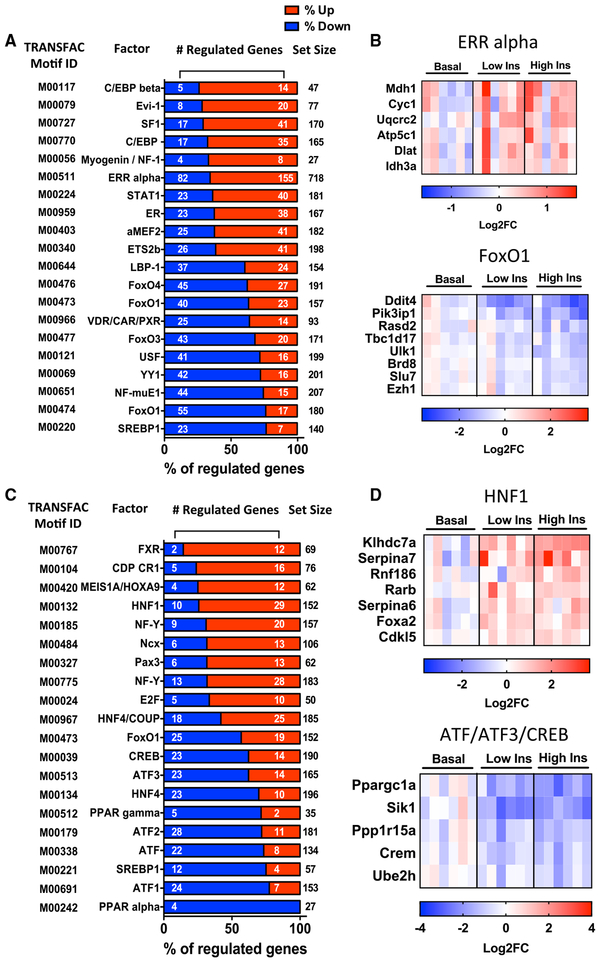
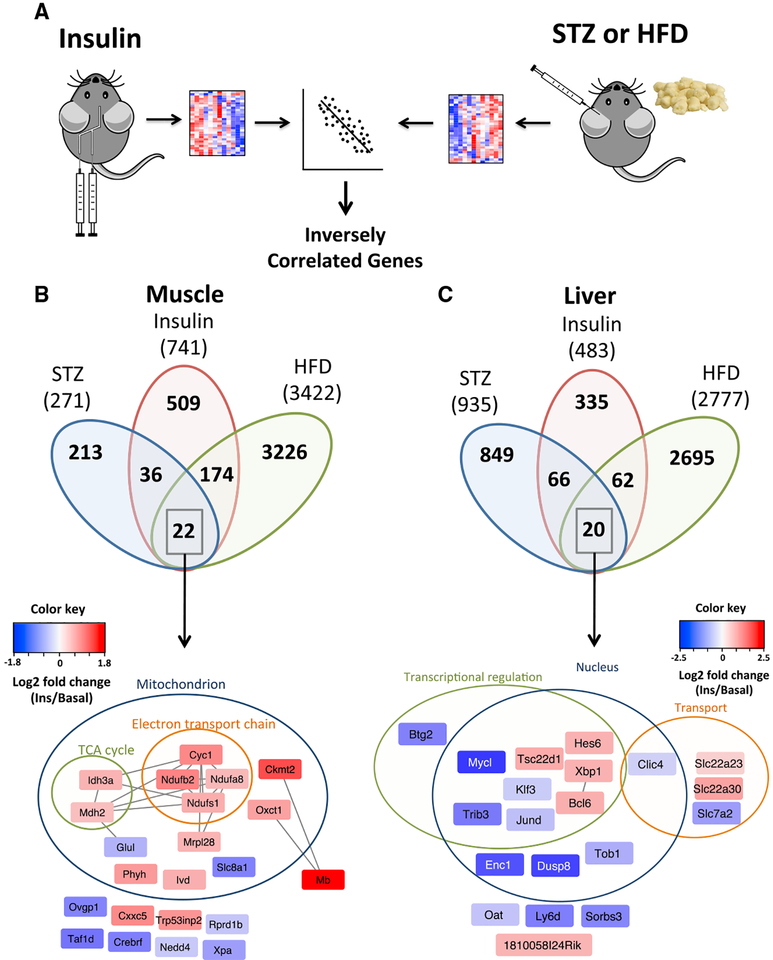
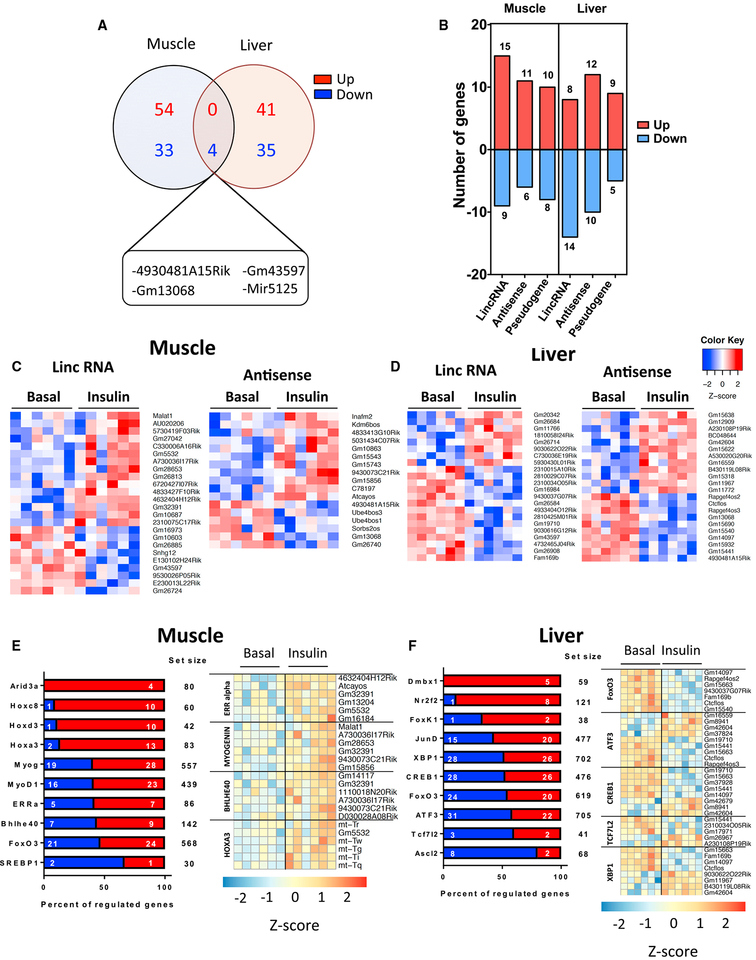
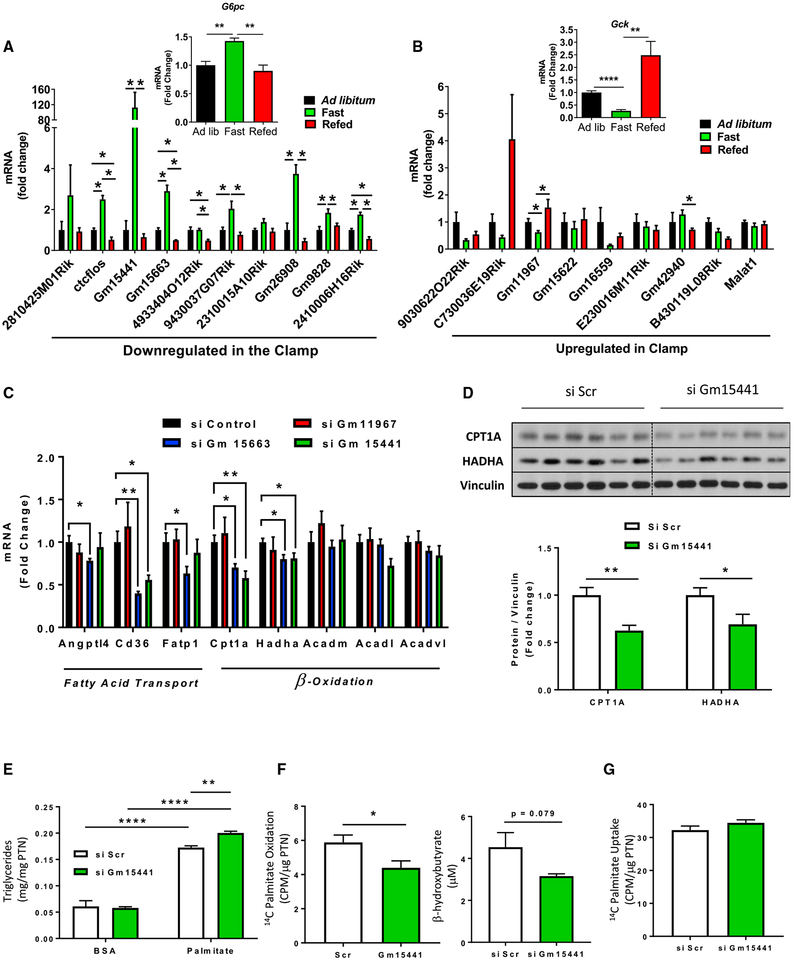
Regulation of gene expression is an important aspect of insulin action but in vivo is intertwined with changing levels of glucose and counter-regulatory hormones. Here we demonstrate that under euglycemic clamp conditions, physiological levels of insulin regulate interrelated networks of more than 1,000 transcripts in muscle and liver. These include expected pathways related to glucose and lipid utilization, mitochondrial function, and autophagy, as well as unexpected pathways, such as chromatin remodeling, mRNA splicing, and Notch signaling. These acutely regulated pathways extend beyond those dysregulated in mice with chronic insulin deficiency or insulin resistance and involve a broad network of transcription factors. More than 150 non-coding RNAs were regulated by insulin, many of which also responded to fasting and refeeding. Pathway analysis and RNAi knockdown revealed a role for lncRNA Gm15441 in regulating fatty acid oxidation in hepatocytes. Altogether, these changes in coding and non-coding RNAs provide an integrated transcriptional network underlying the complexity of insulin action.

Keywords: diabetes; fatty acid oxidation; gene expression; insulin action; liver; mitochondria; non-coding RNAs; skeletal muscle.


Conflict of interest statement

DECLARATION OF INTERESTS

The authors declare no competing interests.

Figures

Figure 1.
Figure 1.. Euglycemic Clamp, Insulin Signaling, and Gene Expression in Muscle and Liver
(A) Plasma insulin levels before and after hyperinsulinemic-euglycemic clamp with 4 or 12 mU/kg/min insulin infusion for 20 min or 3 h (n = 2–4). Data are mean ± SEM (n = 6), *p < 0.05, ***p < 0.01, ****p < 0.0001, two-way ANOVA. (B) Glucose infusion rates indicated as average of t = 10–15 min for the 20 min clamp and t = 120–150 min for the 3 h clamp. ***p < 0.001, Student’s t test. Data are mean ± SEM. (C and D) Insulin signaling in (C) muscle and (D) liver from mice infused with high insulin for 20 min or 3 h (n = 6). For basal levels, 3 samples from saline-infused mice at each time point were used. See also Figure S1. (E) Number of regulated genes by low- and high-dose insulin at 3 h (FDR < 0.1). (F) Venn diagrams of tissue-specific and overlapping genes regulated by low and high insulin. See also Table S1.
Figure 2.
Figure 2.. Insulin Regulation of Gene Expression in Skeletal Muscle
(A) Volcano plot showing distribution of differentially expressed genes (in red) by high insulin at 3 h compared to basal on the log2 scale. (B) Heatmap showing the top 50 insulin-regulated genes. See also Figure S2. (C) Network of predicted protein-protein interactions from STRING analysis (Szklarczyk et al., 2017) using insulin-regulated genes in muscle as input. 1,406 nodes and 6,369 interactions were detected (p < 1 × 10⁻¹⁶). Colors of nodes represent log2 fold change values of insulin regulation. See also Figure S3 and Tables S2 and S3.
Figure 3.
Figure 3.. Insulin Regulation of Gene Expression in Liver
(A) Volcano plot showing distribution of differentially expressed genes (in red) in liver by high insulin at 3 h compared to basal on the log2 scale. (B) Heatmap showing the top 50 insulin-regulated genes. See also Figure S2. (C) Network of predicted protein-protein interactions from STRING analysis (Szklarczyk et al., 2017) using insulin-regulated genes in liver as input. 933 nodes and 2,895 interactions were detected (p < 1 × 10⁻¹⁶). Colors of nodes represent log2 fold change values of insulin regulation. See also Figure S3 and Table S2.
Figure 4.
Figure 4.. Transcription Factor Motifs Enriched in Insulin-Regulated Genes in Muscle and Liver
(A and C) Overrepresented transcription factor motifs within 2 kb of TSS in (A) muscle and (C) liver. Plots are percentages of predicted target genes that are significantly up- or downregulated by insulin (FDR < 0.1). Enrichment analysis was performed using data from low and high insulin samples combined (n = 12). (B) Examples of genes in muscle showing enrichment for ERRα (top) and FOXO1 (bottom) binding motifs. (D) Examples of genes in liver showing enrichment for HNF1 (top) and ATF protein (BATF, ATF3, and CREB) (bottom) binding motifs. See also Figure S4.
Figure 5.
Figure 5.. Genes Inversely Regulated during the Euglycemic Insulin Clamp, STZ Diabetes, and HFD Obesity in Muscle and Liver
(A) Schematics of insulin clamp and STZ or HFD dataset comparisons. (B and C) Overlap of inversely correlated genes among insulin, STZ diabetes, and HFD obesity in muscle (B) and liver (C). Genes representing the overlap of all conditions grouped by functional annotation and cellular localization are indicated. Edges represent predicted protein-protein interactions from STRING. Colors of nodes are log2 fold change values of regulation by insulin. See also Table S4.
Figure 6.
Figure 6.. Regulation of Non-coding RNA Species by Insulin
(A) Venn diagrams of tissue-specific and overlapping ncRNAs regulated by high insulin at 3 h. (B) Number of insulin-regulated lncRNAs across three main categories: lincRNA, antisense RNAs, and pseudogenes in muscle and liver. (C and D) Heatmaps of top lncRNAs regulated in muscle (C) and liver (D) by high insulin at 3 h. See also Figure S5. (E and F) Overrepresented transcription factor motifs within 2 kb upstream and 0.2 kb downstream of TSS and example ncRNAs for selected factors in (E) muscle and (F) liver. Plots are percentages of predicted target genes that are significantly up- or downregulated by a high insulin dose (FDR < 0.1).
Figure 7.
Figure 7.. Physiological Regulation and Effect of lncRNA Gm15441 Knockdown on Fatty Acid Oxidation
(A and B) Expression of (A) downregulated and (B) upregulated lncRNAs by insulin in the clamp in livers of 14- to 16-week-old ad libitum fed, overnight fasted, and 8 h refed mice. Gene expression was normalized to TBP. Data are means ± SEM, n = 4–5, *p < 0.05, **p < 0.01, ****p < 0.0001, one-way ANOVA. (C and D) qPCR analysis of genes involved in lipid transport and oxidation normalized to 18S (C) and CPT1A and HADHA protein levels normalized to vinculin in mouse primary hepatocytes 24 h after transfection with siRNAs against of Gm11967, Gm15663, and Gm15441 (D). Data are means ± SEM. Hepatocyte cultures from 4–5 mice were used. *p < 0.05, **p < 0.01, Student’s t test. See also Tables S5 and S6. (E) Intracellular triglyceride accumulation in AML-12 hepatocytes treated with 500 μM palmitic acid or vehicle for 8 h. (F and G) 14C palmitic acid oxidation and β-hydroxybutyrate levels in culture supernatants (F) and 14C palmitic acid uptake in AML-12 hepatocytes (G). Lipid metabolism was assessed 24–36 h after transfection with siRNAs against Gm15441 or scramble controls. Data are means ± SEM, n = 5–6 biological replicates, *p < 0.05, **p < 0.01, ****p < 0.0001, Student’s t test. See also Figures S6 and S7.

References

    1. Abdulla H, Smith K, Atherton PJ, and Idris I (2016). Role of insulin in the regulation of human skeletal muscle protein synthesis and breakdown: a systematic review and meta-analysis. Diabetologia 59, 44–55. - PubMed
    1. Akie TE, and Cooper MP (2015). Determination of Fatty Acid Oxidation and Lipogenesis in Mouse Primary Hepatocytes. J. Vis. Exp 102, e52982. - PMC - PubMed
    1. Almind K, and Kahn CR (2004). Genetic determinants of energy expenditure and insulin resistance in diet-induced obesity in mice. Diabetes 53, 3274–3285. - PubMed
    1. Andrikopoulos S, Blair AR, Deluca N, Fam BC, and Proietto J (2008). Evaluating the glucose tolerance test in mice. Am. J. Physiol. Endocrinol. Metab 295, E1323–E1332. - PubMed
    1. Ayala JE, Bracy DP, McGuinness OP, and Wasserman DH (2006). Considerations in the design of hyperinsulinemic-euglycemic clamps in the conscious mouse. Diabetes 55, 390–397. - PubMed

Publication types