

Global Need for Physical Rehabilitation: Systematic Analysis from the Global Burden of Disease Study 2017
- PMID: 30893793
- PMCID: PMC6466363
- DOI: 10.3390/ijerph16060980
Global Need for Physical Rehabilitation: Systematic Analysis from the Global Burden of Disease Study 2017
Erratum in
-
Erratum: Jesus, T.S., et al. Global Need for Physical Rehabilitation: Systematic Analysis from the Global Burden of Disease Study 2017. Int. J. Environ. Res. Public Health 2019, 16, 980.Int J Environ Res Public Health. 2020 Dec 4;17(23):9065. doi: 10.3390/ijerph17239065. Int J Environ Res Public Health. 2020. PMID: 33291861 Free PMC article.
Abstract
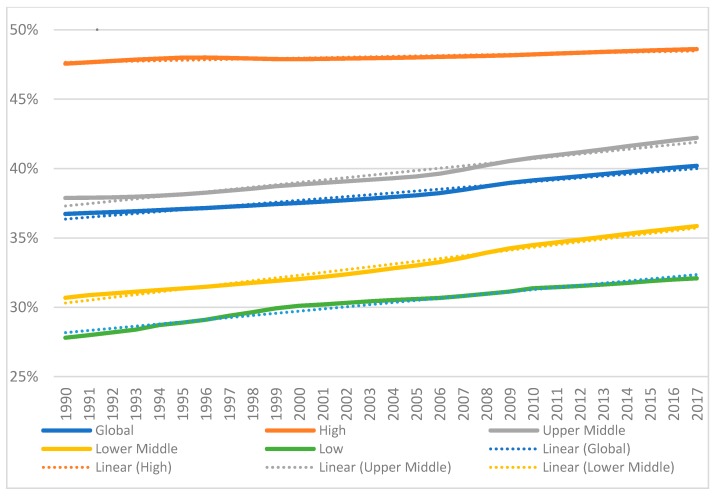
Background: To inform global health policies and resources planning, this paper analyzes evolving trends in physical rehabilitation needs, using data on Years Lived with Disability (YLDs) from the Global Burden of Disease Study (GBD) 2017. Methods: Secondary analysis of how YLDs from conditions likely benefiting from physical rehabilitation have evolved from 1990 to 2017, for the world and across countries of varying income levels. Linear regression analyses were used. Results: A 66.2% growth was found in estimated YLD Counts germane to physical rehabilitation: a significant and linear growth of more than 5.1 billion YLDs per year (99% CI: 4.8⁻5.4; r² = 0.99). Low-income countries more than doubled (111.5% growth) their YLD Counts likely benefiting from physical rehabilitation since 1990. YLD Rates per 100,000 people and the percentage of YLDs likley benefiting from physical rehabilitation also grew significantly over time, across locations (all p > 0.05). Finally, only in high-income countries did Age-standardized YLD Rates significantly decrease (p < 0.01; r² = 0.86). Conclusions: Physical rehabilitation needs have been growing significantly in absolute, per-capita and in percentage of total YLDs. This growth was found globally and across countries of varying income level. In absolute terms, growths were higher in lower income countries, wherein rehabilitation is under-resourced, thereby highlighting important unmet needs.
Keywords: disability; global burden of disease; global health; health services needs and demand; rehabilitation.
Conflict of interest statement
The authors declare no conflict of interest.
Figures
References
-
- World Health Organization and World Bank . World Report on Disability. WHO; Geneva, Switzerland: 2011.
-
- World Health Organization . World Report on Ageing and Health. WHO; Geneva, Switzerland: 2015.
-
- GBD 2016 DALYs and HALE Collaborators Global, regional, and national disability-adjusted life-years (DALYs) for 333 diseases and injuries and healthy life expectancy (HALE) for 195 countries and territories, 1990–2016: A systematic analysis for the Global Burden of Disease Study 2016. Lancet. 2017;390:1260–1344. doi: 10.1016/S0140-6736(17)32130-X. - DOI - PMC - PubMed
-
- GBD 2016 Disease and Injury Incidence and Prevalence Collaborators Global, regional, and national incidence, prevalence, and years lived with disability for 328 diseases and injuries for 195 countries, 1990–2016: A systematic analysis for the Global Burden of Disease Study 2016. Lancet. 2017;390:1211–1259. doi: 10.1016/S0140-6736(17)32154-2. - DOI - PMC - PubMed
MeSH terms
LinkOut - more resources
Full Text Sources
Medical
