

Methods and Challenges of Using the Greater Wax Moth (Galleria mellonella) as a Model Organism in Antimicrobial Compound Discovery
- PMID: 30893839
- PMCID: PMC6463077
- DOI: 10.3390/microorganisms7030085
Methods and Challenges of Using the Greater Wax Moth (Galleria mellonella) as a Model Organism in Antimicrobial Compound Discovery
Abstract
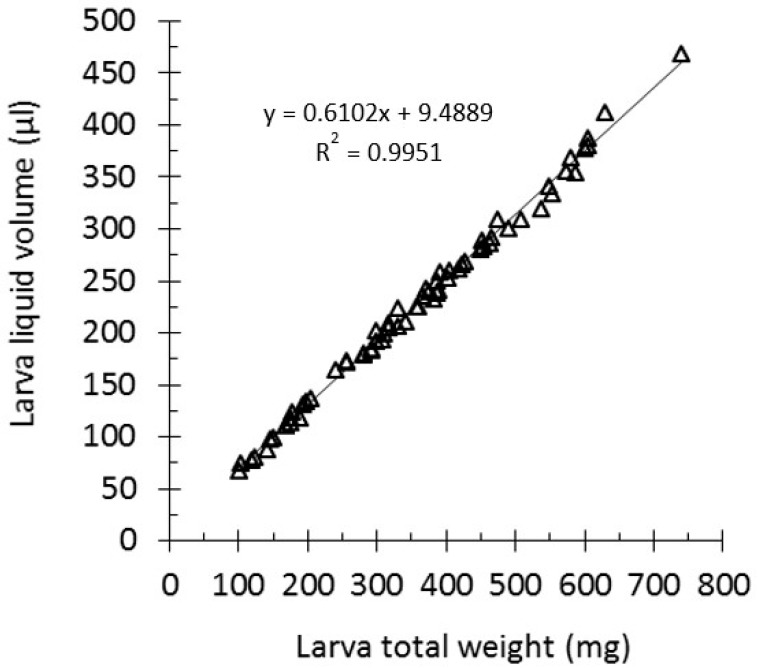
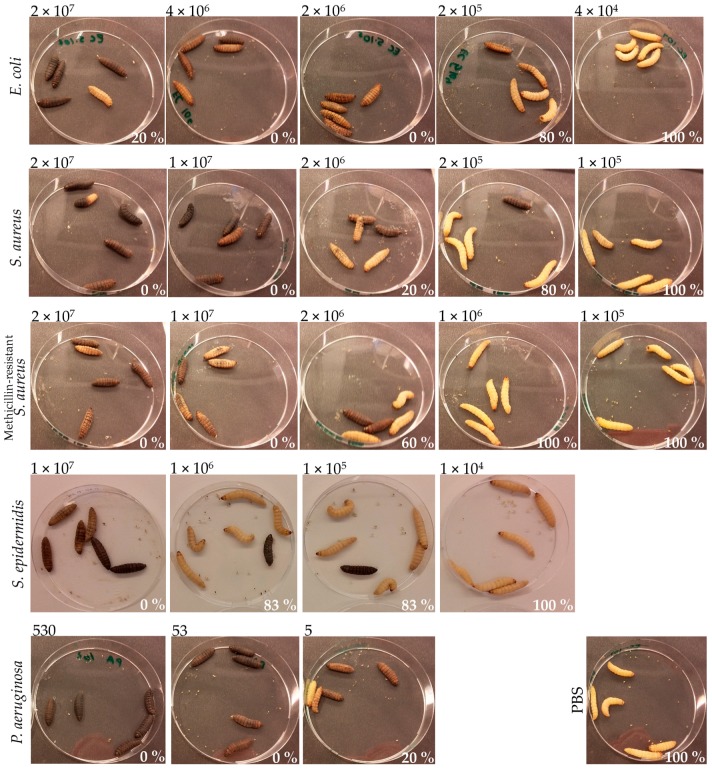
Among non-mammalian infection model organisms, the larvae of the greater wax moth Galleria mellonella have seen increasing popularity in recent years. Unlike other invertebrate models, these larvae can be incubated at 37 °C and can be dosed relatively precisely. Despite the increasing number of publications describing the use of this model organism, there is a high variability with regard to how the model is produced in different laboratories, with respect to larva size, age, origin, storage, and rest periods, as well as dosing for infection and treatment. Here, we provide suggestions regarding how some of these factors can be approached, to facilitate the comparability of studies between different laboratories. We introduce a linear regression curve correlating the total larva weight to the liquid volume in order to estimate the in vivo concentration of pathogens and the administered drug concentration. Finally, we discuss several other aspects, including in vivo antibiotic stability in larvae, the infection doses for different pathogens and suggest guidelines for larvae selection.
Keywords: Galleria mellonella; antimicrobial compound; infection model; invertebrate model.
Conflict of interest statement
The authors declare no conflict of interest.
Figures


Similar articles
-
Utility of Greater Wax Moth Larva (Galleria mellonella) for Evaluating the Toxicity and Efficacy of New Antimicrobial Agents.Adv Appl Microbiol. 2012;78:25-53. doi: 10.1016/B978-0-12-394805-2.00002-6. Adv Appl Microbiol. 2012. PMID: 22305092
-
Wax moth larva (Galleria mellonella): an in vivo model for assessing the efficacy of antistaphylococcal agents.J Antimicrob Chemother. 2011 Aug;66(8):1785-90. doi: 10.1093/jac/dkr198. Epub 2011 May 28. J Antimicrob Chemother. 2011. PMID: 21622972
-
The microbiome of the invertebrate model host Galleria mellonella is dominated by Enterococcus.Anim Microbiome. 2019 Sep 3;1(1):7. doi: 10.1186/s42523-019-0010-6. Anim Microbiome. 2019. PMID: 33499945 Free PMC article.
-
Galleria mellonella L. as model organism used in biomedical and other studies.Przegl Epidemiol. 2018;72(1):57-73. Przegl Epidemiol. 2018. PMID: 29667381 Review.
-
Galleria mellonella: The Versatile Host for Drug Discovery, In Vivo Toxicity Testing and Characterising Host-Pathogen Interactions.Antibiotics (Basel). 2021 Dec 17;10(12):1545. doi: 10.3390/antibiotics10121545. Antibiotics (Basel). 2021. PMID: 34943757 Free PMC article. Review.
Cited by
-
A Systematic Review on Viruses in Mass-Reared Edible Insect Species.Viruses. 2021 Nov 15;13(11):2280. doi: 10.3390/v13112280. Viruses. 2021. PMID: 34835086 Free PMC article.
-
Could traces of fluoroquinolones in food induce ciprofloxacin resistance in Escherichia coli and Klebsiella pneumoniae? An in vivo study in Galleria mellonella with important implications for maximum residue limits in food.Microbiol Spectr. 2024 Jun 4;12(6):e0359523. doi: 10.1128/spectrum.03595-23. Epub 2024 Apr 30. Microbiol Spectr. 2024. PMID: 38687060 Free PMC article.
-
Acaricidal and insecticidal activities of entomopathogenic nematodes combined with rosemary essential oil and bacterium-synthesized silver nanoparticles against camel tick, Hyalomma dromedarii and wax moth, Galleria mellonella.PeerJ. 2025 Jan 14;13:e18782. doi: 10.7717/peerj.18782. eCollection 2025. PeerJ. 2025. PMID: 39830955 Free PMC article.
-
An Invertebrate Burn Wound Model That Recapitulates the Hallmarks of Burn Trauma and Infection Seen in Mammalian Models.Front Microbiol. 2020 Jun 3;11:998. doi: 10.3389/fmicb.2020.00998. eCollection 2020. Front Microbiol. 2020. PMID: 32582051 Free PMC article.
-
The design and implementation of restraint devices for the injection of pathogenic microorganisms into Galleria mellonella.PLoS One. 2020 Jul 30;15(7):e0230767. doi: 10.1371/journal.pone.0230767. eCollection 2020. PLoS One. 2020. PMID: 32730254 Free PMC article.
References
-
- Schmidt O., Theopold U., Beckage N.E. Insect and vertebrate immunity: Key similarities versus differences. In: Beckage N.E., editor. Insect Immunology. Elsevier; Amsterdam, The Netherlands: 2008. pp. 1–23. - DOI
-
- Müller U., Vogel P., Alber G., Schaub G. The innate immune system of mammals and insects. Contrib. Microbiol. 2008;15:21–44. - PubMed
-
- Kavanagh K., Reeves E.P. Insect and mammalian innate immune responses are much alike. Microbe. 2007;2:596–599. doi: 10.1128/microbe.2.596.1. - DOI
LinkOut - more resources
Full Text Sources
Other Literature Sources
