. 2019 Mar 19;11(3):275.
doi: 10.3390/v11030275.

Characterization of the Filovirus-Resistant Cell Line SH-SY5Y Reveals Redundant Role of Cell Surface Entry Factors

Affiliations

Characterization of the Filovirus-Resistant Cell Line SH-SY5Y Reveals Redundant Role of Cell Surface Entry Factors

Francisco J Zapatero-Belinchón et al. Viruses. .

Abstract

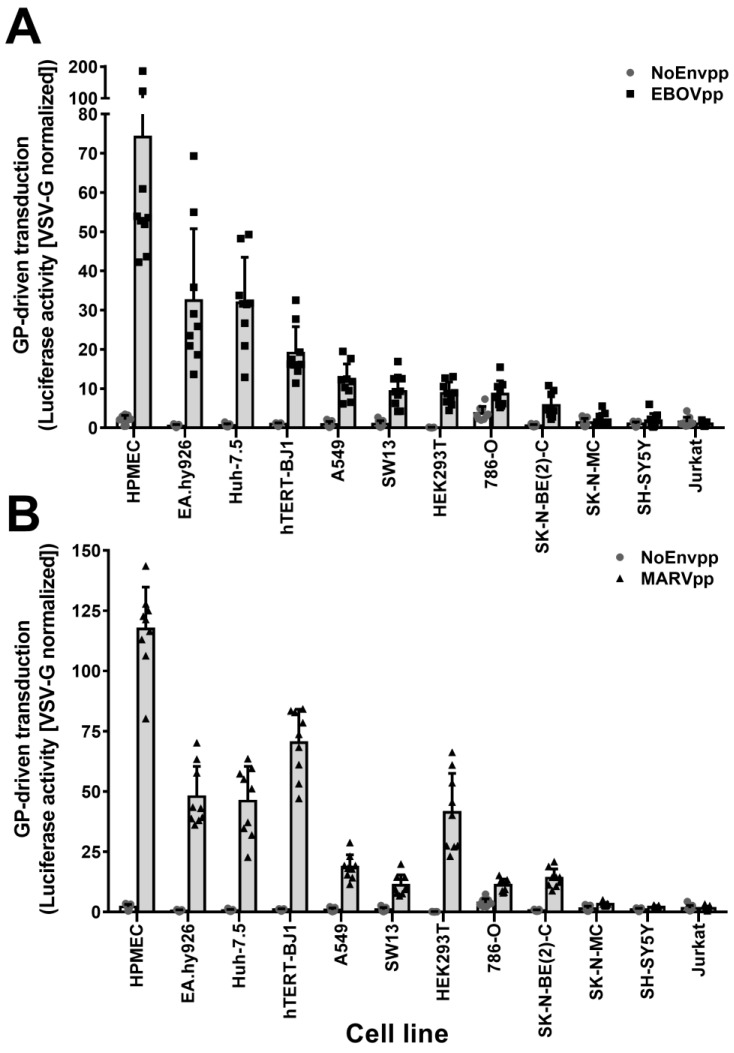
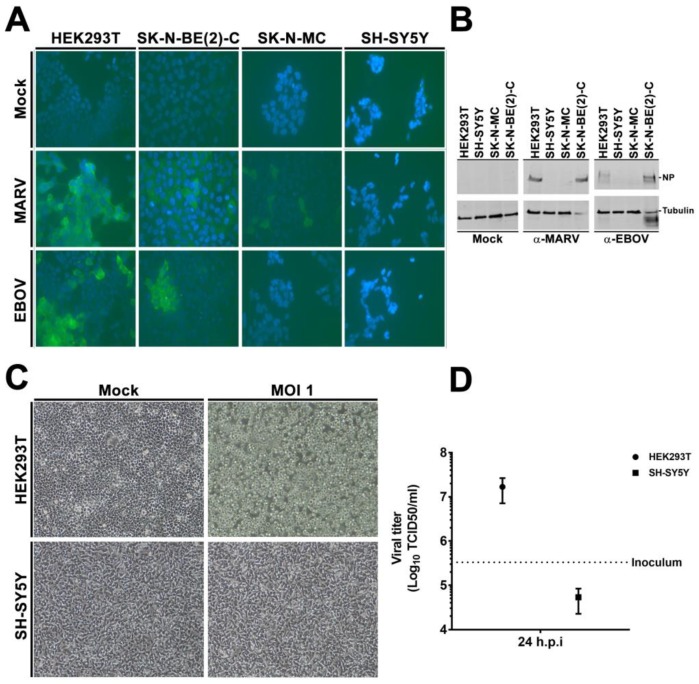
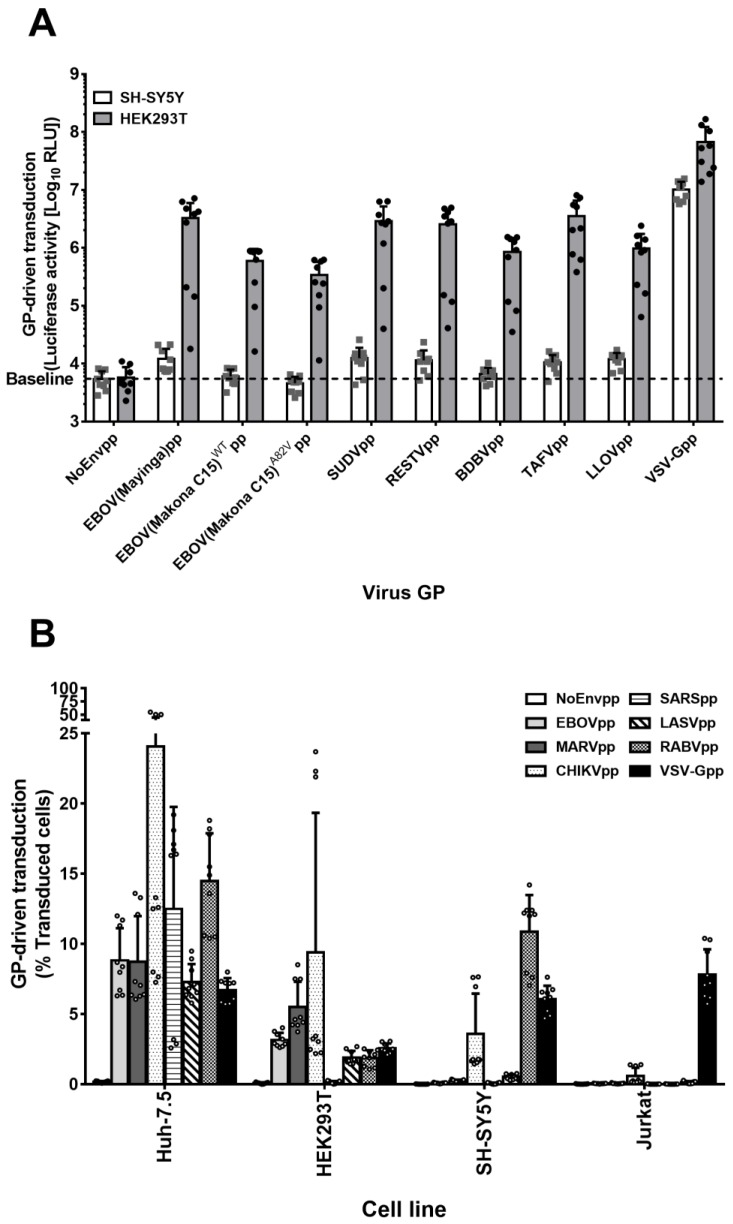
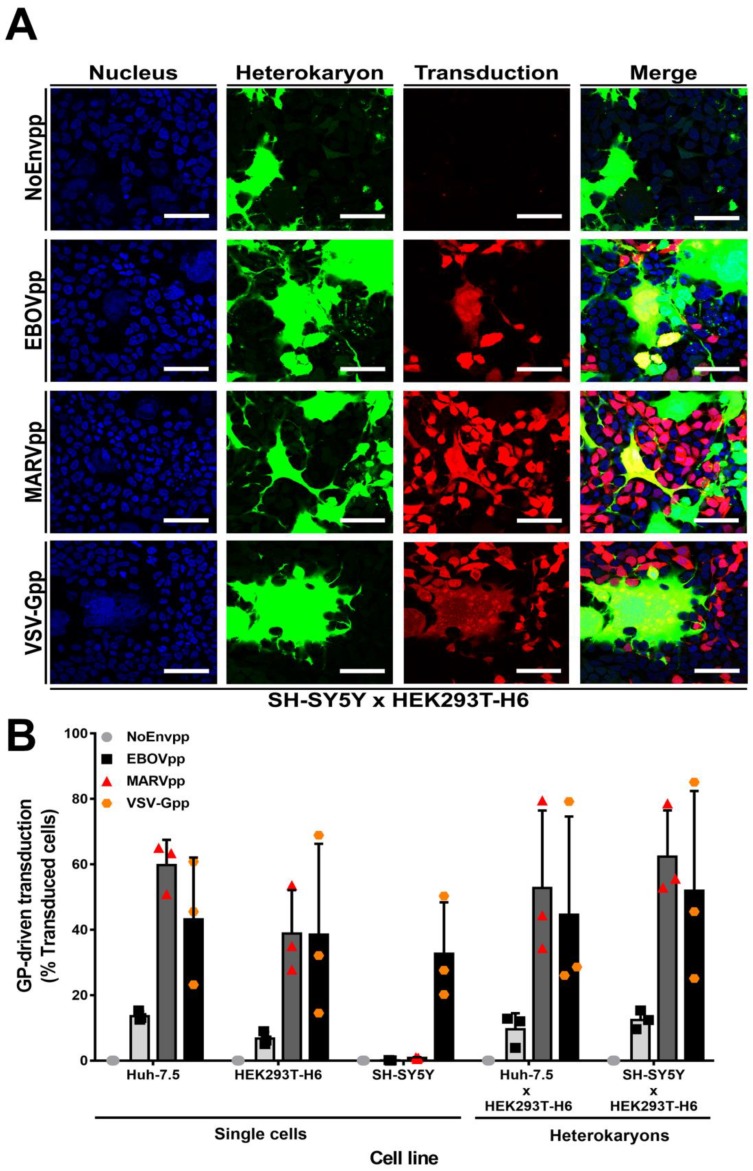
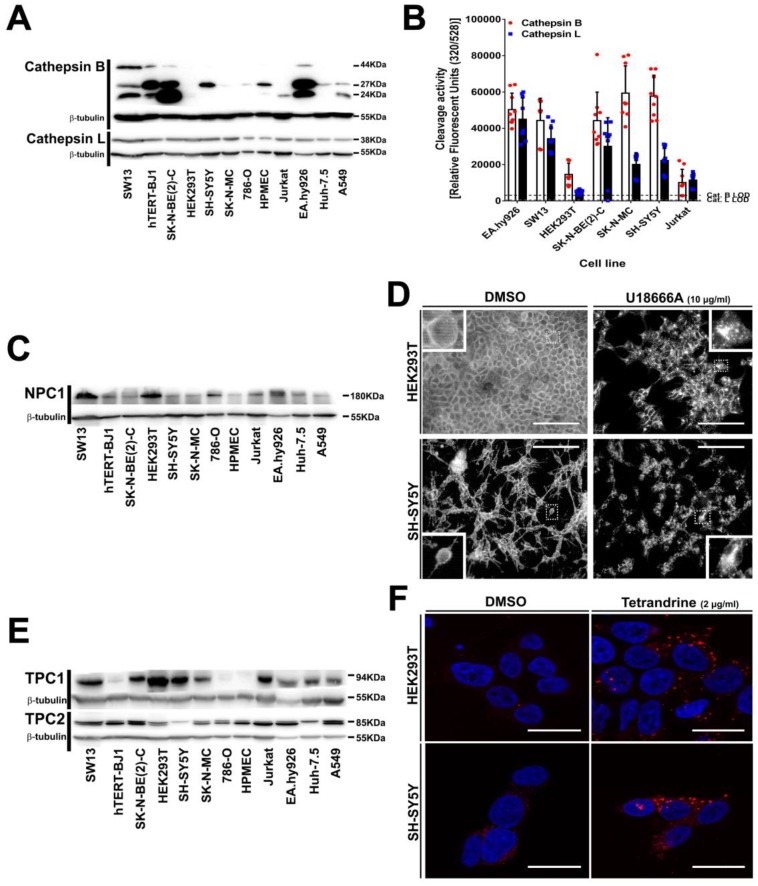
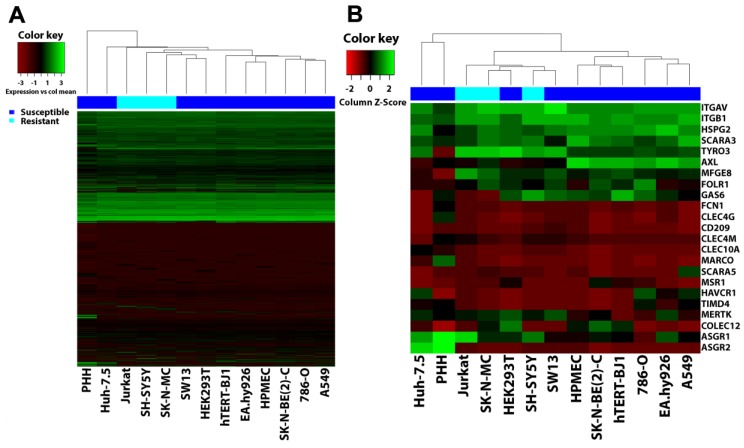
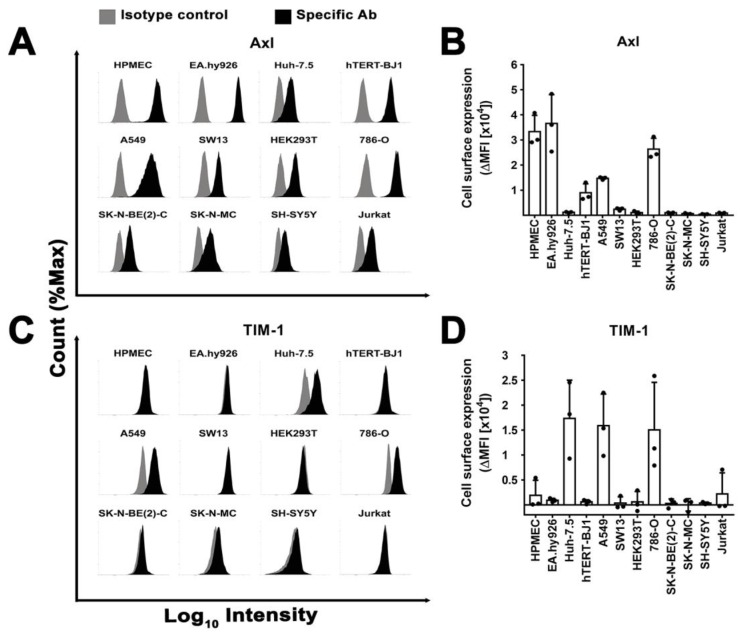
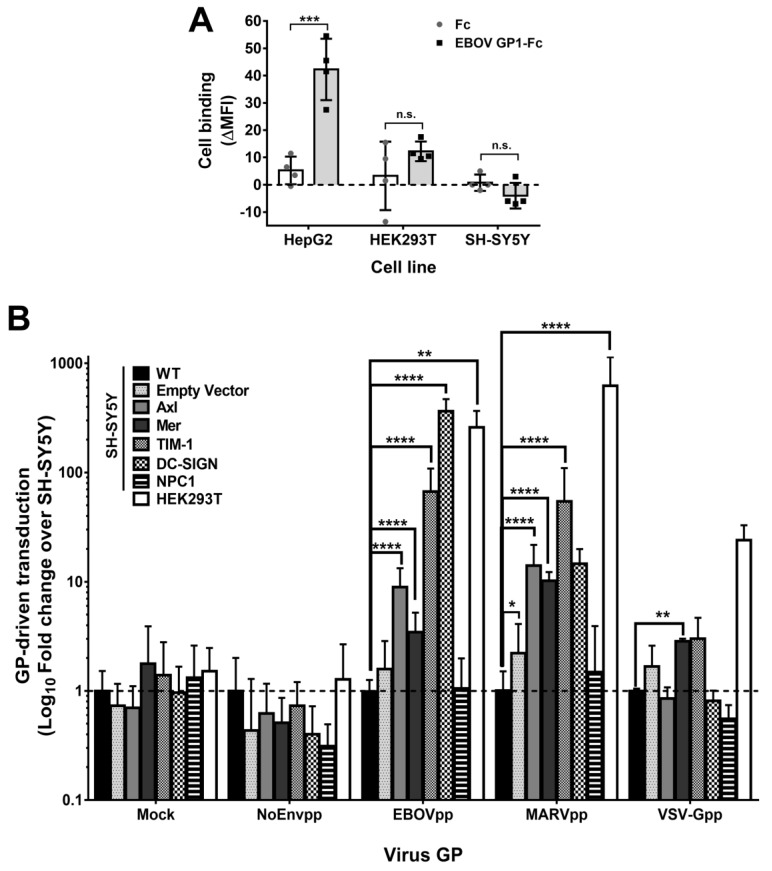
Filoviruses infect a wide range of cell types with the exception of lymphocytes. The intracellular proteins cathepsin B and L, two-pore channel 1 and 2, and bona fide receptor Niemann⁻Pick Disease C1 (NPC1) are essential for the endosomal phase of cell entry. However, earlier steps of filoviral infection remain poorly characterized. Numerous plasma membrane proteins have been implicated in attachment but it is still unclear which ones are sufficient for productive entry. To define a minimal set of host factors required for filoviral glycoprotein-driven cell entry, we screened twelve cell lines and identified the nonlymphocytic cell line SH-SY5Y to be specifically resistant to filovirus infection. Heterokaryons of SH-SY5Y cells fused to susceptible cells were susceptible to filoviruses, indicating that SH-SY5Y cells do not express a restriction factor but lack an enabling factor critical for filovirus entry. However, all tested cell lines expressed functional intracellular factors. Global gene expression profiling of known cell surface entry factors and protein expression levels of analyzed attachment factors did not reveal any correlation between susceptibility and expression of a specific host factor. Using binding assays with recombinant filovirus glycoprotein, we identified cell attachment as the step impaired in filovirus entry in SH-SY5Y cells. Individual overexpression of attachment factors T-cell immunoglobulin and mucin domain 1 (TIM-1), Axl, Mer, or dendritic cell-specific intercellular adhesion molecule-3-grabbing non-integrin (DC-SIGN) rendered SH-SY5Y cells susceptible to filovirus glycoprotein-driven transduction. Our study reveals that a lack of attachment factors limits filovirus entry and provides direct experimental support for a model of filoviral cell attachment where host factor usage at the cell surface is highly promiscuous.

Keywords: Filovirus cell entry; SH-SY5Y cell line; attachment factors redundancy; host–pathogen interactions.


Conflict of interest statement

The authors declare no conflict of interest.

Figures

Figure 1
Figure 1
Unbiased cell screening for susceptibility to EBOV (EBOVpp) and MARV (MARVpp) GP-driven transduction. A panel of twelve cell lines were transduced with EBOV (A) or MARV (B) firefly luciferase pseudoparticles. Pseudoparticles with no envelope proteins (NoEnvpp) or VSV-G (VSV-Gpp) were used as negative and positive control, respectively. Seventy-two hours post transduction, cells were lysed and luciferase activity was measured. Data were normalized to VSV-Gpp activity as indicated in material and methods. Graphs plot the mean values of three independent experiments performed in triplicate (n = 9) with error bars representing the standard deviation (SD). Individual values are represented as dots, squares or triangles.
Figure 2
Figure 2
SH-SY5Y is resistant to EBOV and VSVΔG-EBOVGP infection. (A,B) Authentic filovirus infection. Susceptible HEK293T, SK-N-BE(2)-C as well as resistant SK-N-MC and SH-SY5Y cells were infected with EBOV or MARV or mock-infected for 1 h at a MOI of 0.1. Seventy-two hpi, cells were fixed and stained for EBOV and MARV NP (A) using DAPI as counterstaining. Images acquired with a 40× objective (B) In parallel, remaining cells were lysed, and analyzed by immune-blotting for virus NP. α-tubulin was used as internal control. Images and blots are representative of three independent infections. (C,D) rVSVΔG-EBOV infection. HEK293T and SH-SY5Y cells were infected with rVSV bearing EBOV Mayinga GP for 1 h at 37 ºC. Fresh media was added and cells further incubated for 48 h. A 10× objective was used for image acquisition (C) 48 hpi. GP-specific cell rounding and detachment. (D) Cell supernatant was collected 24 hpi and viral titers determined by TCID50.
Figure 3
Figure 3
SH-SY5Y cells are resistant to pseudoparticles bearing either Ebolavirus species GPs but susceptible to pseudoparticles bearing glycoproteins of other virus families. (A) SH-SY5Y cell susceptibility to Ebolavirus species and entry-enhancing variant GPs. HEK293T and SH-SY5Y cells were transduced for 6 h with denoted pseudoparticles encoding for a firefly luciferase reporter gene. After 72 h, 100 µL of cell lysates were measured for luciferase activity. Unspecific entry was determined by NoEnvpp RLU values. Data are the log10 RLU mean values of 3 independent transductions with 9 individual values. Error bars represent SD. (B) Cell–virus specificity analysis. Huh-7.5, HEK293T, SH-SY5Y, and Jurkat cells were transduced with GFP-encoding lentiviral particles pseudotyped with different GPs or No GP (NoEnvpp) for 6 h at a MOI of 0.1 (titers determined in Huh-7.5). Seventy-two hours later, cells were analyzed for GFP expression by flow cytometry. The graph is the representation of the mean percentage of transduced cells plus individual values of the three independent experiments ± SD.
Figure 4
Figure 4
SH-SY5Y cells do not express a dominant entry restriction factor. Huh-7.5 or SH-SY5Y cells stably expressing the tetracycline-inducible Tet On 3G transactivator protein were cocultured with HEK293T-H6 cells stably expressing transactivator-inducible ZsGreen1 green fluorescent protein for 24 h. Cells were chemically fused with PEG. One hour after fusion, cells were transduced with NoEnv, EBOV, MARV, or VSV-G pseudoparticles encoding mCherry for 6 h at 37 °C. Seventy-two hours post transduction, cells were fixed with 3% PFA and analyzed for heterokaryon formation (ZsGreen1 protein expression) and susceptibility to pseudoparticle infection (mCherry protein expression). (A) Confocal microscopy images of one representative experiment with SH-SY5Y and HEK293T-H6 cells. Scale bars = 50 µm (B) Quantification of transduced cells by flow cytometry. Left-hand side of graph represents transduction percentage of single cell line controls and right-hand side from heterokaryons (discriminated previously by gating on ZsGreen1 positive cells). Mean ± SD. of three independent cell fusions and subsequent transduction experiments (n = 3).
Figure 5
Figure 5
Intracellular entry factors are expressed and functional in SH-SY5Y cells. Endogenous protein expression of (A) cathepsin B and L, (C) NPC1, and (E) TPC1 and 2. Cell lysates were analyzed for protein expression by western blotting with protein specific abs. β-tubulin (55 kDa) was used as internal control. (B) Cathepsin B and L activity assay. Cathepsins substrate-specific proteolytic cleavage was measured with a commercially available kit as described in methods. Assay limit of detection (LOD) represented as a dotted line. Experiments were conducted thrice with graph bars representing mean experimental value, individual values and SD. (D) Intracellular cholesterol accumulation. HEK293T (upper panels) or SH-SY5Y cells (bottom panels) were treated either with vehicle (left) or with 10 µg/mL of the NPC1 inhibitor U18666A (right) for 24 h. Cells were fixed with 0.1% TX100 and stained for unesterified cholesterol using filipin. Images are representative of two independent experiments. Scale bar 200 µm. (F) EGF intracellular accumulation. HEK293T (upper panels) or SH-SY5Y cells (bottom panels) were treated either with vehicle alone (left) or with the TPC1/2 inhibitor tetrandrine (2 µg/mL) (right) for 24 h followed by incubation with EGF-Alexa Fluor 555 (red) for 30 min. Cells were fixed with 3% PFA, permeabilized with 0.1% TX100, stained with DAPI (blue) and analyzed by confocal microscopy. Scale bar 20 µm.
Figure 6
Figure 6
Hierarchical clustering analysis (HCA) does not correlate gene expression to susceptibility to filovirus infection. Microarray data of cell lines tested for susceptibility to filovirus infection as well as primary human hepatocytes (PHH) were clustered based on (A) their global gene expression or (B) gene expression of attachment factors implicated in filovirus entry using the heatmaps.2 of the R library “glplots” package. Transcript probes that yielded no detectable signal were removed prior to analysis. Heatmaps were generated by plotting cell lines as columns and genes as rows using the “complete” method for clustering and “Euclidean” method for distance calculation. In the bar above the heatmaps dark blue represents susceptible cell lines and light blue resistant cell lines.
Figure 7
Figure 7
Surface expression does not explain susceptibility to filovirus infection. (AD) Axl and TIM-1 cell surface expression. Cells were surface stained with saturating concentrations of specific abs and their correspondent isotype controls and fluorescent signal quantified by flow cytometry. Protein expression profiles of (A) Axl and (C) TIM-1 in different cell lines are shown as histograms of a representative experiment. (BD) Cell surface expression of Axl and TIM-1 in terms of average delta mean fluorescence intensity (ΔMFI) from three independent stainings. ΔMFI was calculated by subtracting the geometric mean intensity values of the isotype control from the specific staining values. SD is shown as error bars.
Figure 8
Figure 8
Impaired filovirus attachment on SH-SY5Y cells can be overcome by surface factor overexpression. (A) Binding of EBOV GP-Fc fusion protein to cell surface. EBOV-GP1 and human Fc (100 nM) were incubated for 1.5 h with the indicated cell lines and detected with a secondary ab against the human Fc fragment. MFI signal was recorded for Fc or EBOV GP1-Fc and subtracted from secondary ab MFI. Bars represent mean of two biological replicates performed in duplicate (n = 4) and symbols represent each individual value. Error bars represent the SD. (B) Overexpression of several cell surface factors and their role in filoviral GP-dependent entry. Susceptible HEK293T, resistant SH-SY5Y WT or SH-SY5Y cells genetically engineered to individually express different entry host factors were transduced with NoEnv, EBOV, MARV, and VSV-G luciferase-encoding pseudoparticles. Mock infection was performed to control background signal. Enhanced susceptibility to filovirus infection was calculated as the fold change difference over SH-SY5Y WT cells by dividing the RLU values of 100 µl lysed cells of each engineered cell line and HEK293T cells with the SH-SY5Y WT RLU values. Fold change differences between SH-SY5Y WT and HEK293T or engineered SH-SY5Y cell lines were used for statistical analysis. Graph is the representation of 3 independent transductions done in triplicate (n = 9). Error bars depicts SD. For the analysis of significance in all 3 graphs a multiple t test with a Holm–Sidak multiple comparison correction method was conducted. P-value significance is shown as: n.s. P > 0.05; * P ≤ 0.05; ** P ≤ 0.01; *** P ≤ 0.001; **** P ≤ 0.0001.

Similar articles

Cited by

References

    1. Kuhn J.H., Becker S., Ebihara H., Geisbert T.W., Johnson K.M., Kawaoka Y., Lipkin W.I., Negredo A.I., Netesov S.V., Nichol S.T., et al. Proposal for a revised taxonomy of the family Filoviridae: Classification, names of taxa and viruses, and virus abbreviations. Arch. Virol. 2010;155:2083–2103. doi: 10.1007/s00705-010-0814-x. - DOI - PMC - PubMed
    1. Siegert R., Shu H.L., Slenczka H.L., Peters D., Muller G. The aetiology of an unknown human infection transmitted by monkeys (preliminary communication) Ger. Med. Mon. 1968;13:1–2. - PubMed
    1. Bowen E.T.W., Lloyd G., Harris W.J., Platt G.S., Baskerville A., Vella E.E. Viral haemorraghic fever in southern Sudan and northern Zaire. Preliminary Studies on the Aetiological Agent. Lancet. 1977;309:571–573. doi: 10.1016/S0140-6736(77)92001-3. - DOI - PubMed
    1. CDC Outbreaks Chronology: Ebola Virus Disease|Ebola Hemorrhagic Fever|CDC. [(accessed on 13 August 2018)];2018 Available online: https://www.cdc.gov/vhf/ebola/history/chronology.html.Cdc-Ebola.
    1. CDC Outbreaks Chronology: Marburg Hemorrhagic Fever. [(accessed on 13 August 2018)];2018 Available online: https://www.cdc.gov/vhf/marburg/outbreaks/chronology.html.

Publication types