. 2019 Mar 19;11(3):386.
doi: 10.3390/cancers11030386.

Radiosensitivity of Cancer Cells Is Regulated by Translationally Controlled Tumor Protein

Affiliations

Radiosensitivity of Cancer Cells Is Regulated by Translationally Controlled Tumor Protein

Jiwon Jung et al. Cancers (Basel). .

Abstract

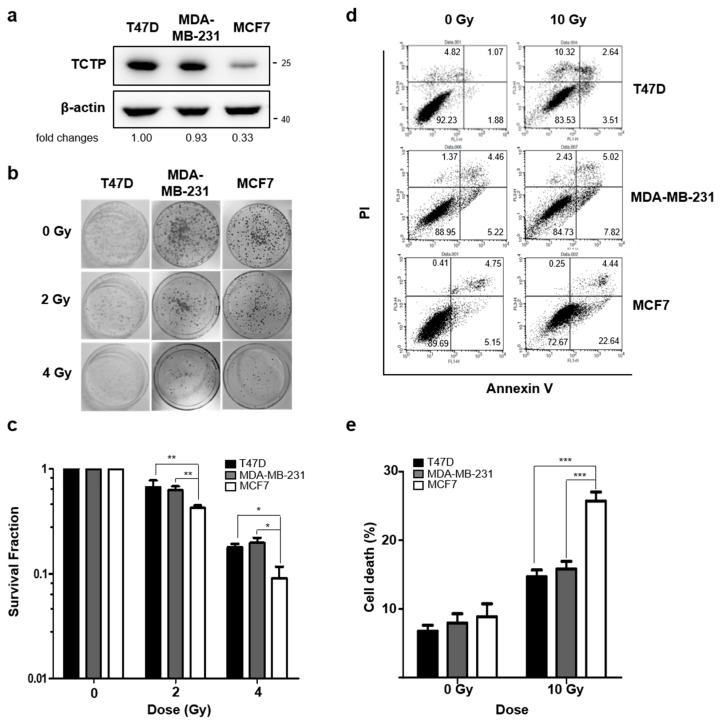
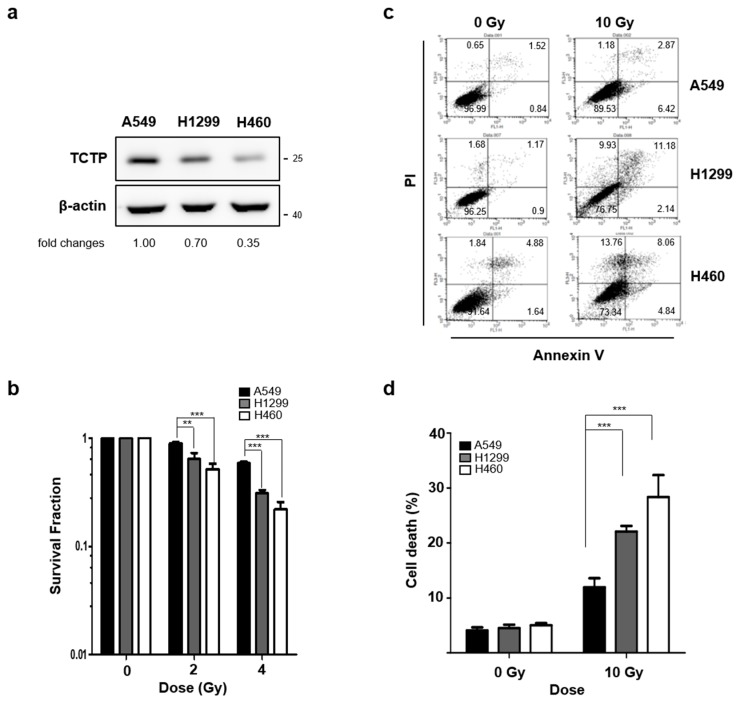
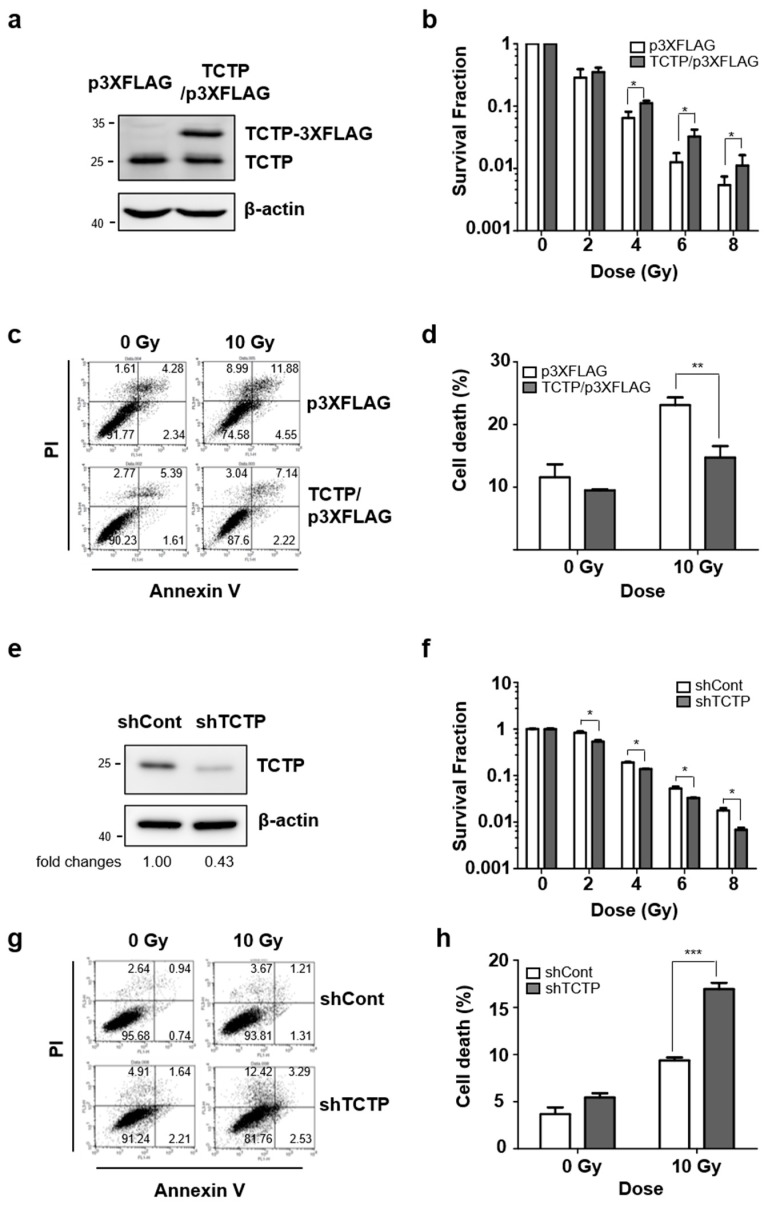
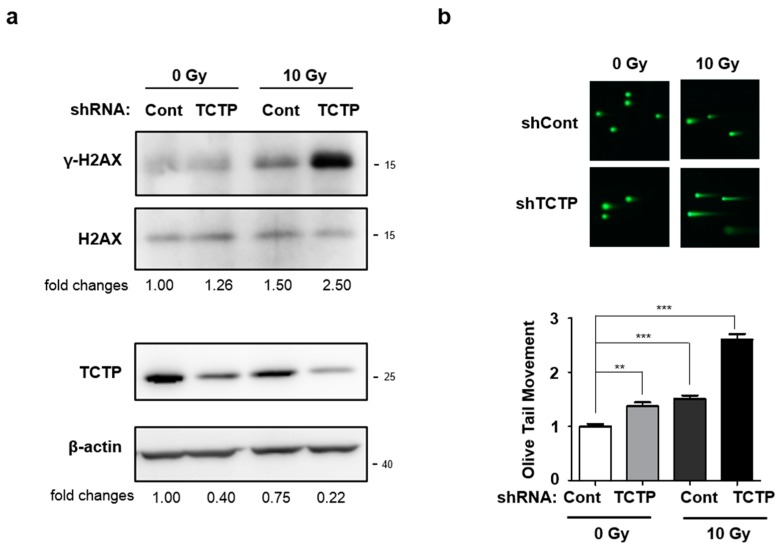
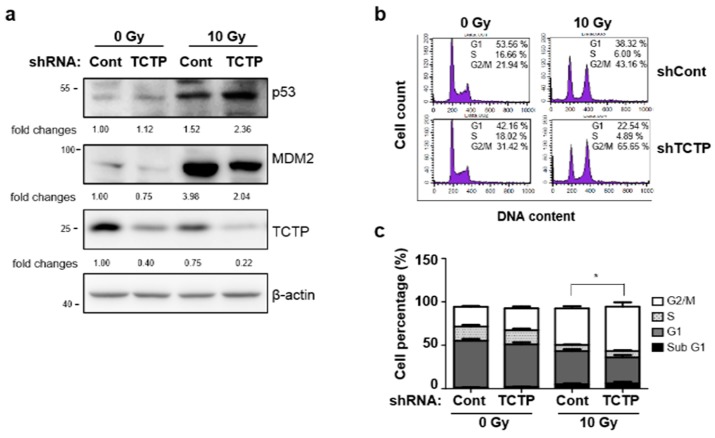
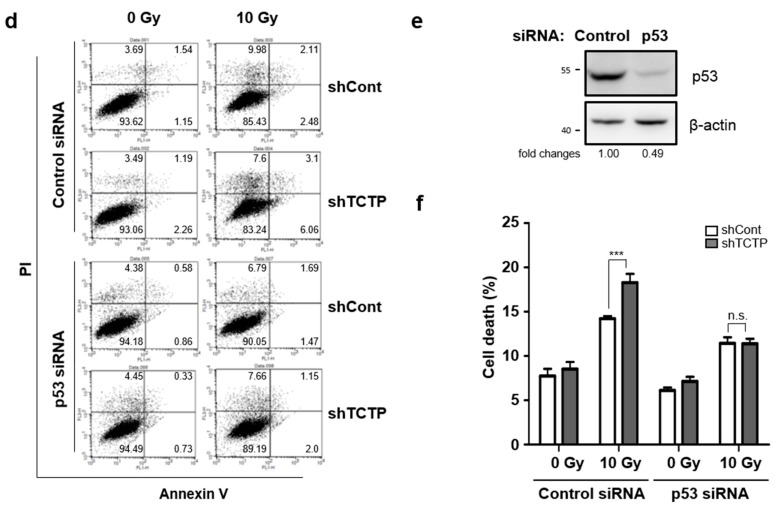
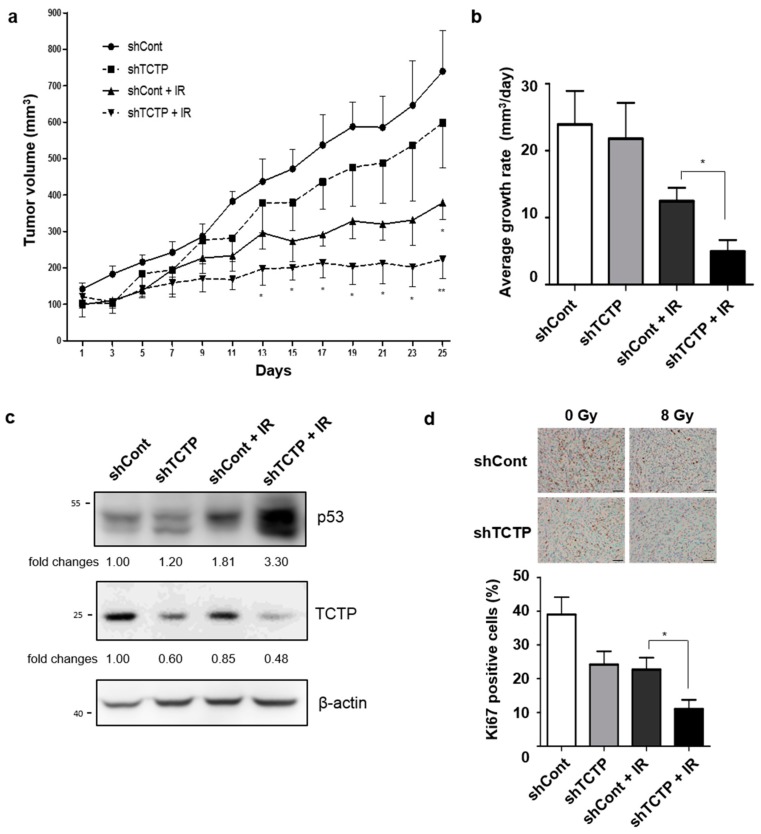
Translationally controlled tumor protein (TCTP) is a ubiquitous multifunctional protein that is essential for cell survival. This study reveals that the regulation of radiosensitivity of cancer cells is yet another function of TCTP. The relationship between endogenous TCTP levels and sensitivity to radiation was examined in breast cancer cell lines (T47D, MDA-MB-231, and MCF7) and lung cancer cells lines (A549, H1299, and H460). Cancer cells with high expression levels of TCTP were more resistant to radiation. TCTP overexpression inhibited radiation-induced cell death, while silencing TCTP led to an increase in radiosensitivity. DNA damage in the irradiated TCTP-silenced A549 cells was greater than in irradiated control shRNA-transfected A549 cells. p53, a well-known reciprocal regulator of TCTP, was increased in irradiated TCTP down-regulated A549 cells. Moreover, introduction of p53 siRNA in TCTP knocked-down A549 cells abrogated the increased radiosensitivity induced by TCTP knockdown. An in vivo xenograft study also confirmed enhanced radiosensitivity in TCTP down-regulated A549 cells. These findings suggest that TCTP has the potential to serve as a therapeutic target to overcome radiation resistance in cancer, a major problem for the effective treatment of cancers.

Keywords: TCTP; p53; radioresistance.


Conflict of interest statement

The authors declare no conflict of interest.

Figures

Figure 1
Figure 1
Translationally controlled tumor protein (TCTP) expression inversely correlates with sensitivity to γ-radiation in breast cancer cells. (a) TCTP expression of breast cancer cell lines were determined by Western blotting (n = 4). The cropped blots are used in the figure and full-length blots are presented in Figure S5. The relative level of TCTP in comparison to β-actin is indicated below each immunoblot image. (b,c) The cells were treated with different doses of γ-radiation, and the survival fraction was determined by a clonogenic formation assay (n = 3). (b) Representative image of clonogenic formation. (c) Survival fraction relative to each untreated group was calculated and shown in the graph. (d,e) Cells were treated with γ-radiation of 10 Gy and dead cell populations were determined by flow cytometry after staining with Annexin V and PI (n = 4). (d) Representative image of PI-Annexin V double staining examined in breast cancer cells and (e) graph of dead cells is shown. Bars represent the means ± SEM. * p < 0.05, ** p < 0.01, *** p < 0.001 by two-way analysis of variance.
Figure 2
Figure 2
TCTP expression inversely correlates with sensitivity to γ-radiation in lung cancer cells. (a) TCTP expression of indicated lung cancer cell lines were determined by western blot analysis (n = 4). The cropped blots are used in the figure, and full-length blots are presented in Figure S6. The relative level of TCTP in comparison to β-actin is indicated below each immunoblot image. (b) The cells were treated with different doses of γ-radiation and the survival fraction was determined using clonogenic formation assay (n = 4). Cells were treated with γ-radiation of 10 Gy and dead cell populations were determined by flow cytometry after staining with Annexin V and PI (n = 3). (c) Representative image of PI-Annexin V double staining examined in lung cancer cells and (d) graph of dead cells is shown. Bars represent the means ± SEM. ** p < 0.01 and *** p < 0.001 by two-way analysis of variance.
Figure 3
Figure 3
TCTP involves in radioresistance in cancer cells. (a) MCF7 cells were overexpressed with TCTP-3Xflag and overexpression of TCTP-3Xflag was confirmed using Western blot analysis. (b) TCTP-3Xflag-overexpressed MCF7 cells were treated with different doses of γ-radiation and the survival fraction was measured by clonogenic formation assay (n = 3). Cells were treated with γ-radiation of 10 Gy and dead cell populations were determined after 48 h. (c) The representative images of PI-Annexin V double staining examined in TCTP-overexpressed MCF7 cells and (d) the graph of apoptotic cells is shown (n = 3). (e) A549 cells were transfected with TCTP shRNA (shTCTP) and control shRNA (shCont) and TCTP down-regulation was confirmed using Western blot analysis. (f) TCTP-knockdown A549 cells were treated with different doses of γ-radiation and the survival fraction was measured using clonogenic formation assay (n = 6). Cells were treated with γ-radiation of 10 Gy and cell death was analyzed using flow cytometry (n = 3). (g) The representative image of PI-Annexin V double staining examined in TCTP-knockdown A549 cells and (h) the graph of the dead cell population is shown. The cropped blots are used in the figure, and full-length blots are presented in Figure S7. Bars represent the means ± SEM. * p < 0.05, ** p < 0.01, *** p < 0.001 by two-way analysis of variance.
Figure 4
Figure 4
TCTP knockdown potentiates radiation-induced DNA damage in A549 cells. (a) After 48 h γ-radiation, γ-H2AX, H2AX, and TCTP expression level of A549 cells transfected with TCTP shRNA (shTCTP) and control shRNA (shCont) were measured using Western blot analysis (n = 4). The cropped blots are used in the figure and full-length blots are presented in Figure S8. The relative level of TCTP to β-actin and γ-H2AX to H2AX are indicated below each immunoblot image. (b) TCTP-depleted A549 cells were treated with 10 Gy of γ-radiation and comet assay was performed after 48 h. The olive tail moment was calculated using the Comet 5.5 software. The data represent the mean ± SEM. ** p < 0.01, *** p < 0.001 by one-way analysis of variance.
Figure 5
Figure 5
p53 is involved in TCTP-mediated radioresistance of A549 cells. (a) A549 cells were transfected with control shRNA (shCont) or TCTP shRNA (shTCTP) and treated with 10 Gy of γ-radiation. Protein lysates were prepared and analyzed by Western blotting 48 h after radiation treatment. The relative level of proteins in comparison to β-actin is indicated below each immunoblot. (n = 5) (b) The representative image of cell cycle analysis in shCont and shTCTP A549 cells is shown. Cells were treated with 10 Gy of γ-radiation and analyzed 24 h after radiation. (c) Graph of each cell population is shown. * p < 0.05 by student’s t-test in comparison of G2/M phase. (d) The representative image of PI-Annexin V double staining examined in p53 siRNA and TCTP shRNA-transfected A549 cells is shown. (e) A549 cells were immunoblotted using anti-p53 antibody to confirm p53 knockdown. (f) A549 cells were transfected with indicated siRNA and exposed to 10 Gy of γ-radiation. Cell death was measured using Annexin V/PI assay 48 h after γ-radiation treatment. The cropped blots are used in the figure and full-length blots are presented in Figure S9. Bars represent the mean ± SEM (n = 3). * p < 0.05 and *** p < 0.001 by two-way analysis of variance.
Figure 5
Figure 5
p53 is involved in TCTP-mediated radioresistance of A549 cells. (a) A549 cells were transfected with control shRNA (shCont) or TCTP shRNA (shTCTP) and treated with 10 Gy of γ-radiation. Protein lysates were prepared and analyzed by Western blotting 48 h after radiation treatment. The relative level of proteins in comparison to β-actin is indicated below each immunoblot. (n = 5) (b) The representative image of cell cycle analysis in shCont and shTCTP A549 cells is shown. Cells were treated with 10 Gy of γ-radiation and analyzed 24 h after radiation. (c) Graph of each cell population is shown. * p < 0.05 by student’s t-test in comparison of G2/M phase. (d) The representative image of PI-Annexin V double staining examined in p53 siRNA and TCTP shRNA-transfected A549 cells is shown. (e) A549 cells were immunoblotted using anti-p53 antibody to confirm p53 knockdown. (f) A549 cells were transfected with indicated siRNA and exposed to 10 Gy of γ-radiation. Cell death was measured using Annexin V/PI assay 48 h after γ-radiation treatment. The cropped blots are used in the figure and full-length blots are presented in Figure S9. Bars represent the mean ± SEM (n = 3). * p < 0.05 and *** p < 0.001 by two-way analysis of variance.
Figure 6
Figure 6
TCTP knockdown enhances radiosensitivity in tumor xenograft mouse model. A549 cells were stably infected with lentiviral control shRNA (shCont) and shRNA vector-targeting TCTP (shTCTP) and introduced to the right thigh of 6-week-old, female, Balb/c nude mice. When the tumors of stably transfected cells reached 100 mm3, they were treated with γ-radiation (8 Gy). (a) The growth of the tumors was assessed by measuring tumor volume with digital caliper every other day for 25 days. The data represent the mean ± SEM. * p < 0.05, ** p < 0.01 vs. shCont. (b) Average tumor growth rate (mm3/days) is shown. The data represent the mean ± SEM (n = 6–8/group). * p < 0.05 (c) The immunoblots of tumors from shCont, shTCTP, shCont+IR, and shTCTP+IR groups using anti-p53, anti-TCTP, and anti-β-actin antibodies are shown. The cropped blots are used in the figure and full-length blots are presented in Figure S10. The relative level of proteins in comparison to β-actin are indicated below each immunoblot (n = 6). (d) Immunohistochemistry of the tumors with anti-Ki67 antibody and the percentage of Ki67-positive cells per field are shown. The scale bar indicates 50 μm (magnification: 200×). The data represent the mean ± SEM. * p < 0.05.

Similar articles

Cited by

References

    1. Harrington K.J., Billingham L.J., Brunner T.B., Burnet N.G., Chan C.S., Hoskin P., Mackay R.I., Maughan T.S., Macdougall J., McKenna W.G., et al. Guidelines for preclinical and early phase clinical assessment of novel radiosensitisers. Br. J. Cancer. 2011;105:628–639. doi: 10.1038/bjc.2011.240. - DOI - PMC - PubMed
    1. Peters L.J., Withers H.R., Thames H.D., Jr., Fletcher G.H. Tumor radioresistance in clinical radiotherapy. Int. J. Radiat. Oncol. Biol. Phys. 1982;8:101–108. doi: 10.1016/0360-3016(82)90392-3. - DOI - PubMed
    1. Bommer U.A., Thiele B.J. The translationally controlled tumour protein (TCTP) Int. J. Biochem. Cell Biol. 2004;36:379–385. doi: 10.1016/S1357-2725(03)00213-9. - DOI - PubMed
    1. Li F., Zhang D., Fujise K. Characterization of fortilin, a novel antiapoptotic protein. J. Biol. Chem. 2001;276:47542–47549. doi: 10.1074/jbc.M108954200. - DOI - PubMed
    1. Amson R., Pece S., Lespagnol A., Vyas R., Mazzarol G., Tosoni D., Colaluca I., Viale G., Rodrigues-Ferreira S., Wynendaele J., et al. Reciprocal repression between P53 and TCTP. Nat. Med. 2011;18:91–99. doi: 10.1038/nm.2546. - DOI - PubMed