

PDK4 drives metabolic alterations and muscle atrophy in cancer cachexia
- PMID: 30894018
- PMCID: PMC6529344
- DOI: 10.1096/fj.201802799R
PDK4 drives metabolic alterations and muscle atrophy in cancer cachexia
Abstract
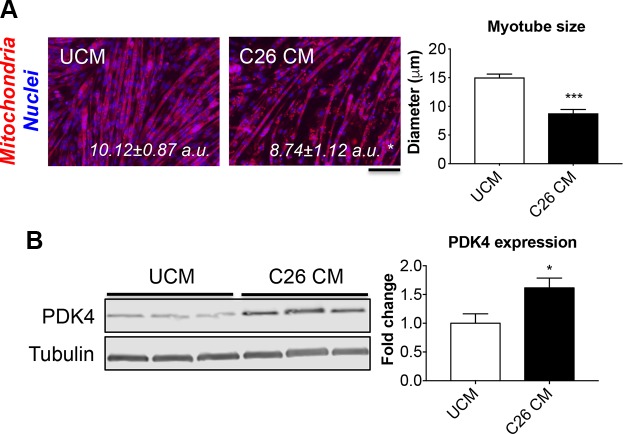
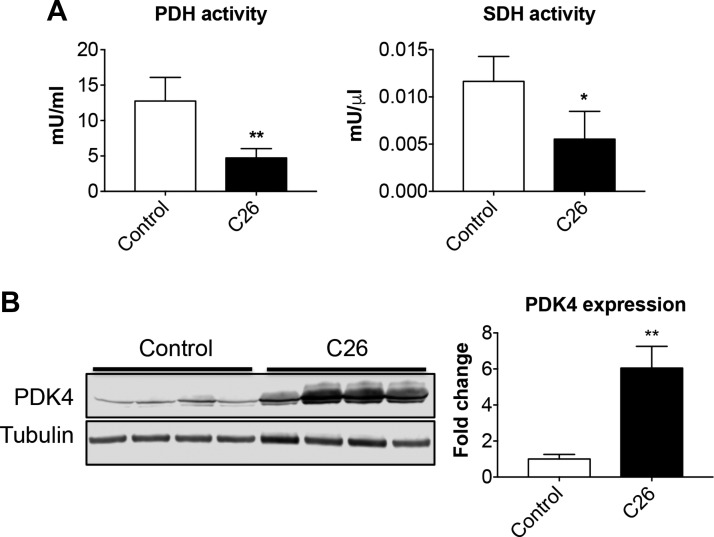
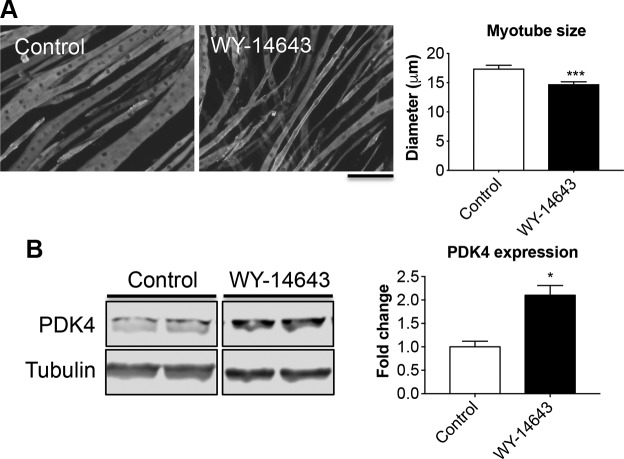
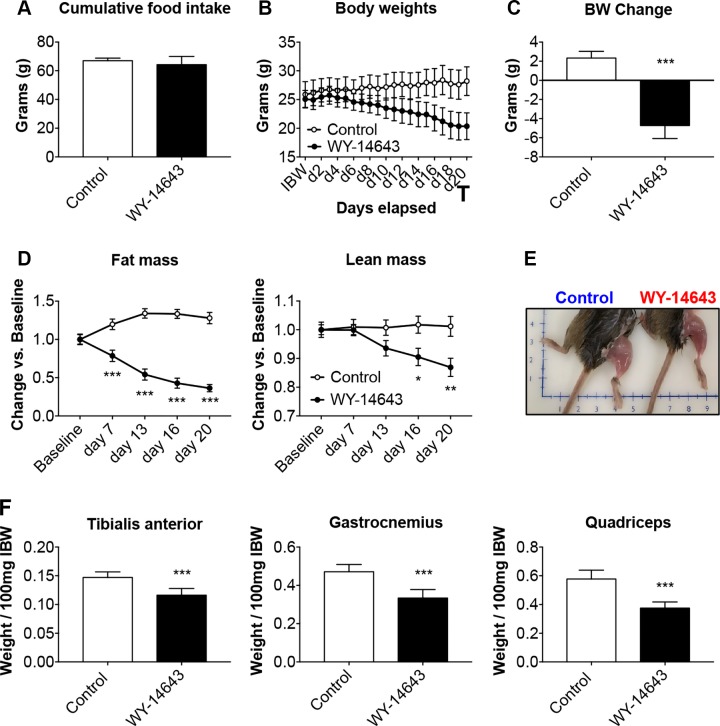
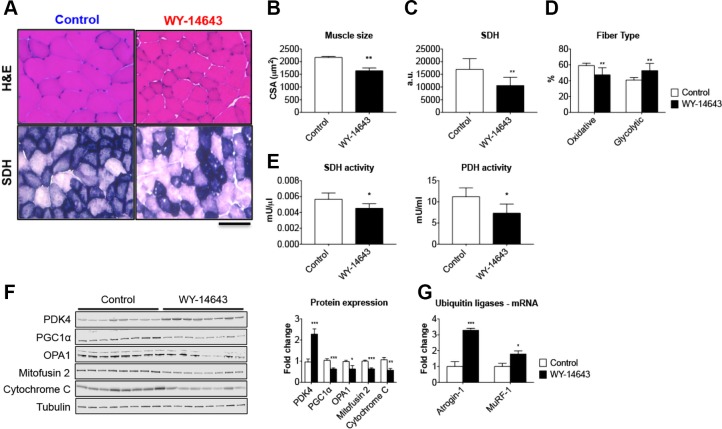
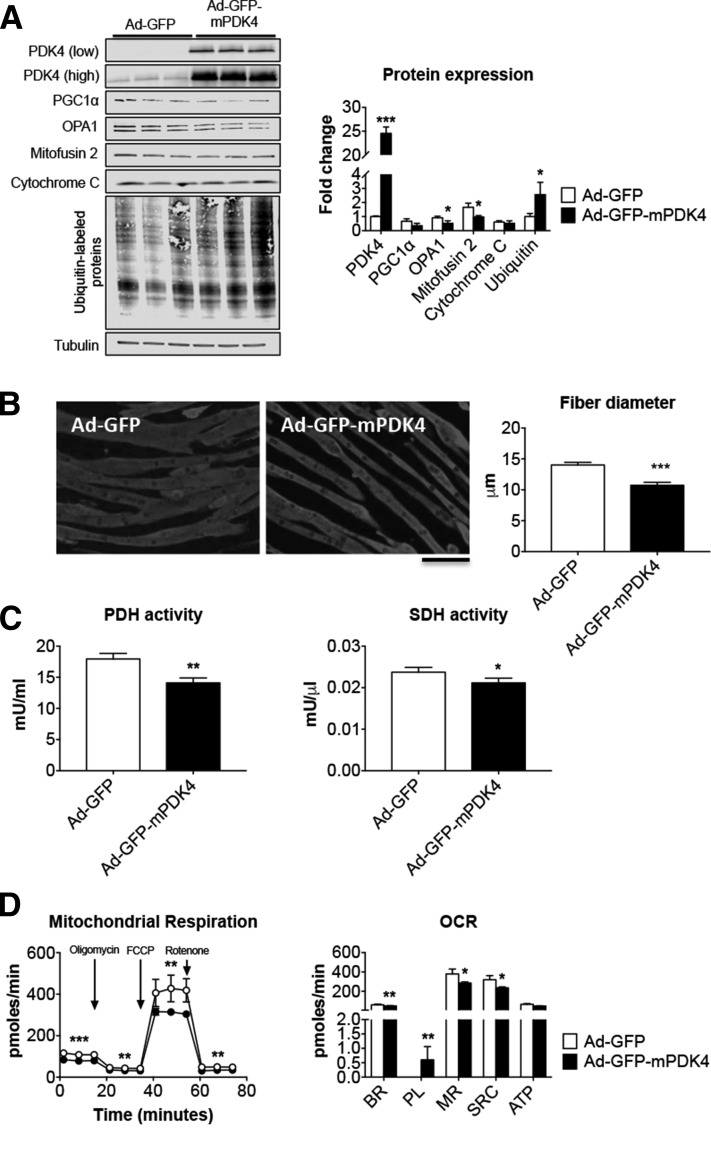
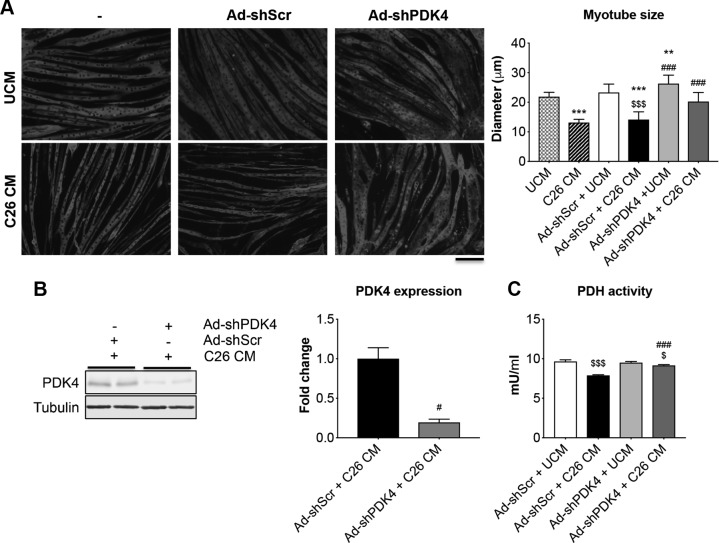
Cachexia is frequently accompanied by severe metabolic derangements, although the mechanisms responsible for this debilitating condition remain unclear. Pyruvate dehydrogenase kinase (PDK)4, a critical regulator of cellular energetic metabolism, was found elevated in experimental models of cancer, starvation, diabetes, and sepsis. Here we aimed to investigate the link between PDK4 and the changes in muscle size in cancer cachexia. High PDK4 and abnormal energetic metabolism were found in the skeletal muscle of colon-26 tumor hosts, as well as in mice fed a diet enriched in Pirinixic acid, previously shown to increase PDK4 levels. Viral-mediated PDK4 overexpression in myotube cultures was sufficient to promote myofiber shrinkage, consistent with enhanced protein catabolism and mitochondrial abnormalities. On the contrary, blockade of PDK4 was sufficient to restore myotube size in C2C12 cultures exposed to tumor media. Our data support, for the first time, a direct role for PDK4 in promoting cancer-associated muscle metabolic alterations and skeletal muscle atrophy.-Pin, F., Novinger, L. J., Huot, J. R., Harris, R. A., Couch, M. E., O'Connell, T. M., Bonetto, A. PDK4 drives metabolic alterations and muscle atrophy in cancer cachexia.
Keywords: C2C12 myotubes; chemotherapy; energy metabolism; mitochondria; skeletal muscle atrophy.
Conflict of interest statement
The authors thank the Cancer Center at Indiana University (IU) School of Medicine funded by the IU Simon Cancer Center Support Grant (P30CA082709) for the use of the
Figures
Similar articles
-
MuRF1 deficiency prevents age-related fat weight gain, possibly through accumulation of PDK4 in skeletal muscle mitochondria in older mice.J Orthop Res. 2022 May;40(5):1026-1038. doi: 10.1002/jor.25131. Epub 2021 Jul 9. J Orthop Res. 2022. PMID: 34185335
-
Growth of ovarian cancer xenografts causes loss of muscle and bone mass: a new model for the study of cancer cachexia.J Cachexia Sarcopenia Muscle. 2018 Aug;9(4):685-700. doi: 10.1002/jcsm.12311. Epub 2018 Jul 15. J Cachexia Sarcopenia Muscle. 2018. PMID: 30009406 Free PMC article.
-
Assessing Metabolic Dysregulation in Muscle During Cachexia.Methods Mol Biol. 2019;1928:337-352. doi: 10.1007/978-1-4939-9027-6_17. Methods Mol Biol. 2019. PMID: 30725463
-
Transcriptional regulation of pyruvate dehydrogenase kinase 4 in skeletal muscle during and after exercise.Proc Nutr Soc. 2004 May;63(2):221-6. doi: 10.1079/pns2004345. Proc Nutr Soc. 2004. PMID: 15294034 Review.
-
Molecular mechanisms of cancer cachexia‑induced muscle atrophy (Review).Mol Med Rep. 2020 Dec;22(6):4967-4980. doi: 10.3892/mmr.2020.11608. Epub 2020 Oct 16. Mol Med Rep. 2020. PMID: 33174001 Free PMC article. Review.
Cited by
-
Tumour-induced alterations in single-nucleus transcriptome of atrophying muscles indicate enhanced protein degradation and reduced oxidative metabolism.J Cachexia Sarcopenia Muscle. 2024 Oct;15(5):1898-1914. doi: 10.1002/jcsm.13540. Epub 2024 Jul 13. J Cachexia Sarcopenia Muscle. 2024. PMID: 39001644 Free PMC article.
-
Targeting Mitochondria and Oxidative Stress in Cancer- and Chemotherapy-Induced Muscle Wasting.Antioxid Redox Signal. 2023 Feb;38(4-6):352-370. doi: 10.1089/ars.2022.0149. Epub 2022 Dec 29. Antioxid Redox Signal. 2023. PMID: 36310444 Free PMC article. Review.
-
Triggering Receptor Expressed on Myeloid Cells 2 (TREM2) R47H Variant Causes Distinct Age- and Sex-Dependent Musculoskeletal Alterations in Mice.J Bone Miner Res. 2022 Jul;37(7):1366-1381. doi: 10.1002/jbmr.4572. Epub 2022 Jun 7. J Bone Miner Res. 2022. PMID: 35575023 Free PMC article.
-
Loss of metabolic flexibility as a result of overexpression of pyruvate dehydrogenase kinases in muscle, liver and the immune system: Therapeutic targets in metabolic diseases.J Diabetes Investig. 2021 Jan;12(1):21-31. doi: 10.1111/jdi.13345. Epub 2020 Sep 10. J Diabetes Investig. 2021. PMID: 32628351 Free PMC article. Review.
-
Pharmacological or genetic inhibition of iNOS prevents cachexia-mediated muscle wasting and its associated metabolism defects.EMBO Mol Med. 2021 Jul 7;13(7):e13591. doi: 10.15252/emmm.202013591. Epub 2021 Jun 7. EMBO Mol Med. 2021. PMID: 34096686 Free PMC article.
References
-
- Fearon K., Arends J., Baracos V. (2013) Understanding the mechanisms and treatment options in cancer cachexia. Nat. Rev. Clin. Oncol. 10, 90–99 - PubMed
-
- Fearon K. C., Glass D. J., Guttridge D. C. (2012) Cancer cachexia: mediators, signaling, and metabolic pathways. Cell Metab. 16, 153–166 - PubMed
-
- Skipworth R. J., Stewart G. D., Dejong C. H., Preston T., Fearon K. C. (2007) Pathophysiology of cancer cachexia: much more than host-tumour interaction? Clin. Nutr. 26, 667–676 - PubMed
-
- Bossola M., Muscaritoli M., Costelli P., Bellantone R., Pacelli F., Busquets S., Argilès J., Lopez-Soriano F. J., Civello I. M., Baccino F. M., Rossi Fanelli F., Doglietto G. B. (2001) Increased muscle ubiquitin mRNA levels in gastric cancer patients. Am. J. Physiol. Regul. Integr. Comp. Physiol. 280, R1518–R1523 - PubMed
Publication types
MeSH terms
Substances
Grants and funding
LinkOut - more resources
Full Text Sources
Other Literature Sources
Molecular Biology Databases
