. 2019 Nov;15(11):1954-1969.
doi: 10.1080/15548627.2019.1596486. Epub 2019 Mar 30.

Impaired TFEB-mediated lysosomal biogenesis promotes the development of pancreatitis in mice and is associated with human pancreatitis

Affiliations

Impaired TFEB-mediated lysosomal biogenesis promotes the development of pancreatitis in mice and is associated with human pancreatitis

Shaogui Wang et al. Autophagy. 2019 Nov.

Abstract

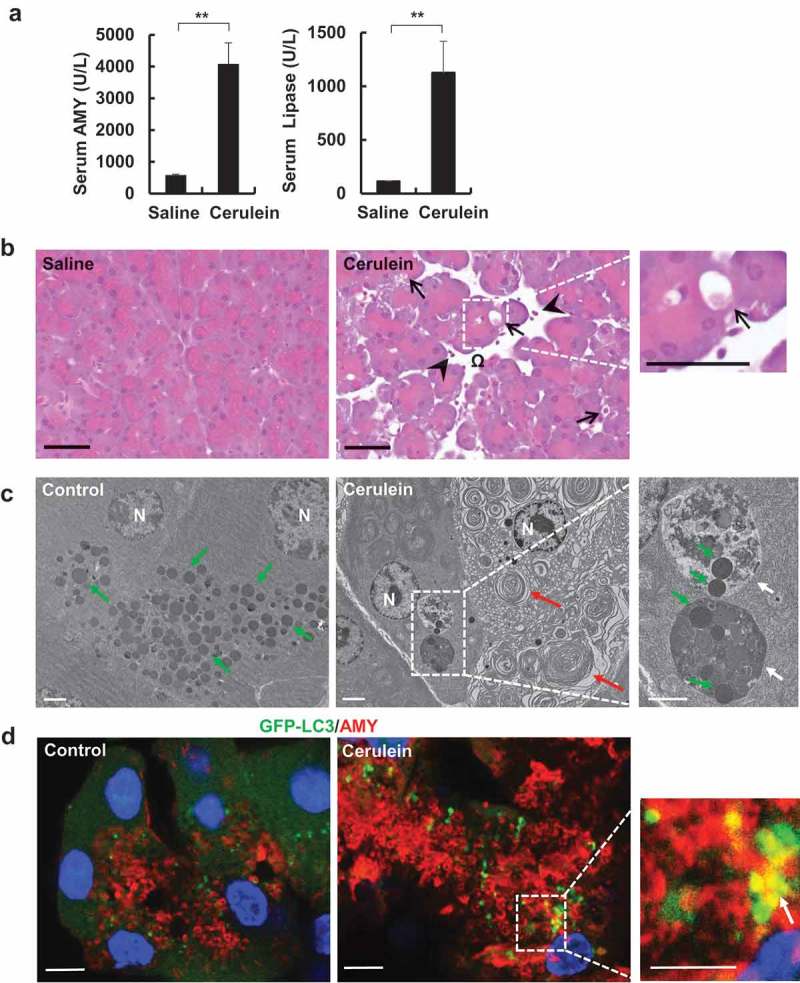
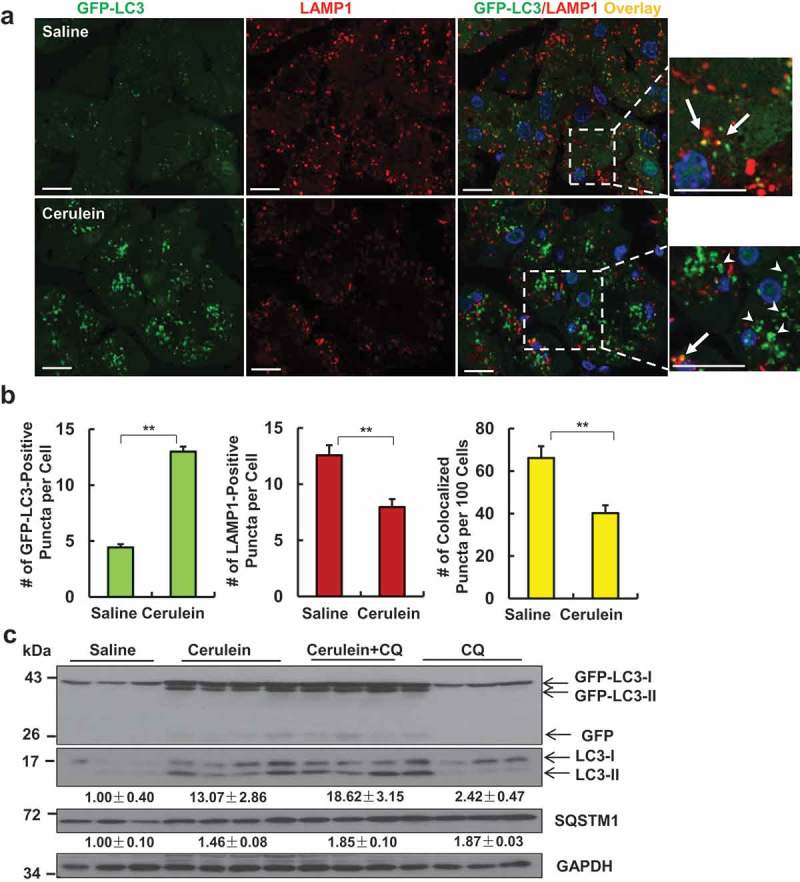
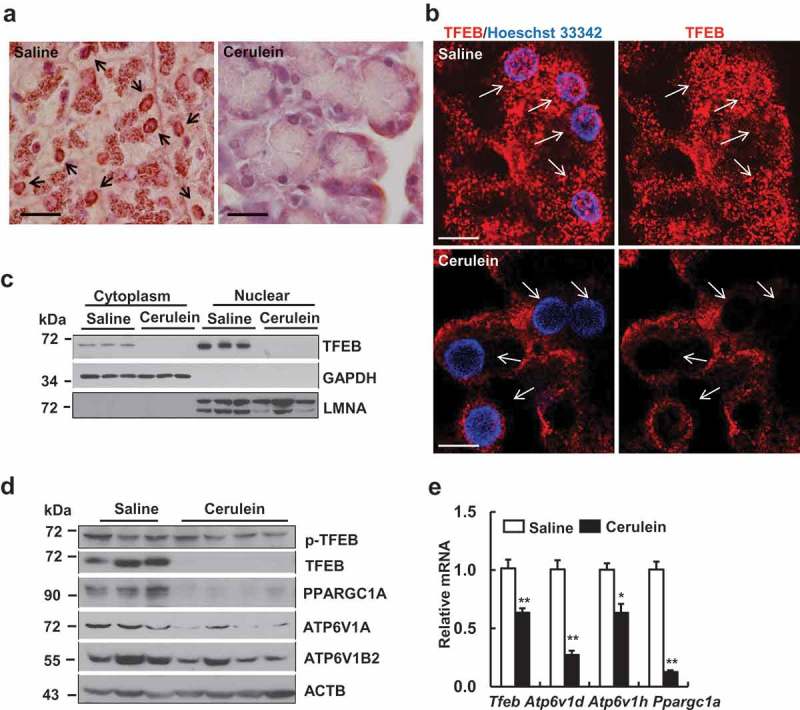
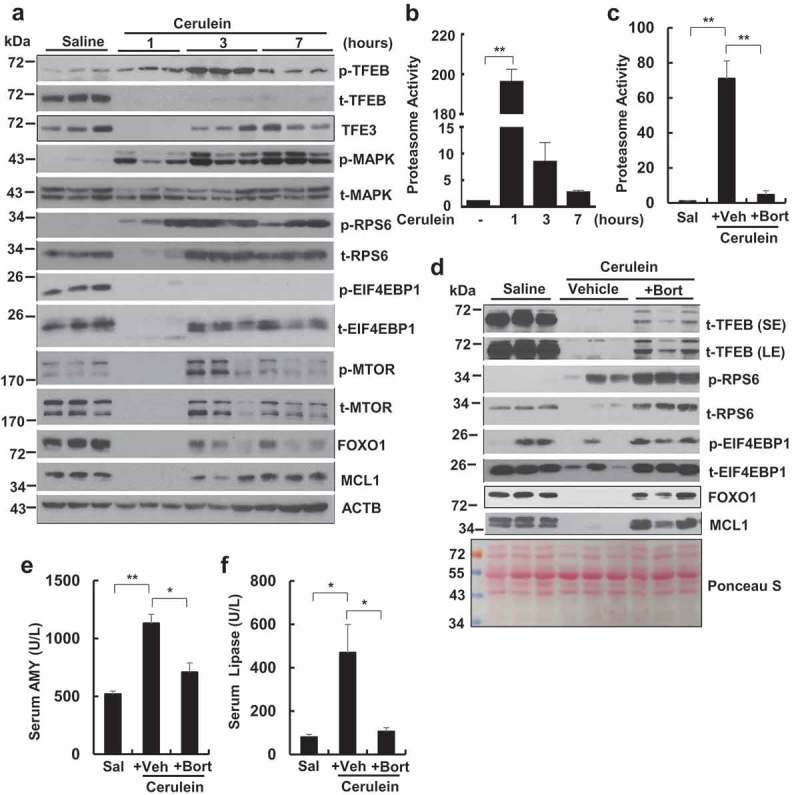
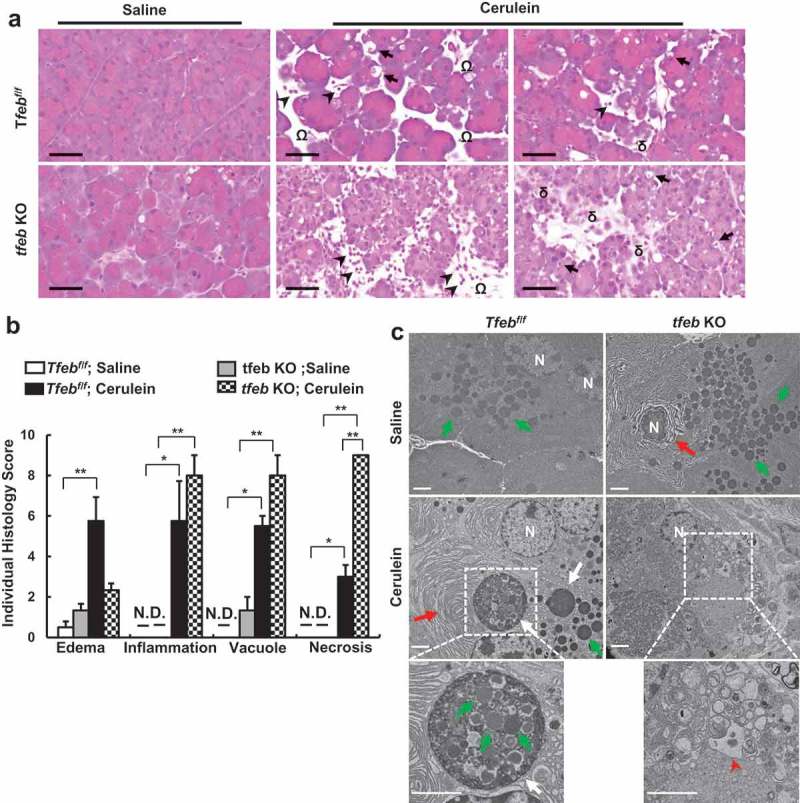
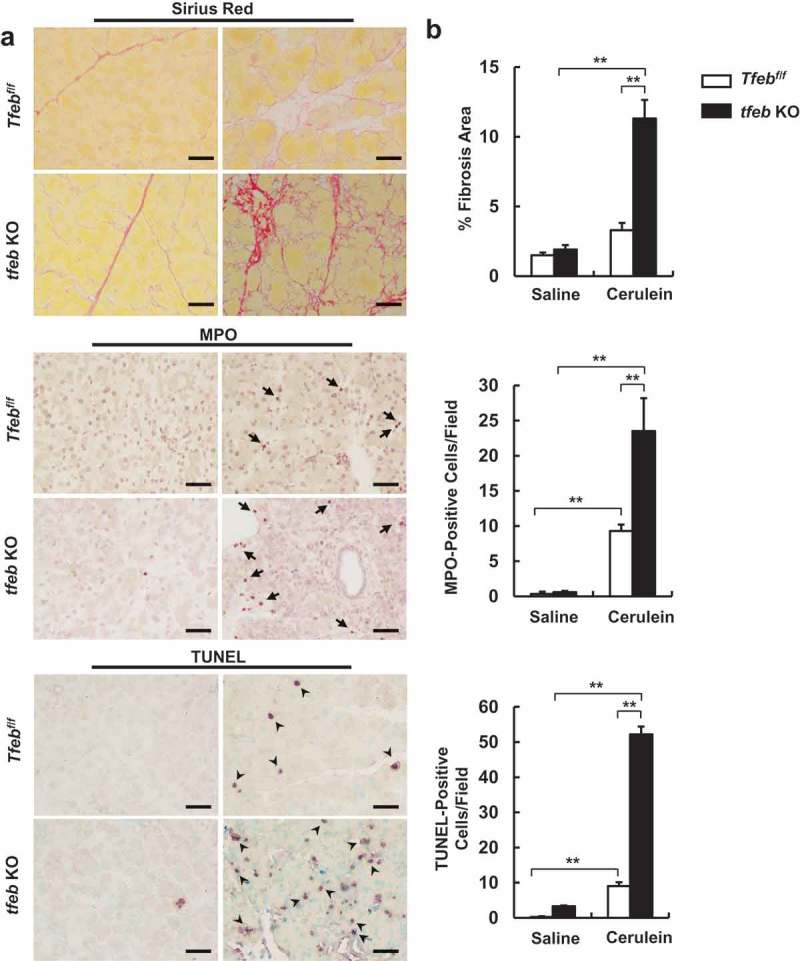
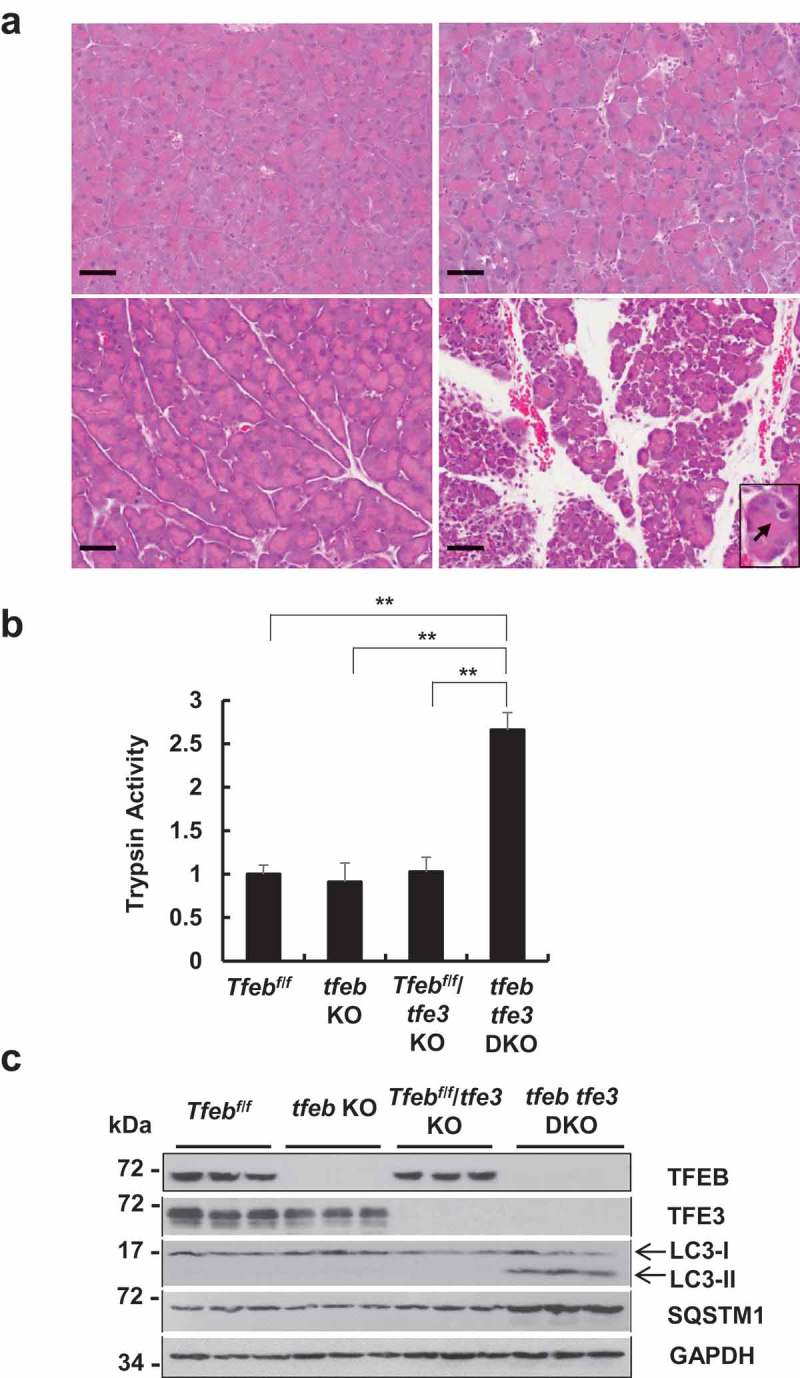
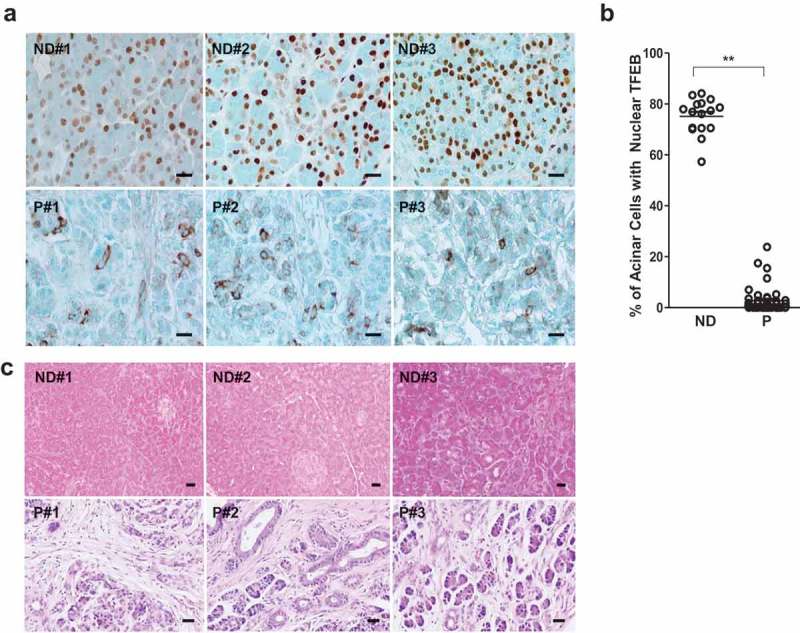
Impaired macroautophagy/autophagy has been implicated in experimental and human pancreatitis. However, the transcriptional control governing the autophagy-lysosomal process in pancreatitis is largely unknown. We investigated the role and mechanisms of TFEB (transcription factor EB), a master regulator of lysosomal biogenesis, in the pathogenesis of experimental pancreatitis. We analyzed autophagic flux, TFEB nuclear translocation, lysosomal biogenesis, inflammation and fibrosis in GFP-LC3 transgenic mice, acinar cell-specific tfeb knockout (KO) and tfeb and tfe3 double-knockout (DKO) mice as well as human pancreatitis samples. We found that cerulein activated MTOR (mechanistic target of rapamycin kinase) and increased the levels of phosphorylated TFEB as well as pancreatic proteasome activities that led to rapid TFEB degradation. As a result, cerulein decreased the number of lysosomes resulting in insufficient autophagy in mouse pancreas. Pharmacological inhibition of MTOR or proteasome partially rescued cerulein-induced TFEB degradation and pancreatic damage. Furthermore, genetic deletion of tfeb specifically in mouse pancreatic acinar cells increased pancreatic edema, necrotic cell death, infiltration of inflammatory cells and fibrosis in pancreas after cerulein treatment. tfeb and tfe3 DKO mice also developed spontaneous pancreatitis with increased pancreatic trypsin activities, edema and infiltration of inflammatory cells. Finally, decreased TFEB nuclear staining was associated with human pancreatitis. In conclusion, our results indicate a critical role of impaired TFEB-mediated lysosomal biogenesis in promoting the pathogenesis of pancreatitis. Abbreviations: AC: acinar cell; AMY: amylase; ATP6V1A: ATPase, H+ transporting, lysosomal V1 subunit A; ATP6V1B2: ATPase, H+ transporting, lysosomal V1 subunit B2; ATP6V1D: ATPase, H+ transporting, lysosomal V1 subunit D; ATP6V1H: ATPase, H+ transporting, lysosomal V1 subunit H; AV: autophagic vacuole; CDE: choline-deficient, ethionine-supplemented; CLEAR: coordinated lysosomal expression and regulation; CQ: chloroquine; EIF4EBP1: eukaryotic translation initiation factor 4E binding protein 1; EM: electron microscopy; GAPDH: glyceraldehyde-3-phosphate dehydrogenase; GFP: green fluorescent protein; H & E: hematoxylin and eosin; KO: knockout; LAMP1: lysosomal-associated membrane protein 1; MAP1LC3/LC3: microtubule associated protein 1 light chain 3; MAPK1/ERK2: mitogen-activated protein kinase 1; MTORC1: mechanistic target of rapamycin kinase complex 1; ND: normal donor; NEU: neutrophil; PPARGC1A/PGC1α: peroxisome proliferator-activated receptor, gamma, coactivator 1 alpha; RIPA: radio-immunoprecipitation; RPS6: ribosomal protein S6; SQSTM1/p62: sequestosome 1; TFEB: transcription factor EB; TM: tamoxifen; WT: wild-type; ZG: zymogen granule.

Keywords: Autophagy; cerulein; experimental pancreatitis; lysosome; transcription factor.


Figures

Figure 1.
Figure 1.
Cerulein induces pancreatitis in mice. Pancreatitis was induced by 7 hourly intraperitoneal injections of cerulein (50 μg/kg) in male C57BL/6J mice. (a) Serum AMY and lipase levels were measured. Data shown are mean ± SE (n = 4). **p < 0.01 by Student t test. (b) Representative H&E staining images of mouse pancreas from cerulein treatment. Right panel was an enlarged photograph from the indicated boxed area. Arrows denote vacuolized acinar cells. Arrow heads denote infiltrated inflammatory cells. Omega denotes edema. Bar: 50 μm. (c) Representative EM images from saline and cerulein-treated mouse pancreas. N: nucleus. White arrows: large autolysosomes. Green arrows: zymogen granule. Red arrows: aberrant ER membranes. Bar: 2 µm. (d) Male GFP-LC3 transgenic mice were administrated with 7 hourly intraperitoneal injections of cerulein (50 μg/kg). Cryo-sections of pancreas were subjected to immunostaining for AMY (red) and nuclei were stained with Hoechst33342 followed by confocal microscopy. Arrows denote the co-localization of GFP-LC3 (green) and AMY. Bar: 10 µm.
Figure 2.
Figure 2.
Cerulein decreases acinar cell lysosome numbers and induces insufficient autophagy in mouse pancreas. Male GFP-LC3 transgenic mice were administrated with 7 hourly intraperitoneal injections of cerulein (50 μg/kg). Cryo-sections of pancreas were subjected to immunostaining for LAMP1 and nuclei were stained with Hoechst33342. (a) Representative confocal microscopy images of cryo-sections of pancreas are shown. Arrows represent colocalized puncta of GFP-LC3 with LAMP1. Arrowheads indicate green-only GFP-LC3 puncta. Bar: 20 µm. (b) The numbers of GFP-LC3 puncta, LAMP1 puncta and GFP-LC3/LAMP1 overlay puncta per cell in each group were quantified. More than 120 cells were counted in each mouse. Data are mean ± SE (n = 4). **p < 0,01; Student t-test analysis. (c) Male GFP-LC3 transgenic mice were administrated with chloroquine (CQ, 60 mg/kg, i.p) or saline followed by 7 hourly intraperitoneal injections of cerulein (50 μg/kg) or saline. Total pancreatic lysates were subjected to immunoblotting analysis. Densitometry analysis were performed for SQSTM1 and LC3-II (normalized to loading control GAPDH) and data shown are mean ± SE (n = 3–4).
Figure 3.
Figure 3.
Cerulein inactivates TFEB in mouse pancreas. Male C57BL/6J mice were injected 7 hourly with cerulein (50 μg/kg) or saline. (a) Representative images of immunohistochemical staining of TFEB in mouse pancreas are shown. Arrows denote the nuclear TFEB. Bar: 50 µm. (b) Immunofluorescence analysis of TFEB staining using cryo-pancreatic tissues. Nuclei were stained with Hoechst33342. Arrows denote nuclear staining of TFEB. Bar: 20 µm. (c) Immunoblotting analysis using cytoplasmic and nuclear fractions from pancreatic tissues. (d) Immunoblotting analysis using total lysates from pancreatic tissues. (e) Pancreatic RNA was extracted followed by qPCR analysis. Results were normalized to Rn18s and expressed as fold change compared to control group. Data shown are mean ± SE (n = 4–6). *p < 0.05; **p < 0,01; Student t-test analysis.
Figure 4.
Figure 4.
Time-course study of pancreatic TFEB and proteasome changes after cerulein administration in mice. Male C57BL/6J mice were injected hourly with cerulein (20 μg/kg) or saline for 1, 3 and 7 h. All mice were sacrificed 1 h after the last injection. (a) Immunoblotting analysis using total lysates from pancreatic tissues. p-TFEB, phosphorylated TFEB; t-TFEB, total TFEB. (b) Pancreatic proteasome activities were measured. Data are mean ± SE (n = 3–4). (c) Male C57BL/6J mice were pretreated with bortezomib (Bort, 1 mg/kg, i.p.) for overnight followed by a second booster treatment 1 h before one dose of cerulein treatment (1 h). Sal: Saline; Veh: Vehicle. Pancreatic proteasomal activities were measured. Data are expressed as fold change compared to control group. Data shown are mean ± SE (n = 3–4). **p < 0.01; One-way ANOVA analysis. (d) Immunoblotting analysis using total lysates from pancreatic tissues. Activities of serum AMY (e) and lipase (f) were quantified. Data shown are mean ± SE (n = 3–4). *p < 0.05; **p < 0.01; One-way ANOVA analysis.
Figure 5.
Figure 5.
Acinar cell-specific tfeb knockout mice decrease zymogen granules and AMY protein levels after cerulein treatment. BAC-Ela-Cre; Tfebf/f (Tfebf/f) and BAC-Ela-Cre+; Tfebf/f (tfeb KO) mice were injected with tamoxifen (75 mg/kg) once a day for consecutive 5 days. Five days later after the last injection, these mice were further treated with 7 hourly injections of cerulein (20 μg/kg). (a) Immunohistochemistry analysis of TFEB staining using paraffin-embedded pancreas tissues from saline-treated mice. Bar: 50 μm. (b) Immunoblotting analysis using total pancreatic lysates from saline-treated mice. (c) Immunoblotting analysis using total lysates from pancreatic tissues. (d) Representative images of Toluidine blue staining of pancreatic tissues. Bar: 50 μm.
Figure 6.
Figure 6.
Acinar cell-specific tfeb knockout mice exacerbate cerulein-induced pancreatitis. BAC-Ela-Cre; Tfebf/f (Tfebf/f) and BAC-Ela-Cre+; Tfebf/f (tfeb KO) mice were injected with tamoxifen (75 mg/kg) once a day for consecutive 5 days. Five days later after the last injection, these mice were further treated with 7-hourly injections of cerulein (20 μg/kg). (a) Representative images of H&E staining are shown. Arrows denote for acinar cells with vacuoles; arrow heads denote for infiltrated inflammatory cells, omega denotes for edema and delta denotes for necrosis. Bar: 50 μm. (b) Individual histology score was graded and data are mean ± SE (n = 3–4). *p < 0.05; **p < 0.01; One-way ANOVA analysis. (c) Representative EM images of pancreatic tissues are shown. Lower panels are enlarged photographs from the boxed areas. White arrows: autolysosome, green arrows: ZG; red arrows: ER; arrow heads: disrupted organelles. Bar: 2 µm.
Figure 7.
Figure 7.
Increased fibrosis, MPO staining and TUNEL-positive cells in cerulein-treated acinar cell-specific tfeb knockout mice. BAC-Ela-Cre; Tfebf/f (Tfebf/f) and BAC-Ela-Cre+; Tfebf/f (tfeb KO) mice were injected with tamoxifen (75 mg/kg) once a day for consecutive 5 days. Five days later after the last injection, these mice were further treated with 7-hourly injections of cerulein (20 μg/kg). (a) Representative images of Sirius Red staining (fibrosis), MPO staining (for neutrophils, arrows) and TUNEL staining (DNA fragmentation, arrow heads) are shown. Bar: 50 μm. (b) Sirius Red staining-positive areas, MPO and TUNEL-positive cells from (a) were quantified. Data are mean ± SE (n = 3–5). **p < 0.01; One-way ANOVA analysis.
Figure 8.
Figure 8.
tfe3 and acinar cell-specific tfeb double-knockout (DKO) mice develop spontaneous pancreatitis. BAC-Ela-Cre; Tfebf/f (Tfebf/f), BAC-Ela-Cre+; Tfebf/f (tfeb KO), BAC-Ela-Cre; Tfebf/f tfe3 KO (Tfebf/f tfe3 KO) and BAC-Ela-Cre+; Tfebf/f tfe3 KO (tfeb tfe3 DKO) mice were injected with tamoxifen (75 mg/kg) once a day for consecutive 5 days and these mice were sacrificed 5 days later after the last injection of tamoxifen. (a) Representative images of H & E staining of Tfebf/f, tfeb KO, Tfebf/f tfe3 KO and tfeb tfe3 DKO mice are shown. Bar: 50 μm. (b) Pancreatic trypsin activity was measured. Data shown are mean ± SE (n = 3–4). **p < 0.01; One-way ANOVA analysis. (c) Total pancreatic lysates were subjected to Immunoblotting analysis.
Figure 9.
Figure 9.
Decreased acinar cell nuclear TFEB staining in human pancreatitis samples. (a) Representative images of TFEB immunohistochemistry staining in normal donor (ND) and pancreatitis patients (P) tissues are shown. Bar: 20 μm. (b) The number of cells with nuclear TFEB staining were counted in each group (N = 16 for ND; n = 45 for P). Data are mean ± SE and at least 6 images were counted in each sample. **: p < 0.01 by Student t test. (c) Representative H&E staining images of pancreas from ND and P are shown. Numbers of 1, 2, 3 represent 3 different human samples. Bar: 20 μm.

Similar articles

Cited by

References

    1. Pandol SJ, Lugea A, Mareninova OA, et al. Investigating the pathobiology of alcoholic pancreatitis. Alcohol Clin Exp Res. 2011. May;35(5):830–837. PubMed PMID: 21284675; PubMed Central PMCID: PMCPMC3083481. - PMC - PubMed
    1. Gukovsky I, Pandol SJ, Mareninova OA, et al. Impaired autophagy and organellar dysfunction in pancreatitis. J Gastroenterol Hepatol. 2012. March;27 Suppl 2:27–32. PubMed PMID: 22320913; PubMed Central PMCID: PMCPMC3281514. - PMC - PubMed
    1. Gukovskaya AS, Gukovsky I.. Autophagy and pancreatitis. Am J Physiol Gastrointest Liver Physiol. 2012. November 1;303(9):G993–G1003. PubMed PMID: 22961802; PubMed Central PMCID: PMCPMC3517664. - PMC - PubMed
    1. Grasso D, Ropolo A, Lo Re A, et al. Zymophagy, a novel selective autophagy pathway mediated by VMP1-USP9x-p62, prevents pancreatic cell death. J Biol Chem. 2011. March 11;286(10):8308–8324. PubMed PMID: 21173155; PubMed Central PMCID: PMCPMC3048716. - PMC - PubMed
    1. Klionsky DJ, Emr SD.. Autophagy as a regulated pathway of cellular degradation. Science. 2000. December 1;290(5497):1717–1721. PubMed PMID: 11099404; PubMed Central PMCID: PMCPMC2732363. - PMC - PubMed

Publication types

MeSH terms

Substances