

Identification of potential biomarkers related to glioma survival by gene expression profile analysis
- PMID: 30894197
- PMCID: PMC7402580
- DOI: 10.1186/s12920-019-0479-6
Identification of potential biomarkers related to glioma survival by gene expression profile analysis
Abstract
Background: Recent studies have proposed several gene signatures as biomarkers for different grades of gliomas from various perspectives. However, most of these genes can only be used appropriately for patients with specific grades of gliomas.
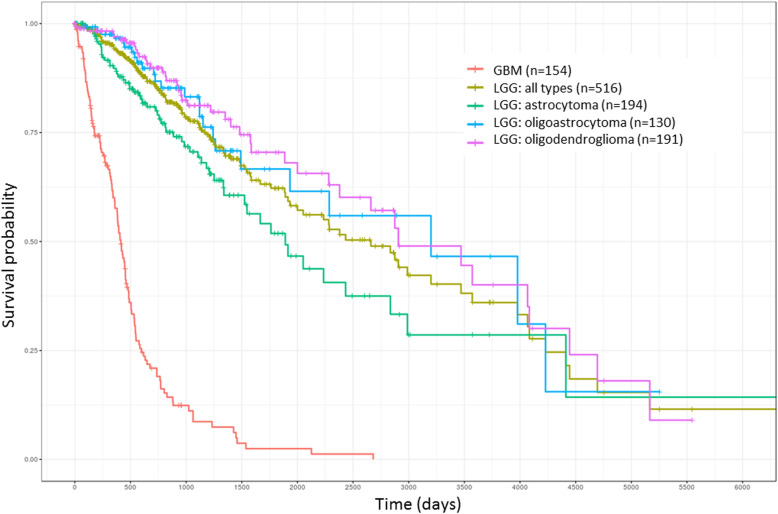
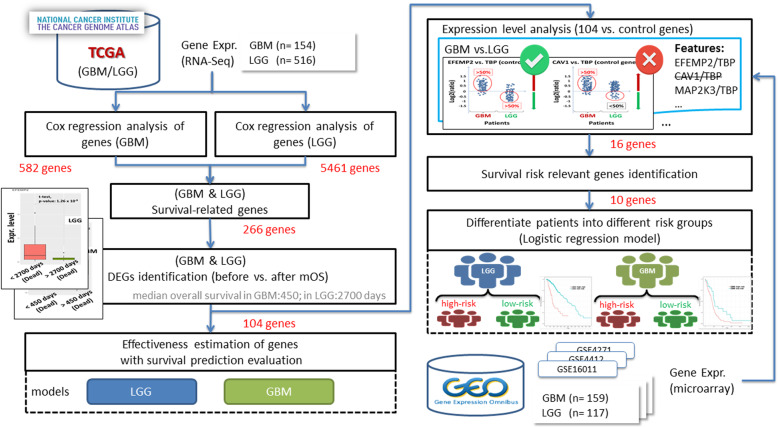
Methods: In this study, we aimed to identify survival-relevant genes shared between glioblastoma multiforme (GBM) and lower-grade glioma (LGG), which could be used as potential biomarkers to classify patients into different risk groups. Cox proportional hazard regression model (Cox model) was used to extract relative genes, and effectiveness of genes was estimated against random forest regression. Finally, risk models were constructed with logistic regression.
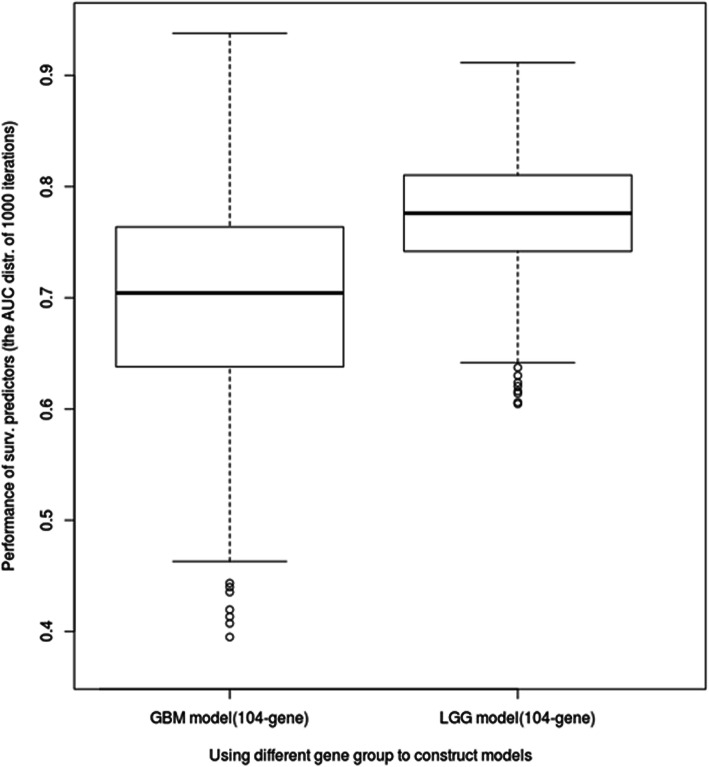
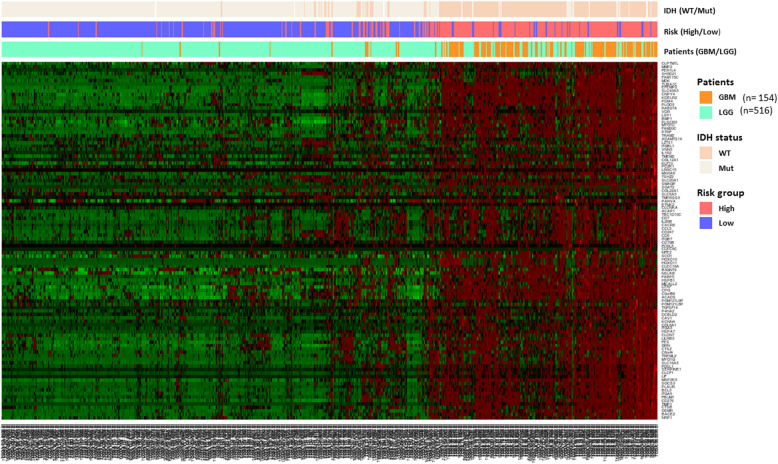
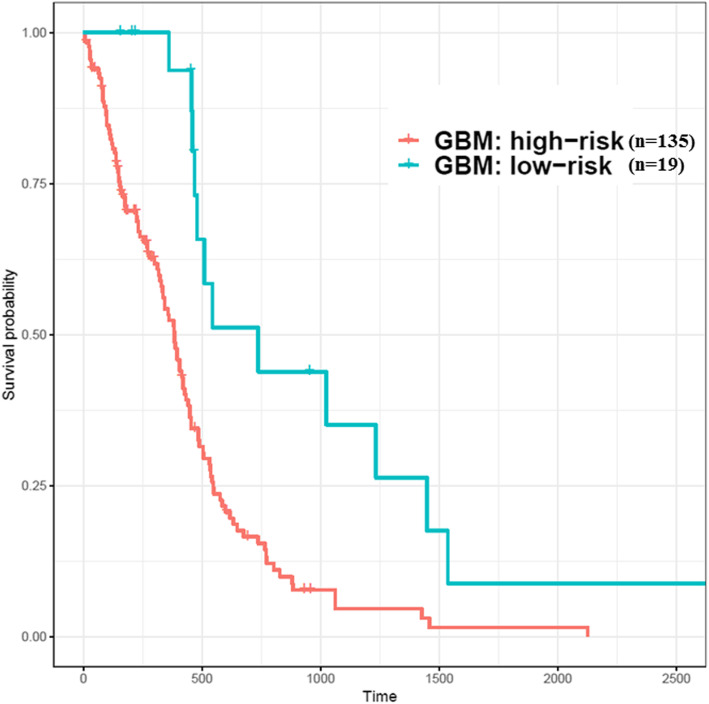
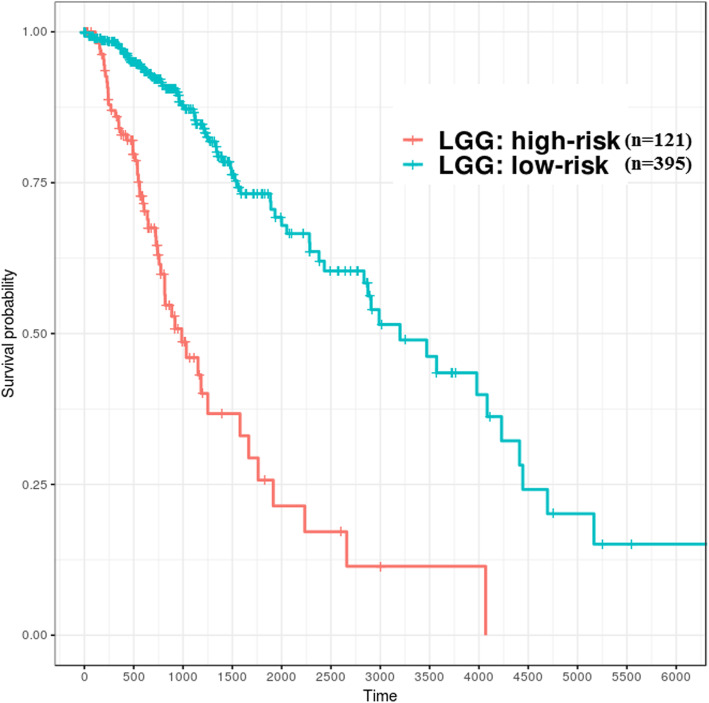
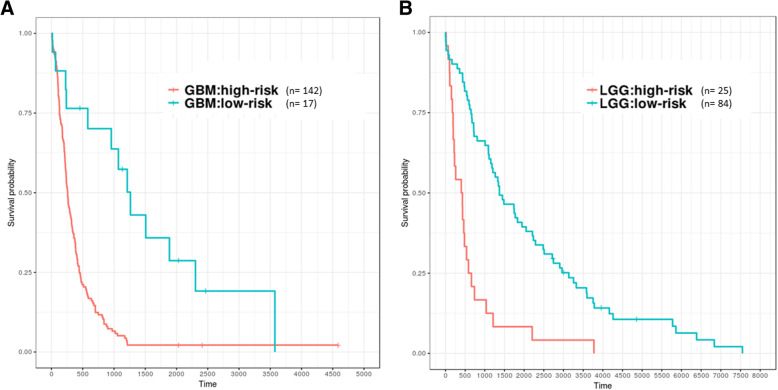
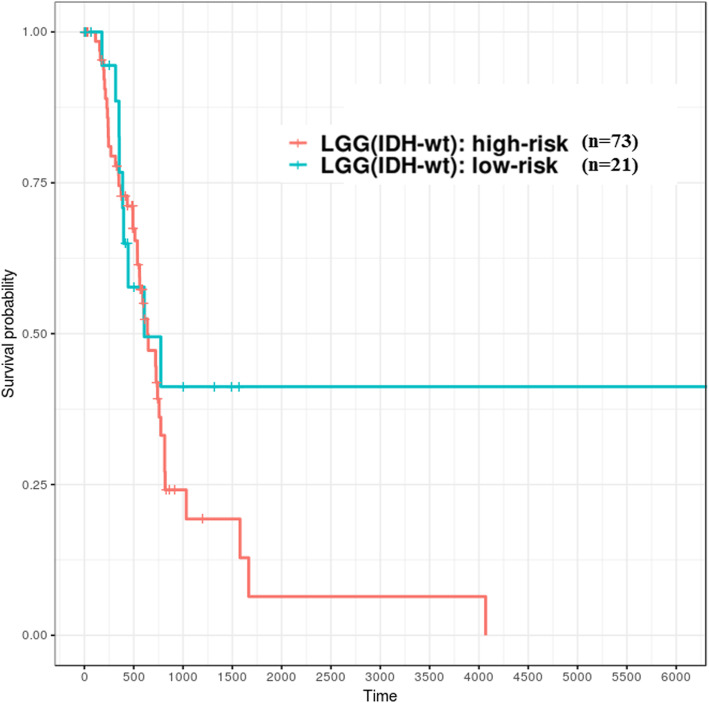
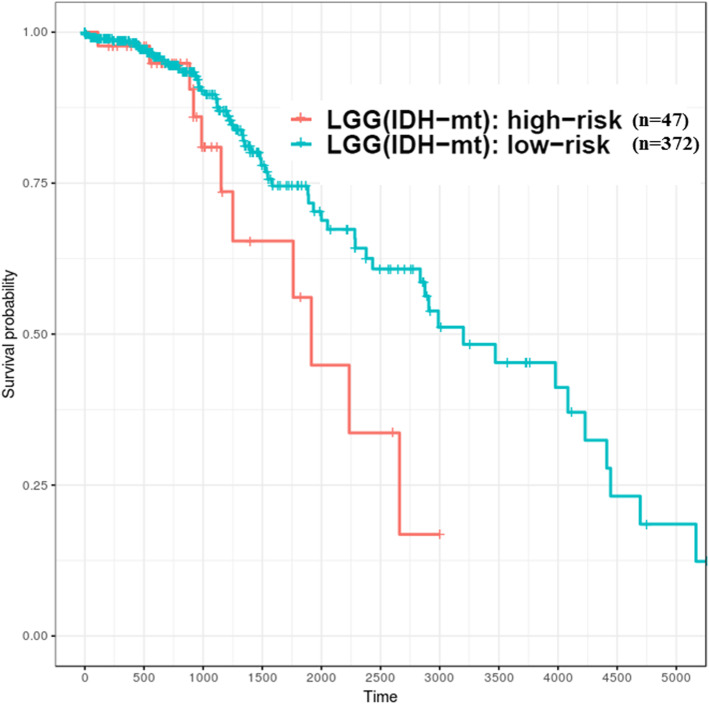
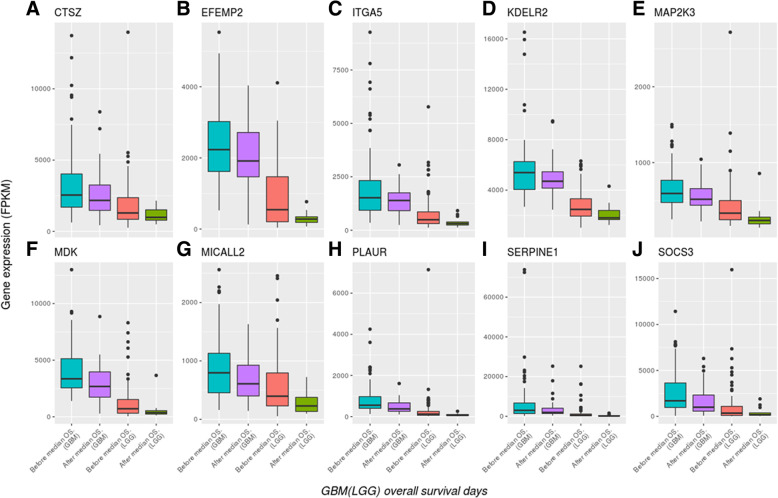
Results: We identified 104 key genes that were shared between GBM and LGG, which could be significantly correlated with patients' survival based on next-generation sequencing data obtained from The Cancer Genome Atlas for gene expression analysis. The effectiveness of these genes in the survival prediction of GBM and LGG was evaluated, and the average receiver operating characteristic curve (ROC) area under the curve values ranged from 0.7 to 0.8. Gene set enrichment analysis revealed that these genes were involved in eight significant pathways and 23 molecular functions. Moreover, the expressions of ten (CTSZ, EFEMP2, ITGA5, KDELR2, MDK, MICALL2, MAP 2 K3, PLAUR, SERPINE1, and SOCS3) of these genes were significantly higher in GBM than in LGG, and comparing their expression levels to those of the proposed control genes (TBP, IPO8, and SDHA) could have the potential capability to classify patients into high- and low- risk groups, which differ significantly in the overall survival. Signatures of candidate genes were validated, by multiple microarray datasets from Gene Expression Omnibus, to increase the robustness of using these potential prognostic factors. In both the GBM and LGG cohort study, most of the patients in the high-risk group had the IDH1 wild-type gene, and those in the low-risk group had IDH1 mutations. Moreover, most of the high-risk patients with LGG possessed a 1p/19q-noncodeletion.
Conclusion: In this study, we identified survival relevant genes which were shared between GBM and LGG, and those enabled to classify patients into high- and low-risk groups based on expression level analysis. Both the risk groups could be correlated with the well-known genetic variants, thus suggesting their potential prognostic value in clinical application.
Keywords: Biomarkers; Gene signature; High-grade glioma; Low-grade glioma (LGG); Prognosis.
Conflict of interest statement
The authors declare that they have no competing interests.
Figures
Similar articles
-
SHOX2 is a Potent Independent Biomarker to Predict Survival of WHO Grade II-III Diffuse Gliomas.EBioMedicine. 2016 Nov;13:80-89. doi: 10.1016/j.ebiom.2016.10.040. Epub 2016 Oct 28. EBioMedicine. 2016. PMID: 27840009 Free PMC article.
-
Identification and validation of a novel eight mutant-derived long non-coding RNAs signature as a prognostic biomarker for genome instability in low-grade glioma.Aging (Albany NY). 2021 Jun 3;13(11):15164-15192. doi: 10.18632/aging.203079. Epub 2021 Jun 3. Aging (Albany NY). 2021. PMID: 34081618 Free PMC article.
-
Integrative Analysis of Neuregulin Family Members-Related Tumor Microenvironment for Predicting the Prognosis in Gliomas.Front Immunol. 2021 May 13;12:682415. doi: 10.3389/fimmu.2021.682415. eCollection 2021. Front Immunol. 2021. PMID: 34054873 Free PMC article.
-
mRNA markers for survival prediction in glioblastoma multiforme patients: a systematic review with bioinformatic analyses.BMC Cancer. 2024 May 21;24(1):612. doi: 10.1186/s12885-024-12345-z. BMC Cancer. 2024. PMID: 38773447 Free PMC article.
-
Micro RNA Molecules as Modulators of Treatment Resistance, Immune Checkpoints Controllers and Sensitive Biomarkers in Glioblastoma Multiforme.Int J Mol Sci. 2020 Feb 22;21(4):1507. doi: 10.3390/ijms21041507. Int J Mol Sci. 2020. PMID: 32098401 Free PMC article. Review.
Cited by
-
Micall2 Is Responsible for the Malignancy of Clear Cell Renal Cell Carcinoma.Yonago Acta Med. 2023 Feb 20;66(1):171-179. doi: 10.33160/yam.2023.02.021. eCollection 2023 Feb. Yonago Acta Med. 2023. PMID: 36811029 Free PMC article.
-
Identification of SERPINE1 as a Regulator of Glioblastoma Cell Dispersal with Transcriptome Profiling.Cancers (Basel). 2019 Oct 25;11(11):1651. doi: 10.3390/cancers11111651. Cancers (Basel). 2019. PMID: 31731490 Free PMC article.
-
Research Progress of Gliomas in Machine Learning.Cells. 2021 Nov 15;10(11):3169. doi: 10.3390/cells10113169. Cells. 2021. PMID: 34831392 Free PMC article. Review.
-
Multi-dimensional omics characterization in glioblastoma identifies the purity-associated pattern and prognostic gene signatures.Cancer Cell Int. 2020 Jan 31;20:37. doi: 10.1186/s12935-020-1116-3. eCollection 2020. Cancer Cell Int. 2020. PMID: 32021566 Free PMC article.
-
KDELR2 Promotes Glioblastoma Tumorigenesis Targeted by HIF1a via mTOR Signaling Pathway.Cell Mol Neurobiol. 2019 Nov;39(8):1207-1215. doi: 10.1007/s10571-019-00715-2. Epub 2019 Jul 25. Cell Mol Neurobiol. 2019. PMID: 31342232 Free PMC article.
References
Publication types
MeSH terms
Substances
LinkOut - more resources
Full Text Sources
Medical
Miscellaneous
