. 2019 Apr 1;79(7):1438-1450.
doi: 10.1158/0008-5472.CAN-18-1220. Epub 2019 Mar 20.

4E-BP1 Is a Tumor Suppressor Protein Reactivated by mTOR Inhibition in Head and Neck Cancer

Affiliations

4E-BP1 Is a Tumor Suppressor Protein Reactivated by mTOR Inhibition in Head and Neck Cancer

Zhiyong Wang et al. Cancer Res. .

Abstract

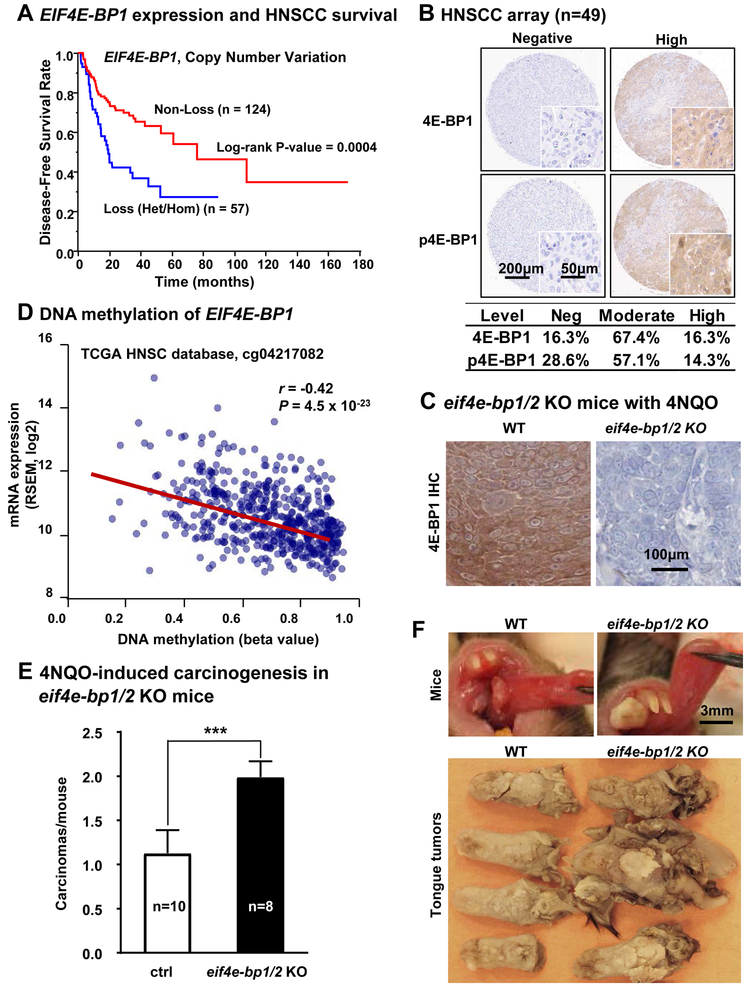
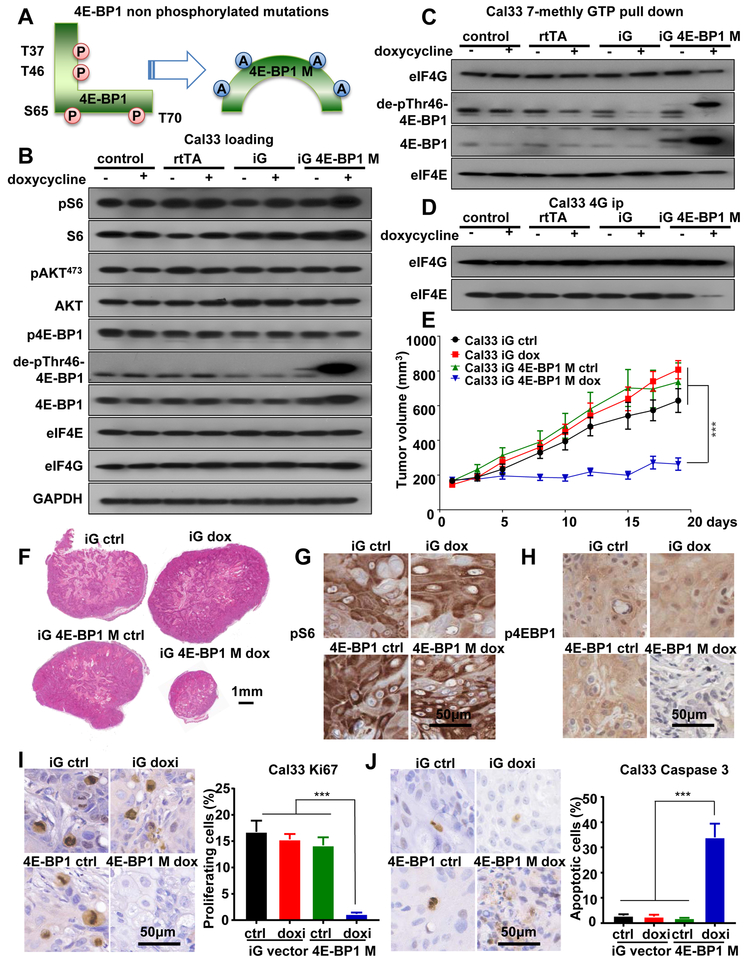
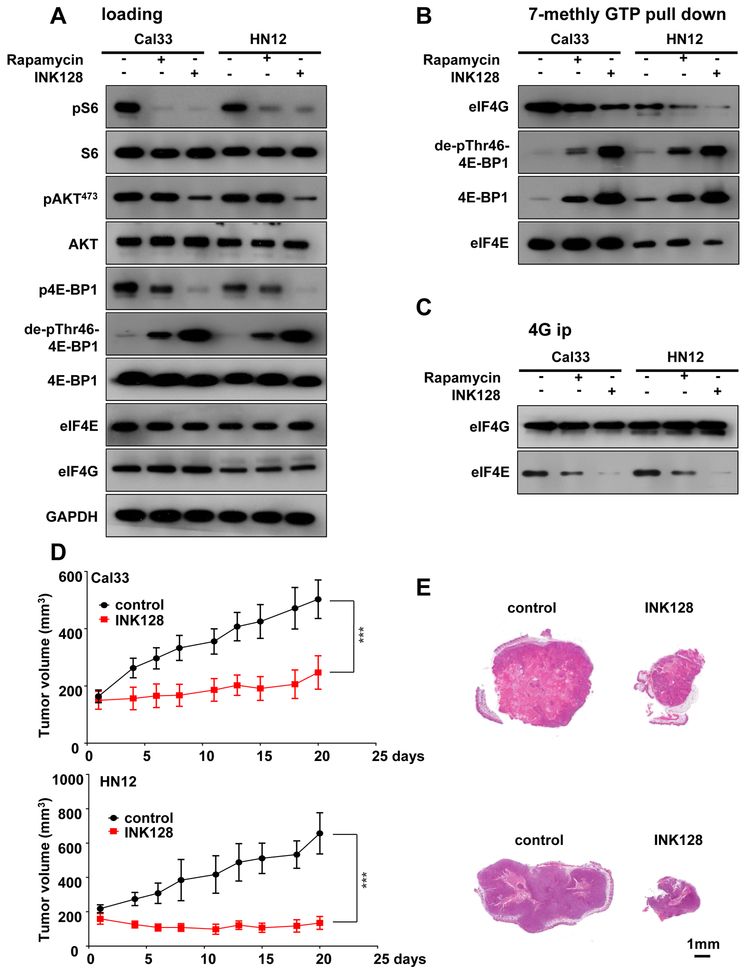
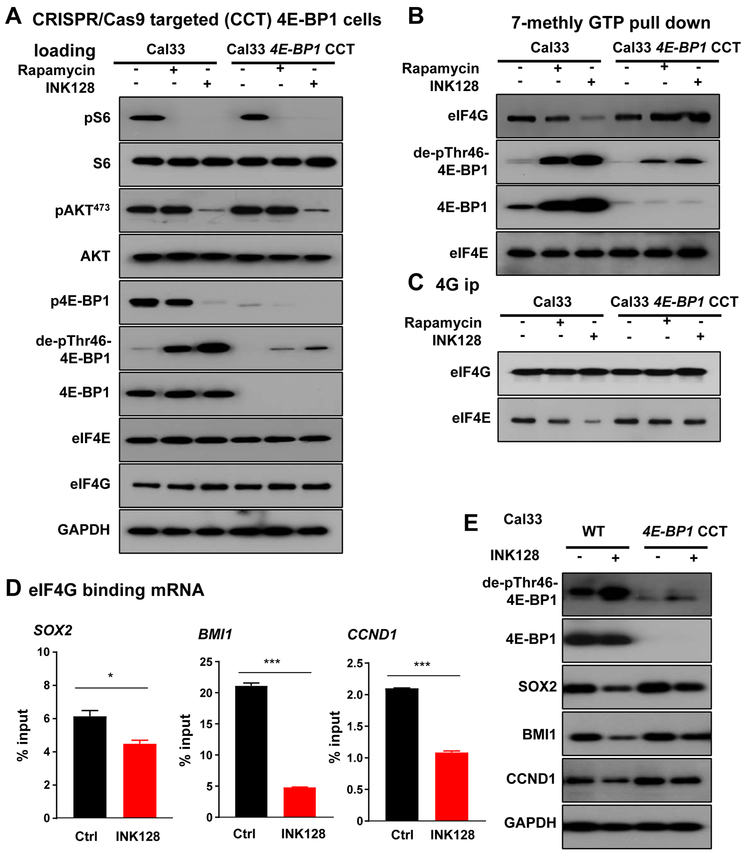
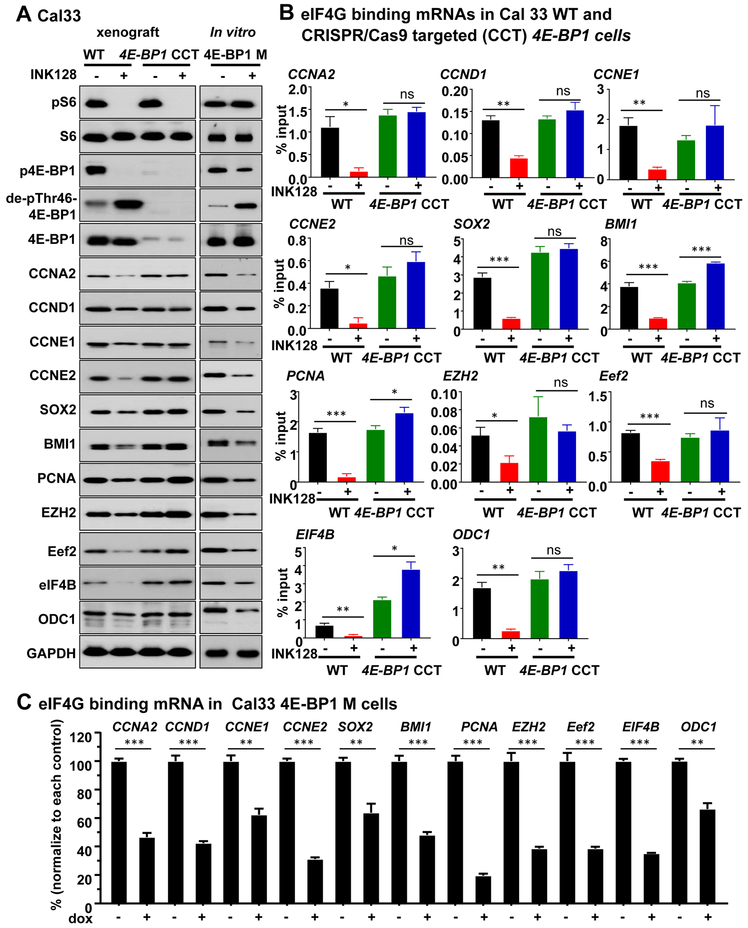
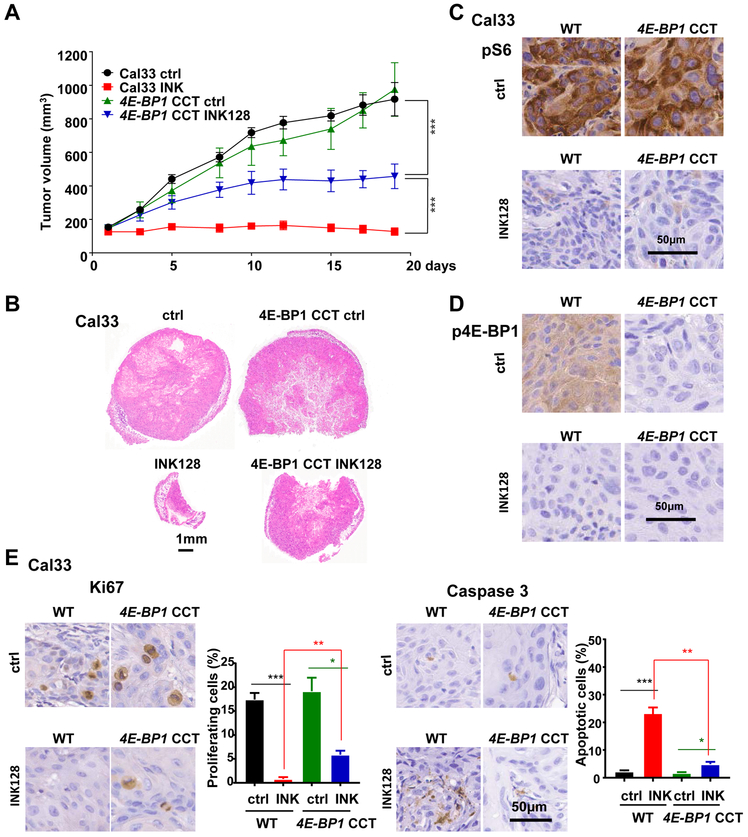
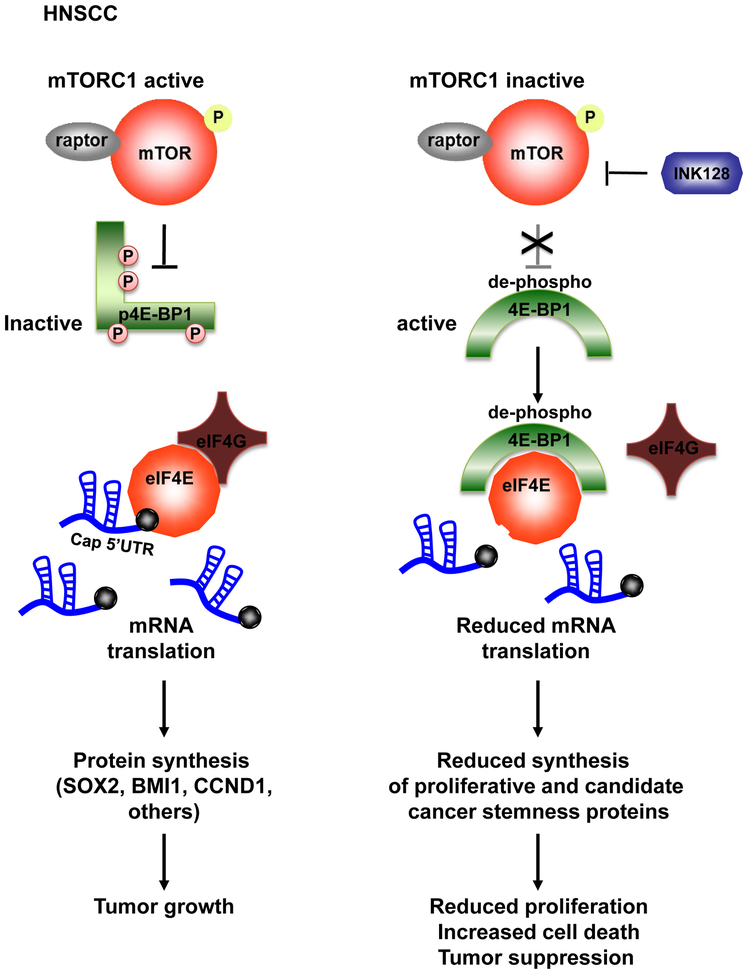
Aberrant activation of the PI3K-mTOR signaling pathway occurs in >80% of head and neck squamous cell carcinomas (HNSCC), and overreliance on this signaling circuit may in turn represent a cancer-specific vulnerability that can be exploited therapeutically. mTOR inhibitors (mTORi) promote tumor regression in genetically defined and chemically induced HNSCC animal models, and encouraging results have been recently reported. However, the mTOR-regulated targets contributing to the clinical response have not yet been identified. Here, we focused on EIF4E-BP1 (4E-BP1), a direct target of mTOR that serves as key effector for protein synthesis. A systematic analysis of genomic alterations in the PIK3CA-mTOR pathway in HNSCC revealed that 4E-BP1 is rarely mutated, but at least one 4E-BP1 gene copy is lost in over 35% of the patients with HNSCC, correlating with decreased 4E-BP1 protein expression. 4E-BP1 gene copy number loss correlated with poor disease-free and overall survival. Aligned with a tumor-suppressive role, 4e-bp1/2 knockout mice formed larger and more lesions in models of HNSCC carcinogenesis. mTORi treatment or conditional expression of a mutant 4E-BP1 that cannot be phosphorylated by mTOR was sufficient to disrupt the translation-initiation complex and prevent tumor growth. Furthermore, CRISPR/Cas9-targeted 4E-BP1 HNSCC cells resulted in reduced sensitivity to mTORi in vitro and in vivo. Overall, these findings indicate that in HNSCC, mTOR persistently restrains 4E-BP1 via phosphorylation and that mTORi can restore the tumor-suppressive function of 4E-BP1. Our findings also support 4E-BP1 expression and phosphorylation status as a mechanistic biomarker of mTORi sensitivity in patients with HNSCC. SIGNIFICANCE: These findings suggest that EIF4E-BP1 acts as a tumor suppressor in HNSCC and that 4E-BP1 dephosphorylation mediates the therapeutic response to mTORi, providing a mechanistic biomarker for future precision oncology trials.


Conflict of interest statement

Competing financial interests

On behalf of all other authors, the corresponding author states that there is no conflict of interest

Disclaimers: The authors declare no potential conflicts of interest.

Figures

Figure 1:
Figure 1:. EIF4EBP1 is a candidate HNSCC tumor suppressor gene.
(A) The TCGA (The Cancer Genome Atlas) database was used to determine the relationship between EIF4EBP1 copy number variation (CNV) and disease-free survival (DFS). Data of CNV predicted by GISTIC algorism were available for 181 HNSCC patients in DFS (Log-rank test; p = 0.0004). Non-loss includes normal, copy gain and amplification. Loss includes heterozygous deletion and homozygous deletions. (B) Top, representative cores of HNSCC lesions stained with total 4E-BP1 (4E-BP1) and phospho-4E-BP1 (p4E-BP1, Thr37/46) using a HNSCC tissue microarray. Bottom, the intensity of staining was scored as previously described, (n=49) (6) and divided into negative, moderate and high expressed groups. (C) Representative immunohistochemical analysis of 4E-BP1 in WT and eif4ebp1/2 KO mice, respectively. (D) Significant negative correlation between DNA methylation and gene expression in the first intron of EIF4EBP1, suggestive of DNA methylation-mediated gene silencing (n=566, r = −0.42, p = 4.56 × 10⁻²³). (E) 4NQO-induced carcinogenesis in eif4e-bp1/2 KO mice. Numbers of squamous cell carcinomas at the end of 4NQO-carcinogen treatment (mean ± SEM, n of WT mice = 10, n of 4e-bp1/2 KO mice= 8). (F) Top, representative pictures of live mice tongue in WT and eif4e-bp1/2 KO mice on week 26 of 4NQO treatment. Bottom, representative pictures of tongue lesions in WT and eif4e-bp1/2 KO mice on week 26 (time point when mice were sacrificed) of 4NQO treatment. These tumors in eif4e-bp1/2 KO mice were larger than those in wild type C57Bl/6 mice.
Figure 2:
Figure 2:. Reduced growth and apoptotic effect of HNSCC cells engineered to express a mutant form of 4E-BP1 lacking mTOR phosphorylation sites.
(A) Scheme of 4E-BP1 M. The amino acids T37, T46, S65 and T70 of 4E-BP1 were mutated into alanine (A). This 4E-BP1 M remain non-phosphorylated when expressed. (B). Western blot analysis of signaling events in HNSCC expressing 4E-BP1 M. Wild-type Cal33 cells (control), cells expressing rtTA (rtTA), cells infected with rtTA and inducible GFP fusion empty lentiviral virus (iG), or cells infected with rtTA and inducible GFP fusion 4E-BP1 M lentiviral virus (iG 4E-BP1) were turned on by doxycycline for 2 days, and lysates were analyzed as indicated. (C) 7mGTP pull down and (D) eIF4G co-IP analyzing the regulation of complex formation by 4E-BP1. Cells (same as panel B) were treated as described above, and analyzed as indicated. (E) Cal33 cells expressing empty vector (iG) or 4E-BP1 M (iG 4E-BP1 M) were transplanted into athymic nude mice, and when they reached approximately 200 mm3, mice were fed with either regular food (ctrl) or doxycycline food (dox) to turn on 4E-BP1 M expression. *** P < .001 when comparing the 4E-BP1 M group with empty vector groups or 4E-BP1 control group (regular food) mice (n = 10 per group). (F) Representative histological tissue sections from each treatment group in panel E. Scale bars represent 1 mm. (G and (H) Representative immunohistochemical analysis of pS6 and p4E-BP1 in tumors from panel E. (I) and (J) Representative immunohistochemical analysis (left) and quantification (right) of Ki67 and cleaved-Caspase 3 in tumors from panel E. Data are represented as mean ± SEM, n= 3 in each group.
Figure 3:
Figure 3:. Anti-tumor effect of mTOR kinase inhibition with INK128: Disruption of 4E-BP1 protein complexes.
(A) Western blot analysis of signaling events in HNSCC cells treated by mTOR inhibitors. Cal33 and HN12 cells were treated by Rapamycin (20nM) or INK128 (20nM) for 1 hour, and lysates were analyzed as indicated. (B) 7mGTP pull down and (C) eIF4G co-IP to analyze the regulation of translational initiation complex formation by mTOR inhibition. Cells (similar to panel A) were treated as described above, and analyzed as indicated. (D) Cal33 (top) and HN12 (bottom) were transplanted into athymic nude mice, and, when they reached approximately 200 mm3, mice were treated with vehicle diluent or INK128 for approximately 20 days, as indicated. (E) Representative histological sections from each treatment group in panel D. Scale bars represent 1 mm. (***P < .001 when compared with the control-treated group, n = 10 per group).
Figure 4:
Figure 4:. CRISPR-CAS9 targeted 4E-BP1 HNSCC cells results in insensitivity to mTORi in vitro, and reveals a role for 4E-BP1 in the regulation of the expression of proliferative molecules.
(A) CRISPR/Cas9 targeted 4E-BP1 cells (4E-BP1 CCT) was achieved. Western blot analysis of signaling events in HNSCC cells treated by mTOR inhibitors. Cal33 and Cal33 4E-BP1 CCT cells were treated by Rapamycin (20nM) or INK128 (20nM) for 1 hour, and lysates were analyzed as indicated. (B) 7mGTP pull down and (C) eIF4G co-IP analyses of the regulation of translation initiation complex formation by mTOR inhibition. Cells (similar to panel A) were treated as described above, and analyzed as indicated. (D) Cal33 cells were treated with INK128 for 2 days, the lysates were subjected to eIF4G co-IP and associated RNAs analyzed (bound RNA). The same treated lysates were used to isolate total RNA. RNAs were followed by qPCR to assess the 4G-binding levels of regulated genes. Data are mean ±SEM % of total input (ns P>.05, *P<.05, **P<.01, ***P < .001 when compared with the control-treated group, n = 3 per group). (E) Cells were treated by INK128 for 2 days, lysates were analyzed as indicated.
Figure 5:
Figure 5:. Representative 4E-BP1 regulated molecules.
(A) Western blot analysis of signaling and 4E-BP1 regulated molecules in vitro and in vivo in 4E-BP1 control and 4E-BP1 CCT HNSCC xenografts (left), and HNSCC cells expressing the 4E-BP1 M (right). Left, cells were transplanted into athymic nude mice, and when they reached approximately 200 mm3, mice were treated with vehicle diluent or INK128 for 5 days, as indicated. Right, cells infected with rtTA and inducible GFP fusion 4E-BP1 M lentiviral virus (iG 4E-BP1 M) were turned on by doxycycline for 5 days. Lysate were analyzed as indicated. (B) The lysates of 4E-BP1 WT and 4E-BP1 CCT HNSCC xenografts (same as panel A) were subjected to eIF4G co-IP and associated RNAs analyzed (bound RNA). The same treated lysates were used to isolate total RNA. RNAs were followed by qPCR to assess the eIF4G-binding levels of regulated genes. (C) The lysates of 4E-BP1 M (same as panel A) were subjected to eIF4G co-IP and associated RNAs analyzed (bound RNA). The same treated lysates were used to isolate total RNA. RNAs were followed by qPCR to assess the eIF4G-binding levels of regulated genes. For each gene, data were normalized to its control group. Data are mean ±SEM % of total input (ns P>0.05, *P<0.05, **P<0.01, ***P < 0.001 when compared with the control-treated group, n = 3 per group).
Figure 6:
Figure 6:. Reduced sensitivity to mTOR inhibition in CRISPR/Cas9 targeted 4E-BP1 HNSCC cells in vivo
(A) Cal33 control and 4E-BP1 CCT cells were transplanted into athymic nude mice and treated by INK128. (Data are the mean ±SEM of the tumor volume; ***P < .001 when compared with the control-treated group, n = 10 per group). (B) Representative histological sections from each treatment group in panel A. Scale bars represent 1 mm. (C-D) Representative immunohistochemical analysis of pS6 (C) and p4E-BP1(D) in tumors from panel A. (E) Representative immunohistochemical analysis and quantification of Ki67 (left) and cleaved-Caspase 3 to determine the percentage of apoptotic cells (right) in tumors from panel A.
Figure 7:
Figure 7:. Schematic representation of the mechanism by which mTOR inhibition acts in HNSCC through 4E-BP1.
See discussion for details.

References

    1. Siegel RL, Miller KD, Jemal A. Cancer statistics, 2018. CA: a cancer journal for clinicians; 2018;68:7–30 - PubMed
    1. Leemans CR, Braakhuis BJ, Brakenhoff RH. The molecular biology of head and neck cancer. Nat Rev Cancer 2011;11:9–22 - PubMed
    1. Chaturvedi AK, Engels EA, Pfeiffer RM, Hernandez BY, Xiao W, Kim E, et al. Human papillomavirus and rising oropharyngeal cancer incidence in the United States. J Clin Oncol 2011;29:4294–301 - PMC - PubMed
    1. Amornphimoltham P, Patel V, Sodhi A, Nikitakis NG, Sauk JJ, Sausville EA, et al. Mammalian target of rapamycin, a molecular target in squamous cell carcinomas of the head and neck. Cancer research 2005;65:9953–61 - PubMed
    1. Molinolo AA, Hewitt SM, Amornphimoltham P, Keelawat S, Rangdaeng S, Meneses Garcia A, et al. Dissecting the Akt/mammalian target of rapamycin signaling network: emerging results from the head and neck cancer tissue array initiative. Clinical cancer research : an official journal of the American Association for Cancer Research 2007;13:4964–73 - PubMed

Publication types

MeSH terms