. 2019 Apr;29(4):635-645.
doi: 10.1101/gr.234443.118. Epub 2019 Mar 20.

Resolving the full spectrum of human genome variation using Linked-Reads

Affiliations

Resolving the full spectrum of human genome variation using Linked-Reads

Patrick Marks et al. Genome Res. 2019 Apr.

Abstract

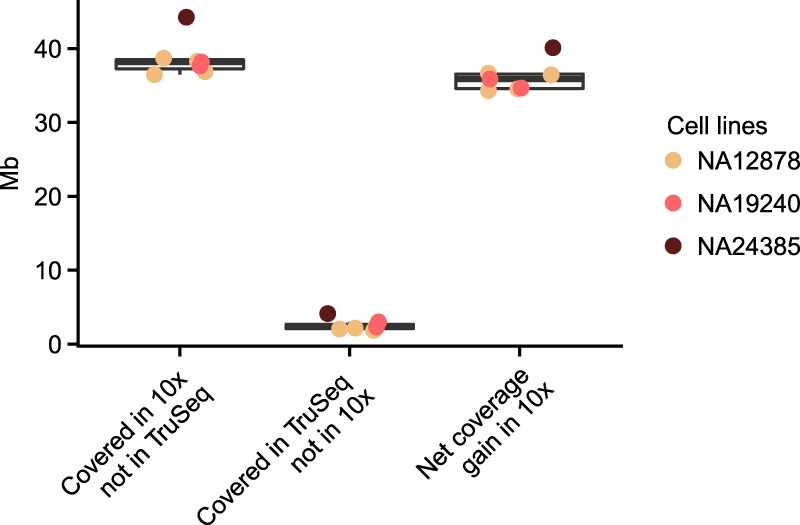
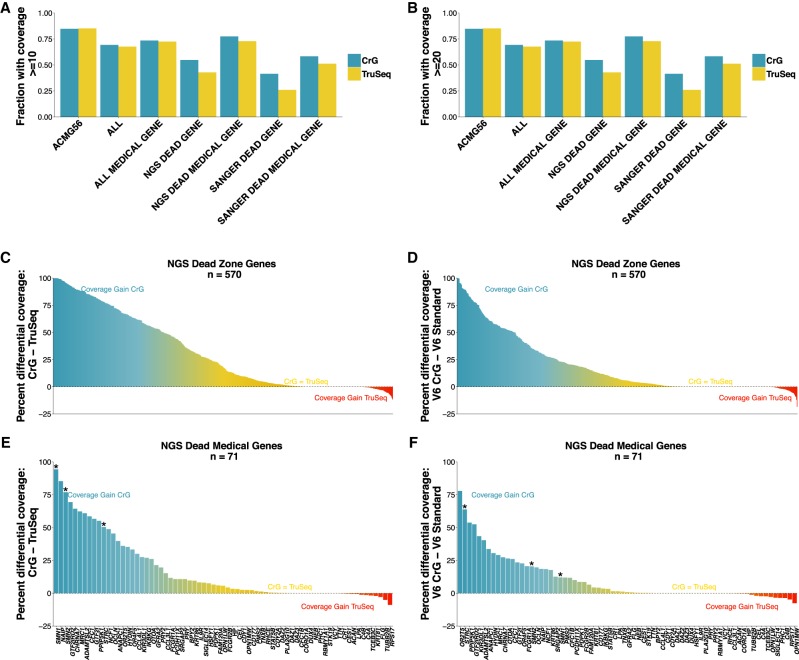
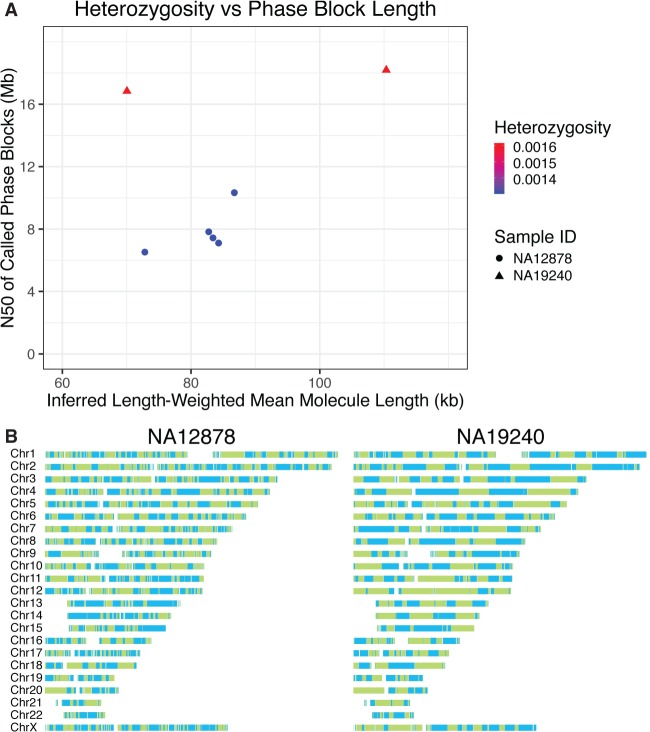
Large-scale population analyses coupled with advances in technology have demonstrated that the human genome is more diverse than originally thought. To date, this diversity has largely been uncovered using short-read whole-genome sequencing. However, these short-read approaches fail to give a complete picture of a genome. They struggle to identify structural events, cannot access repetitive regions, and fail to resolve the human genome into haplotypes. Here, we describe an approach that retains long range information while maintaining the advantages of short reads. Starting from ∼1 ng of high molecular weight DNA, we produce barcoded short-read libraries. Novel informatic approaches allow for the barcoded short reads to be associated with their original long molecules producing a novel data type known as "Linked-Reads". This approach allows for simultaneous detection of small and large variants from a single library. In this manuscript, we show the advantages of Linked-Reads over standard short-read approaches for reference-based analysis. Linked-Reads allow mapping to 38 Mb of sequence not accessible to short reads, adding sequence in 423 difficult-to-sequence genes including disease-relevant genes STRC, SMN1, and SMN2 Both Linked-Read whole-genome and whole-exome sequencing identify complex structural variations, including balanced events and single exon deletions and duplications. Further, Linked-Reads extend the region of high-confidence calls by 68.9 Mb. The data presented here show that Linked-Reads provide a scalable approach for comprehensive genome analysis that is not possible using short reads alone.


Figures

Figure 1.
Figure 1.
Coverage evenness. Distribution of read coverage for the entire human genome (GRCh37). Comparisons between 10x Genomics Chromium Genome (CrG), 10x Genomics GemCode (GemCode), and Illumina TruSeq PCR-free standard short-read NGS library preparations (Standard Short-Read [PCR-Free]). Sequencing was performed in an effort to match coverage (Methods). Note the shift of the CrG curve to the right, showing the improved coverage of Chromium versus GemCode. The x-axis represents the fold read coverage across the genome, and the y-axis represents the total number of bases covered at any given read depth.
Figure 2.
Figure 2.
Comparison of unique genome coverage by assay. The y-axis shows the amount of sequence with a coverage of ≥5 reads at MapQ ≥30. Column 1 shows amount of the genome covered by 10x Chromium where PCR-free TruSeq does not meet that metric. Column 2 shows the amount of the genome covered by PCR-free TruSeq where 10x Chromium does not meet the metric. Column 3 shows the net gain of genome sequence with high-quality alignments when using 10x Chromium versus PCR-free TruSeq. The comparison was performed on samples with matched sequence coverage (Methods).
Figure 3.
Figure 3.
Gene finishing metrics. Gene finishing metrics for whole-genome and whole-exome sequencing across selected gene sets. Genome is shown on left, exome on right. Gene finishing is defined as the percentage of exonic bases with at least 10-fold coverage for genome (A) and at least 20× for exome (B) (Mapping quality score ≥MapQ30). (A,B) Gene finishing statistics for seven disease-relevant gene panels. Shown is the average value across all genes in each panel. Although Chromium provides a coverage advantage in all panel sets, the impact is particularly profound for “NGS Dead Zone” genes. (CF) Net coverage differences for individual genes when comparing Chromium to PCR-free TruSeq. Each bar shows the difference between the coverage in PCR-free TruSeq from the coverage in 10x Chromium. (C,D) The 570 NGS “dead zone” genes for genome (C) and exome (D). (E,F) The graphs are limited to the list of NGS dead zone genes implicated in Mendelian disease. In CF, the blue coloring highlights genes that are inaccessible to short-read approaches, but accessible using CrG; the yellow coloring indicates genes where CrG is equivalent to short reads or provides only modest improvement. The red coloring shows genes with a slight coverage increase in TruSeq, although these genes are typically still accessible to CrG. (*) Genes SMN1, SMN2, and STRC. The comparison was performed on samples with matched coverage (Methods).
Figure 4.
Figure 4.
Haplotype reconstruction and phasing. (A) Inferred length-weighted mean molecule length plotted against N50 of called Phase blocks (both metrics reported by Long Ranger) and differentiated by sample ID and heterozygosity. Heterozygosity was calculated by dividing the total number of heterozygous positions called by Long Ranger by the total number of non-N bases in the reference genome (GRCh37). Two replicates of NA19240 and five replicates of NA12878 were used. Samples with higher heterozygosity produce longer phase blocks than samples with less diversity when controlling for input molecule length. (B) Phase block distributions across the genome for input length matched Chromium Genome samples NA12878 and NA19240. Phase blocks are shown as displayed in Loupe Genome Browser. Solid colors indicate phase blocks. Note the longer phase blocks in the more diverse NA19240 sample.
Figure 5.
Figure 5.
Validated example of impact of molecule length on phasing (7.25 Gb). Blue dots represent samples for which the variants of interest are not phased, and green dots represent samples for which there is phasing of the variants of interest. At longer molecule lengths (>50 kb), the molecule length was always longer than the maximum distance between heterozygous SNPs in a gene, and phasing between the causative SNPs was always observed. As molecule length shortens, it becomes more likely that the maximum distance between SNPs exceeds the molecule length (reflected as a negative difference value), and phasing between the causative SNPs was never observed in these cases. When maximum distance is similar to the molecule length, causative SNPs may or may not be phased. This is likely impacted by the molecule length and variant distribution within the sample.
Figure 6.
Figure 6.
Deletion size distributions. Long Ranger calls intersected with the svclassify truth set by size. True positive calls are blue, false negative calls are green, and false positive calls are orange. Most false positives are present in the <250-bp size range, reflecting the lack of small deletions in the svclassify set. Peaks corresponding to Alu and L1/L2 elements can be seen at ∼320 bp and ∼6 kb, respectively.

References

    1. The 1000 Genomes Project Consortium. 2015. A global reference for human genetic variation. Nature 526: 68–74. 10.1038/nature15393 - DOI - PMC - PubMed
    1. Alkan C, Coe BP, Eichler EE. 2011. Genome structural variation discovery and genotyping. Nat Rev Genet 12: 363–376. 10.1038/nrg2958 - DOI - PMC - PubMed
    1. Amini S, Pushkarev D, Christiansen L, Kostem E, Royce T, Turk C, Pignatelli N, Adey A, Kitzman JO, Vijayan K, et al. 2014. Haplotype-resolved whole-genome sequencing by contiguity-preserving transposition and combinatorial indexing. Nat Genet 46: 1343–1349. 10.1038/ng.3119 - DOI - PMC - PubMed
    1. Bionano Genomics. 2017. Bionano genome mapping identifies large structural variants in cancer and genetic disorders. https://bionanogenomics.com/wp-content/uploads/2017/02/Bionano_Human-Str....
    1. Bishara A, Liu Y, Weng Z, Kashef-Haghighi D, Newburger DE, West R, Sidow A, Batzoglou S. 2015. Read clouds uncover variation in complex regions of the human genome. Genome Res 25: 1570–1580. 10.1101/gr.191189.115 - DOI - PMC - PubMed

MeSH terms

Substances

LinkOut - more resources