

Comprehensive Analysis of Individual Variation in the Urinary Proteome Revealed Significant Gender Differences
- PMID: 30894400
- PMCID: PMC6553935
- DOI: 10.1074/mcp.RA119.001343
Comprehensive Analysis of Individual Variation in the Urinary Proteome Revealed Significant Gender Differences
Abstract
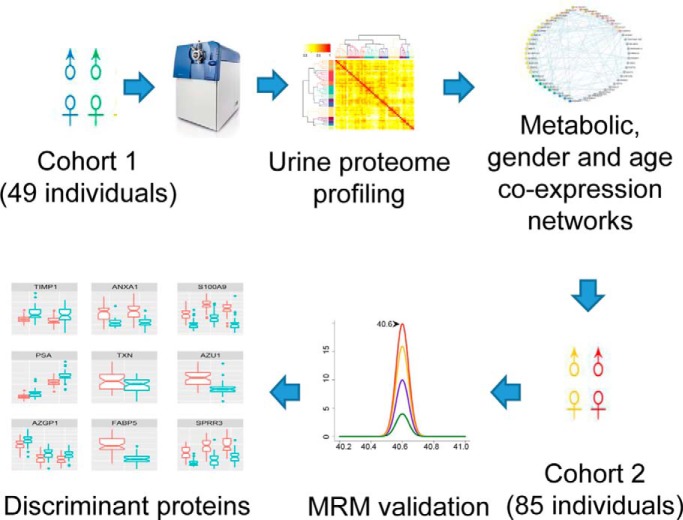
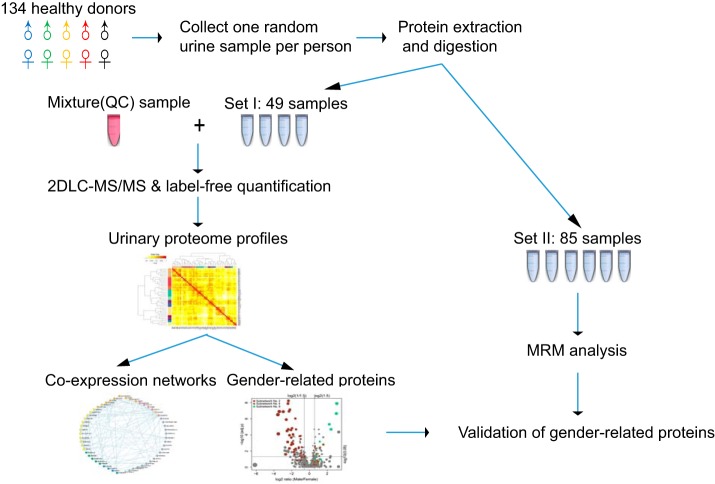
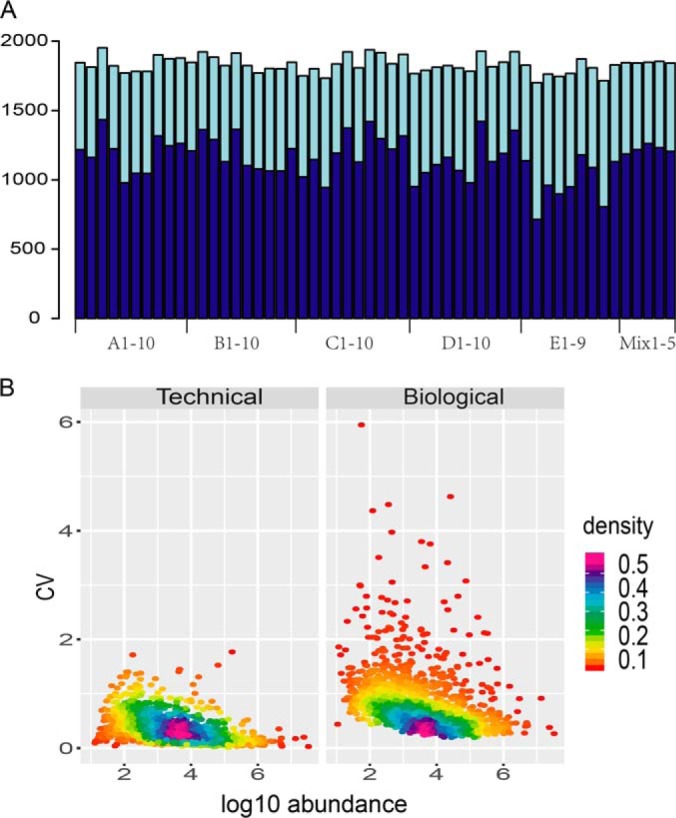
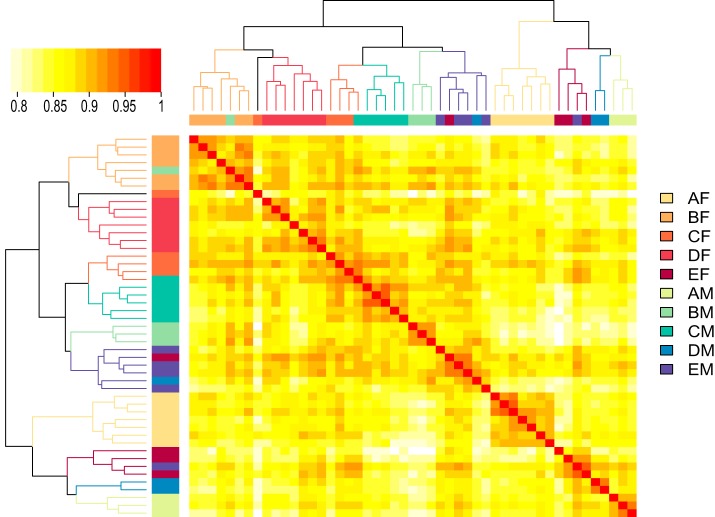
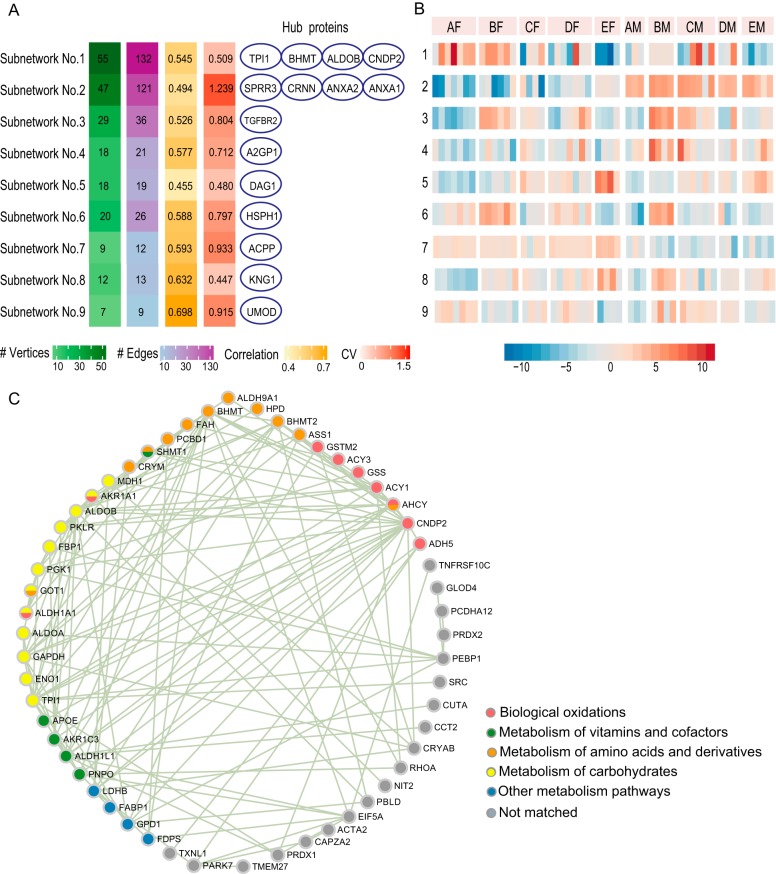
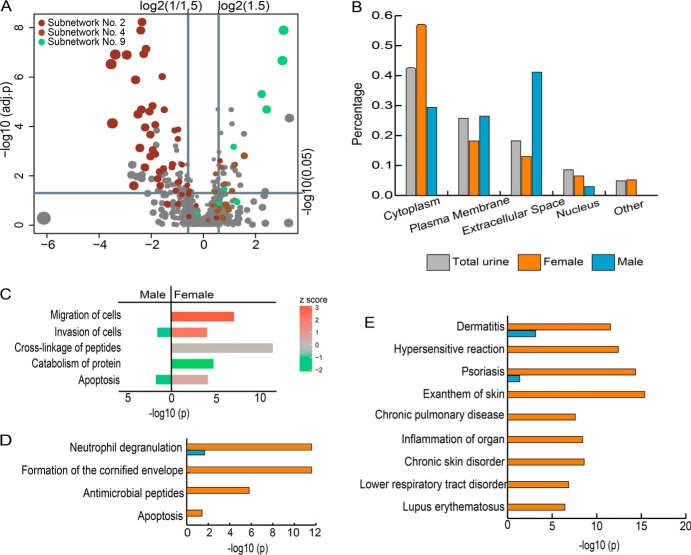
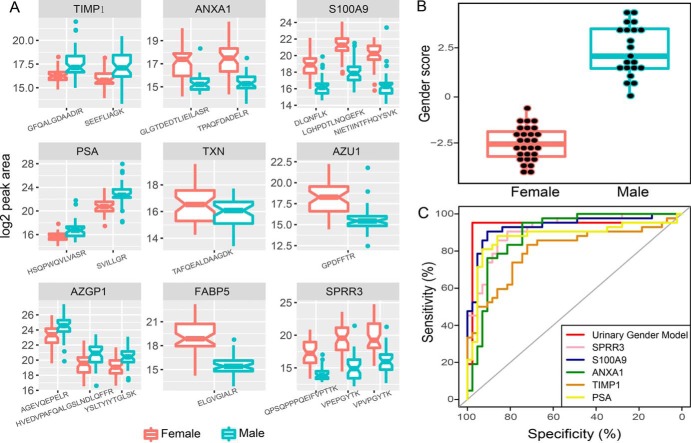
Disease biomarkers are the measurable changes associated with a pathophysiological process. Without homeostatic control, urine accumulates systematic changes in the body. Thus, urine is an attractive biological material for the discovery of disease biomarkers. One of the major bottlenecks in urinary biomarker discovery is that the concentration and composition of urinary proteins are influenced by many physiological factors. To elucidate the individual variation and related factors influencing the urinary proteome, we comprehensively analyzed the urine samples from healthy adult donors (aged 20-69 years). Co-expression network analysis revealed protein clusters representing the metabolic status, gender-related differences and age-related differences in urinary proteins. In particular, we demonstrated that gender is a crucial factor contributing to individual variation. Proteins that were increased in the male urine samples include prostate-secreted proteins and TIMP1, a protein whose abundance alters under various cancers and renal diseases; however, the proteins that were increased in the female urine samples have known functions in the immune system. Nine gender-related proteins were validated on 85 independent samples by multiple reaction monitoring. Five of these proteins were further used to build a model that could accurately distinguish male and female urine samples with an area under curve value of 0.94. Based on the above results, we strongly suggest that future biomarker investigations should consider gender as a crucial factor in experimental design and data analysis. Finally, reference intervals of each urinary protein were estimated, providing a baseline for the discovery of abnormalities.
Keywords: Biofluids*; Label-free quantification; Mass Spectrometry; Protein Identification*; Urine analysis.
© 2019 Shao et al.
Conflict of interest statement
The authors declare that they have no competing interests
Figures
Similar articles
-
A Proteomic Analysis of Individual and Gender Variations in Normal Human Urine and Cerebrospinal Fluid Using iTRAQ Quantification.PLoS One. 2015 Jul 29;10(7):e0133270. doi: 10.1371/journal.pone.0133270. eCollection 2015. PLoS One. 2015. PMID: 26222143 Free PMC article.
-
[Large-scale enrichment and identification of human urinary N-glycoproteins/N-glycopeptides].Se Pu. 2021 Jul 8;39(7):686-694. doi: 10.3724/SP.J.1123.2021.01039. Se Pu. 2021. PMID: 34227365 Free PMC article. Chinese.
-
Regional Differences of the Urinary Proteomes in Healthy Chinese Individuals.Chin Med Sci J. 2019 Sep 30;34(3):157-167. doi: 10.24920/003504. Chin Med Sci J. 2019. PMID: 31601298
-
Urinary proteomics and metabolomics in the diagnosis of pediatric disorders.Proteomics Clin Appl. 2015 Jun;9(5-6):482-9. doi: 10.1002/prca.201400093. Epub 2015 Mar 26. Proteomics Clin Appl. 2015. PMID: 25631340 Review.
-
Applications of urinary proteomics in biomarker discovery.Sci China Life Sci. 2011 May;54(5):409-17. doi: 10.1007/s11427-011-4162-1. Epub 2011 Mar 31. Sci China Life Sci. 2011. PMID: 21455690 Review.
Cited by
-
Proteomic analysis of urine reveals biomarkers for the diagnosis and phenotyping of abdominal-type Henoch-Schonlein purpura.Transl Pediatr. 2021 Mar;10(3):510-524. doi: 10.21037/tp-20-317. Transl Pediatr. 2021. PMID: 33850810 Free PMC article.
-
Endometriosis specific vaginal microbiota links to urine and serum N-glycome.Sci Rep. 2024 Oct 25;14(1):25372. doi: 10.1038/s41598-024-76125-2. Sci Rep. 2024. PMID: 39455640 Free PMC article.
-
Urinary proteome profiling for stratifying patients with familial Parkinson's disease.EMBO Mol Med. 2021 Mar 5;13(3):e13257. doi: 10.15252/emmm.202013257. Epub 2021 Jan 22. EMBO Mol Med. 2021. PMID: 33481347 Free PMC article.
-
Barriers in the Nervous System: Challenges and Opportunities for Novel Biomarkers in Amyotrophic Lateral Sclerosis.Cells. 2025 Jun 5;14(11):848. doi: 10.3390/cells14110848. Cells. 2025. PMID: 40498024 Free PMC article. Review.
-
A Pilot Urinary Proteome Study Reveals Widespread Influences of Circadian Rhythm Disruption by Sleep Deprivation.Appl Biochem Biotechnol. 2024 Apr;196(4):1992-2011. doi: 10.1007/s12010-023-04666-9. Epub 2023 Jul 17. Appl Biochem Biotechnol. 2024. PMID: 37458940
References
-
- Gao Y. (2013) Urine-an untapped goldmine for biomarker discovery? Sci. China Life Sci. 56, 1145–1146 - PubMed
-
- Gao Y. (2015) Urine is a better biomarker source than blood especially for kidney diseases. Adv. Exp. Med. Biol. 845, 3–12 - PubMed
-
- Decramer S., Gonzalez de Peredo A., Breuil B., Mischak H., Monsarrat B., Bascands J. L., and Schanstra J. P. (2008) Urine in clinical proteomics. Mol. Cell. Proteomics 7, 1850–1862 - PubMed
Publication types
MeSH terms
Substances
LinkOut - more resources
Full Text Sources
Research Materials
Miscellaneous
