. 2019 May 3;294(18):7403-7418.
doi: 10.1074/jbc.RA119.007847. Epub 2019 Mar 20.

Did evolution create a flexible ligand-binding cavity in the urokinase receptor through deletion of a plesiotypic disulfide bond?

Affiliations

Did evolution create a flexible ligand-binding cavity in the urokinase receptor through deletion of a plesiotypic disulfide bond?

Julie M Leth et al. J Biol Chem. .

Abstract

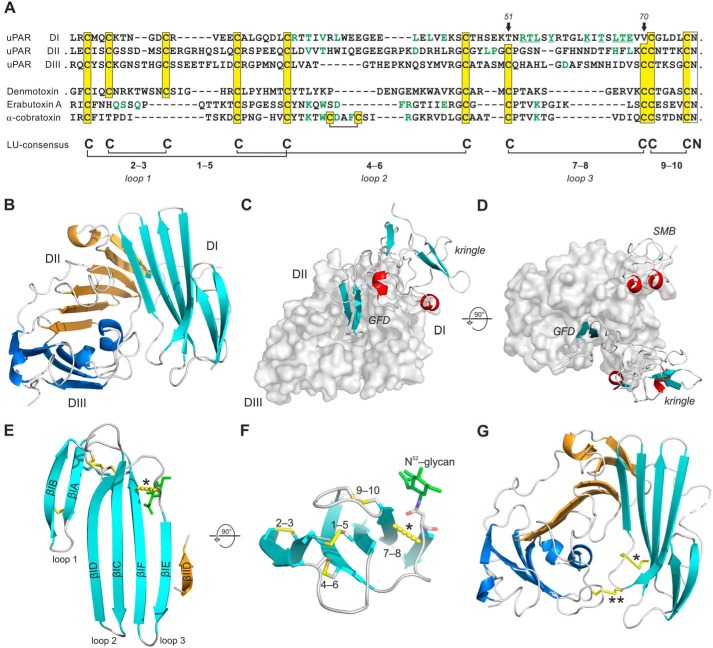
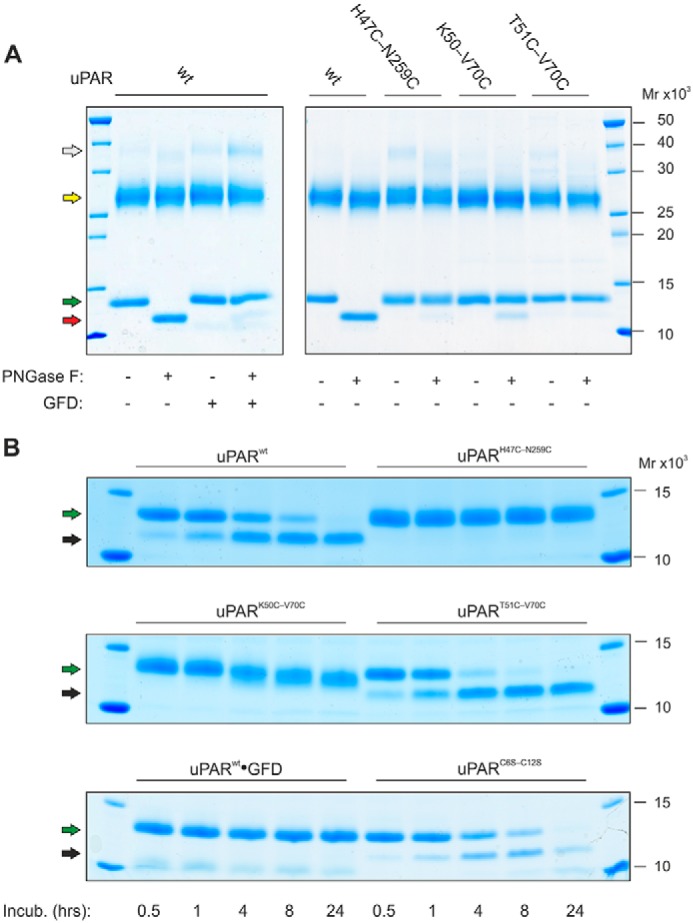
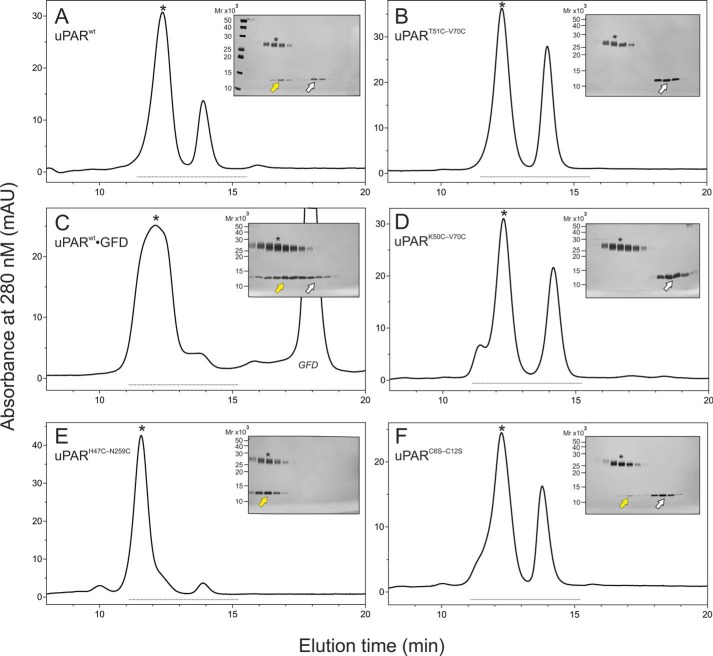
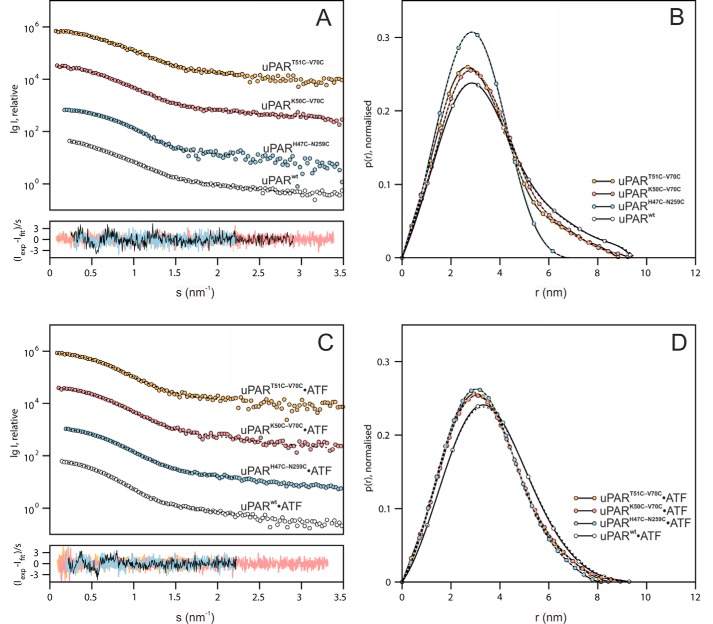
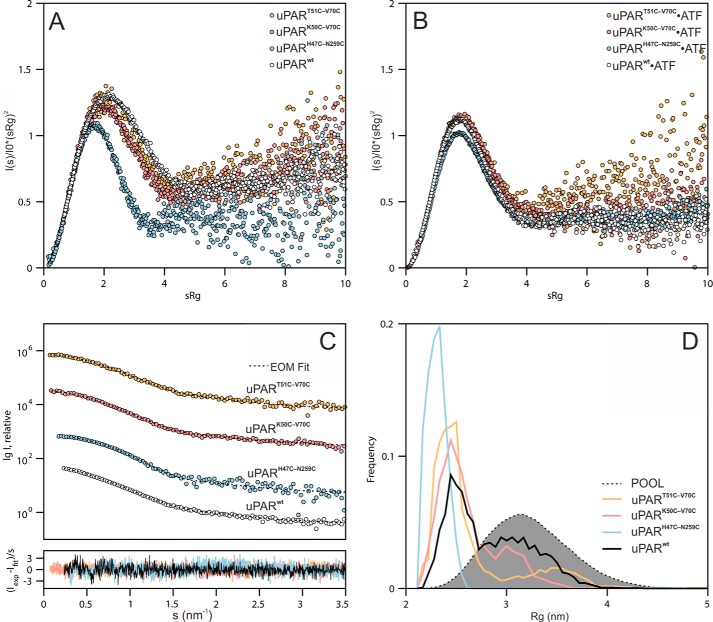
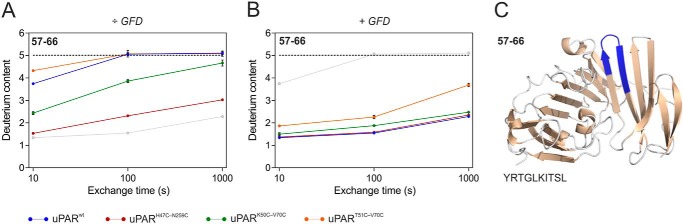
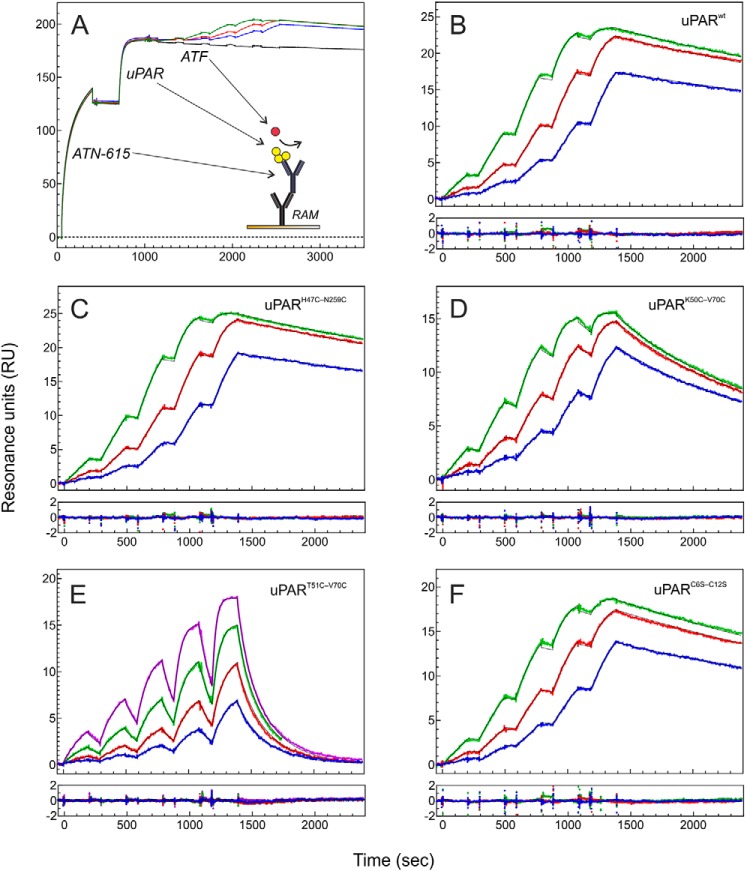
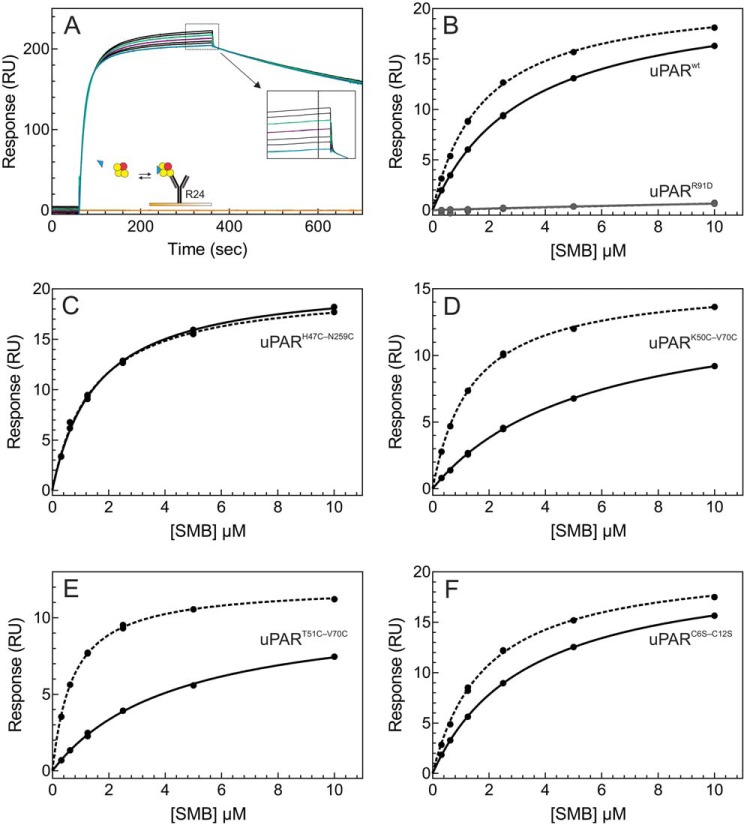
The urokinase receptor (uPAR) is a founding member of a small protein family with multiple Ly6/uPAR (LU) domains. The motif defining these LU domains contains five plesiotypic disulfide bonds stabilizing its prototypical three-fingered fold having three protruding loops. Notwithstanding the detailed knowledge on structure-function relationships in uPAR, one puzzling enigma remains unexplored. Why does the first LU domain in uPAR (DI) lack one of its consensus disulfide bonds, when the absence of this particular disulfide bond impairs the correct folding of other single LU domain-containing proteins? Here, using a variety of contemporary biophysical methods, we found that reintroducing the two missing half-cystines in uPAR DI caused the spontaneous formation of the corresponding consensus 7-8 LU domain disulfide bond. Importantly, constraints due to this cross-link impaired (i) the binding of uPAR to its primary ligand urokinase and (ii) the flexible interdomain assembly of the three LU domains in uPAR. We conclude that the evolutionary deletion of this particular disulfide bond in uPAR DI may have enabled the assembly of a high-affinity urokinase-binding cavity involving all three LU domains in uPAR. Of note, an analogous neofunctionalization occurred in snake venom α-neurotoxins upon loss of another pair of the plesiotypic LU domain half-cystines. In summary, elimination of the 7-8 consensus disulfide bond in the first LU domain of uPAR did have significant functional and structural consequences.

Keywords: LU domain; disulfide; fibrinolysis; hydrogen exchange mass spectrometry; plasminogen regulation; protein evolution; receptor structure-function; small-angle X-ray scattering (SAXS); surface plasmon resonance (SPR); urokinase receptor.


Conflict of interest statement

The authors declare that they have no conflicts of interest with the contents of this article.

Figures

Figure 1.
Figure 1.
Sequence alignment of LU domains in human uPAR and snake venom α-neurotoxins. A shows an alignment of primary sequences for the three LU domains in uPAR (Homo sapiens, Q03405) and the single LU domains in the snake venom toxins: demotoxin (Boiga dendrophilia, DQ366293), erabutoxin a (Laticuda semifasciata, P60775), and α-cobratoxin (Naja kauthia, P01391). Linker regions and extensions are omitted from the alignment (their presence are indicated by ·). Half-cystines are highlighted in yellow boxes along with their disulfide connectivity. Arrows indicate Thr51 and Val70 in uPAR DI. Residues located in the ligand-binding interface in crystal structures of ATF·uPAR (34) and α-cobratoxin·AChBP (71) complexes are highlighted in green, as are residues important for neurotoxicity of eraboutoxin a (72). The crystal structure of uPAR is shown in B as a cartoon representation (DI, cyan; DII, wheat; DIII, blue). C shows the ATF·uPAR complex with uPAR in a gray surface representation and ATF (containing GFD and a kringle domain) in cartoon representation. D shows the ATF·uPAR·SMB complex. E shows the LU domain in uPAR DI (residues 1–77) with β-strands in cyan and disulfide bonds as yellow sticks. A yellow hatched line between the Cα-atoms of Thr51 and Val70 illustrates one possible position of the lacking 7–8 disulfide bond. F shows the same structure tilted 90° to illustrate their structural constraint on the β-sheets and the proximity of the N-linked glycosylation site (Asn52) and the lacking 7–8 consensus disulfide bond. F shows the positons of the introduced disulfide bonds: Thr51–Val70 (*) and His47–Asn259 (**). Protein structures were created with PyMol (Schrödinger, LLC) using the PDB code 3BTI.
Figure 2.
Figure 2.
The presence of a 7–8 disulfide bond alters the sensitivity of uPAR to deglycosylation and limited proteolysis. A shows the enzymatic removal of the glycan tethered to Asn52 in intact uPAR under nondenaturing conditions by PNGase F. To illustrate the selective deglycosylation of DI, subsequent incubation with chymotrypsin liberated DI from DIIDIII before analysis by SDS-PAGE of the reduced and alkylated samples. Second to sixth lanes show that in uPARwt the glycan is readily removed, except when uPAR is bound to GFD. Seventh to 12th lanes show that the glycan in uPARH47C-N259C, uPARK50C-V70C, and uPART51-V70C is refractive to PNGase F. B shows the sensitivity of various uPAR variants to cleavage by chymotrypsin under nondenaturing conditions (E:S of 1:750 (w/w)). Colored arrows in A and B highlight the different uPAR fragments: white, intact uPAR; yellow, DIIDIII; green, DI residues 1–87; red, DI residues 1–87 without any glycan; black, DI residues 1–57. Noncropped SDS-PAGE gels are shown in Fig. S3.
Figure 3.
Figure 3.
Size exclusion chromatography reveals that DI remains partly attached to DIIDIII in chymotrypsin-cleaved uPARwt but not in the presence of the 7–8 disulfide bond. A–F show the elution profiles of various uPAR mutants subjected to limited chymotrypsin cleavage from a SuperdexTM 75 HR10/300 size exclusion chromatography (injected 50 μl of 1 mg of uPAR/ml). The insets show silver-stained SDS-polyacrylamide gels of the relevant fractions analyzed after reduction and alkylation (the light gray line at the bottom of the chromatograms identifies the analyzed fractions). Asterisks identify peak fractions and the yellow arrows show DI associated to DIIDIII; white arrows show detached DI. A, uPARwt (note, 20–30% of DI co-elutes with DIIDIII). B, uPART51C-V70C (no co-elution). C, uPARwt in the presence of a 4-fold molar excess of GFD (note, >90% of DI co-elutes with DIIDIII and the peak eluted earlier indicative of the formation of a trimolecular DI·GFD·DIIDIII complex). D, uPARK50C-V70C (no co-elution). E, uPARH47C-N259C (note, 100% DI co-elutes with DIIDIII due to the covalent tether between DI and DIII). F, uPARC6S-C12S (note, 5–10% of DI co-elutes with DIIDIII).
Figure 4.
Figure 4.
Comparison of molecular shape parameters of the uPAR disulfide variants by SAXS. A and B show the SAXS data and real-space distance-distribution functions of the uPAR disulfide variants. C and D show the SAXS data and real-space distribution functions of the uPAR variants in complex with ATF. Shown are experimental data (circles) along with fits of representative ab initio models, reconstructed using DAMMIF (dotted lines), the corresponding shape models are shown in Fig. S4. The lower panels in A and C show the error-weighted residual differences between the model fits and the experimental data.
Figure 5.
Figure 5.
Assessing the flexibility of the various uPAR disulfide conformers. Dimensionless Kratky plots of the normalized scattering data for unoccupied uPAR (A) and the corresponding complexes with ATF (B) reveal the relative flexibility of uPAR with different disulfide constraints. C and D show that ensemble representations provide a good description of the relative flexibility of the unoccupied uPAR variants. Fits of optimized ensembles (dotted lines) determined by EOM to the experimental data (circles) are shown (C). The size (Rg) distributions of optimized ensembles (solid lines) relative to a pool of random conformations (shaded area) highlight the decreased flexibility of uPARH47C-N259C (panel D). Increases in the populations of the more compact conformations and changes in the width of the size distributions, relative to that of uPARwt, are observed for each uPAR variant. The lower panel in C shows the error-weighted residual differences between the ensemble fits and the experimental data.
Figure 6.
Figure 6.
Domain flexibility of loop 3 in DI of the various uPAR disulfide variants tested by HDX-MS. A shows the deuterium uptake plots for the peptic peptide(57–66) from unoccupied uPAR at 25 °C and pH 7.4. Shown are data from uPARwt (blue), uPARH47C-N259C (red), uPARK50C-V70C (green), and uPART51C-V70C (orange). For comparison the data for uPARwt·GFD complexes are shown (light gray). This peptide display the larges differences observed between the different uPAR variants. B shows the corresponding deuterium uptake plots for the GFD-bound uPAR. In this graph, the uptake of unoccupied uPARwt is shown (light gray). The hatched black line represents the peptide derived from the fully deuterated protein. C highlights the position of the peptic peptide(57–66) in intact uPAR (blue) where it represents the β-hairpin formed by β-strands βIE and βIF (using PDB code 3BT1). Uptake values are shown with standard deviations. Deuterium uptake plots for other peptic peptides are shown in Fig. S5.
Figure 7.
Figure 7.
Kinetics of uPAR·ATF interactions as assessed by surface plasmon resonance. A shows the principle in our capture protocol for assessing the rate constants of an oriented uPAR·ATF interaction by three rounds of single cycle kinetics. Initially, amine-coupled rabbit anti-mouse IgG (RAM) captures the high-affinity anti-uPAR mAb ATN-615 (31), which subsequently captures 50 nm uPAR yielding a binding stoichiometry of approximately two uPAR molecules bound per ATN-615. Finally, injections of five serial 2-fold dilutions of ATF without intermitting regeneration yields the binding curves. The inset shows a cartoon representation of the experimental setup. The double blank referenced sensorgrams are shown for uPARwt (B), uPARH47C-N259C (C), uPARK50C-V70C (D), uPART51C-V70C (E), and uPARC6S-C12S (F). Different colors of the sensorgrams represents different ATF concentrations used for the single cycle setup: 0.03–0.5 nm (blue), 0.06–1.0 nm (red), 0.12–2.0 nm (green), and 0.25–4.0 nm (purple). The thin black line superimposed on each curve represents the experimental fit to a simple bimolecular interaction and the corresponding residuals are in the bottom of the panels.
Figure 8.
Figure 8.
Equilibrium binding of SMB to uPAR and uPAR·ATF complexes by surface plasmon resonance. A shows the principle in our capture protocol for assessing the equilibrium dissociation constant (KD) between uPAR or uPAR·ATF complexes and SMB in solution. In brief, the amine-coupled anti-uPAR mAb R24 captures 100 nm uPAR or 100 nm uPAR·ATF complexes in the presence of 2-fold serial dilutions of SMB (0.3–10 μm; replicates at 1.25 and 2.5 μm) in a multicycle setup. The inset shows the section of the sensorgrams where the dose-dependent binding of SMB is recorded. The SMB-binding isotherms for uPAR and uPAR·ATF complexes are shown for uPARwt and uPARR91D (B), uPARH47C-N259C (C), uPARK50C-V70C (D), uPART51C-V70C (E), and uPARC6S-C12S (F). Solid lines represent SMB-binding isotherms for uPAR and dotted lines those for the corresponding uPAR·ATF complexes.

Similar articles

Cited by

References

    1. Ploug M., Rønne E., Behrendt N., Jensen A. L., Blasi F., and Danø K. (1991) Cellular receptor for urokinase plasminogen activator: carboxyl-terminal processing and membrane anchoring by glycosylphosphatidylinositol. J. Biol. Chem. 266, 1926–1933 - PubMed
    1. Kjaergaard M., Hansen L. V., Jacobsen B., Gardsvoll H., and Ploug M. (2008) Structure and ligand interactions of the urokinase receptor (uPAR). Front. Biosci. 13, 5441–5461 - PubMed
    1. Connolly B. M., Choi E. Y., Gårdsvoll H., Bey A. L., Currie B. M., Chavakis T., Liu S., Molinolo A., Ploug M., Leppla S. H., and Bugge T. H. (2010) Selective abrogation of the uPA-uPAR interaction in vivo reveals a novel role in suppression of fibrin-associated inflammation. Blood 116, 1593–1603 10.1182/blood-2010-03-276642 - DOI - PMC - PubMed
    1. De Lorenzi V., Sarra Ferraris G. M., Madsen J. B., Lupia M., Andreasen P. A., and Sidenius N. (2016) Urokinase links plasminogen activation and cell adhesion by cleavage of the RGD motif in vitronectin. EMBO Rep. 17, 982–998 10.15252/embr.201541681 - DOI - PMC - PubMed
    1. Gårdsvoll H., Jacobsen B., Kriegbaum M. C., Behrendt N., Engelholm L., Østergaard S., and Ploug M. (2011) Conformational regulation of urokinase receptor function: impact of receptor occupancy and epitope-mapped monoclonal antibodies on lamellipodia induction. J. Biol. Chem. 286, 33544–33556 10.1074/jbc.M111.220087 - DOI - PMC - PubMed

LinkOut - more resources