. 2019 May 15;93(11):e00199-19.
doi: 10.1128/JVI.00199-19. Print 2019 Jun 1.

Cell Entry-Independent Role for the Reovirus μ1 Protein in Regulating Necroptosis and the Accumulation of Viral Gene Products

Affiliations

Cell Entry-Independent Role for the Reovirus μ1 Protein in Regulating Necroptosis and the Accumulation of Viral Gene Products

Katherine E Roebke et al. J Virol. .

Abstract

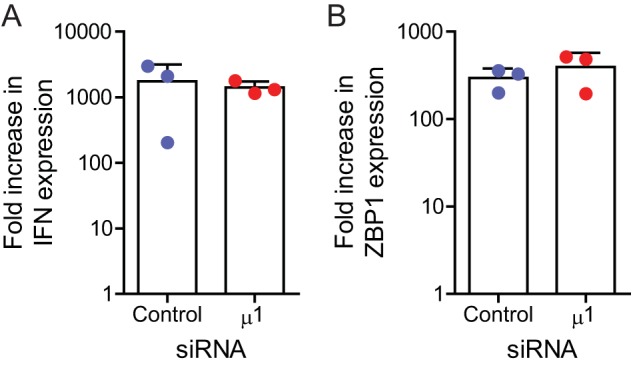
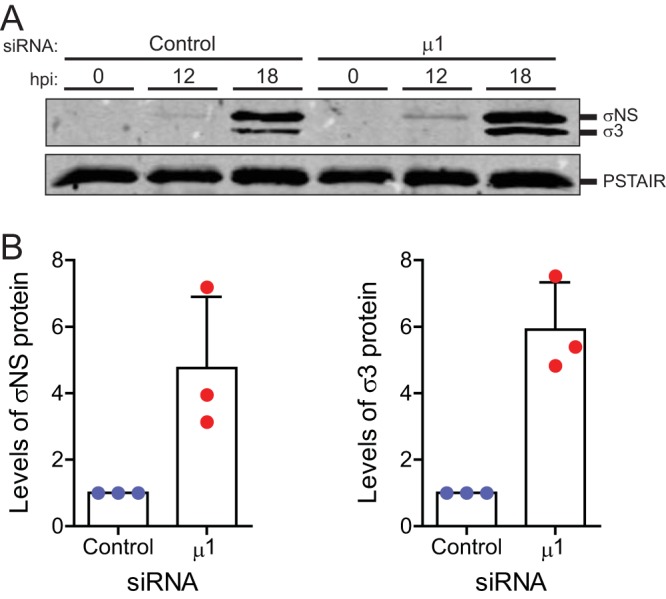
The reovirus outer capsid protein μ1 regulates cell death in infected cells. To distinguish between the roles of incoming, capsid-associated, and newly synthesized μ1, we used small interfering RNA (siRNA)-mediated knockdown. Loss of newly synthesized μ1 protein does not affect apoptotic cell death in HeLa cells but enhances necroptosis in L929 cells. Knockdown of μ1 also affects aspects of viral replication. We found that, while μ1 knockdown results in diminished release of infectious viral progeny from infected cells, viral minus-strand RNA, plus-strand RNA, and proteins that are not targeted by the μ1 siRNA accumulate to a greater extent than in control siRNA-treated cells. Furthermore, we observed a decrease in sensitivity of these viral products to inhibition by guanidine hydrochloride (GuHCl) (which targets minus-strand synthesis to produce double-stranded RNA) when μ1 is knocked down. Following μ1 knockdown, cell death is also less sensitive to treatment with GuHCl. Our studies suggest that the absence of μ1 allows enhanced transcriptional activity of newly synthesized cores and the consequent accumulation of viral gene products. We speculate that enhanced accumulation and detection of these gene products due to μ1 knockdown potentiates receptor-interacting protein 3 (RIP3)-dependent cell death.IMPORTANCE We used mammalian reovirus as a model to study how virus infections result in cell death. Here, we sought to determine how viral factors regulate cell death. Our work highlights a previously unknown role for the reovirus outer capsid protein μ1 in limiting the induction of a necrotic form of cell death called necroptosis. Induction of cell death by necroptosis requires the detection of viral gene products late in infection; μ1 limits cell death by this mechanism because it prevents excessive accumulation of viral gene products that trigger cell death.

Keywords: cell death; reovirus.


Figures

FIG 1
FIG 1
Newly synthesized μ1 does not affect apoptotic cell death. HeLa cells were transfected with either control or μ1 siRNA using INTERFERin. Twenty-four hours following transfection, the cells were infected and processed as described. (A) Cells were infected with T3D at a MOI of 100 PFU/cell. Cell lysates prepared 24 h following infection were immunoblotted for the μ1 protein using antireovirus antiserum and anti-PSTAIR mAb. Levels of μ1 and μ1C bands, relative to PSTAIR, are indicated. The level of μ1 and μ1C, relative to PSTAIR, in control siRNA-treated cells was considered 100%. (B) Cells were infected with T3D at a MOI of 100 PFU/cell. At 48 h postinfection, cell death was quantified by AOEB staining. (C) Cells were infected with T3D at a MOI of 100 PFU/cell and either were left untreated or were treated with 20 μM QVD when infection was initiated. At 48 h postinfection, cell death was quantified by AOEB staining. Cell death for each independent infection and mean are shown. Error bars indicate standard deviations (SDs). P values were determined by Student's t test. *, P < 0.05; **, P < 0.005.
FIG 2
FIG 2
Knockdown of newly synthesized μ1 increases cell death in L929 cells. L929 cells were transfected with either control or μ1 siRNA using Lipofectamine. Twenty-four hours following transfection, the cells were infected with T3D at a MOI of 10 PFU/cell and processed as described. (A) Cell lysates prepared 24 h following infection were immunoblotted for the μ1 protein using antireovirus antiserum and anti-PSTAIR mAb. The level of μ1 and μ1C, relative to PSTAIR, in control siRNA-treated cells was considered 100%. (B) Cell death was quantified 24 h following infection by AOEB staining. Cell death for each independent infection and means are shown. Error bars indicate SDs. P values were determined by Student's t test. *, P < 0.05; **, P < 0.005.
FIG 3
FIG 3
Effect of μ1 siRNA on cell death is sequence specific. (A) The μ1 siRNA sequence is aligned with the targeted (underlined) region of the M2 gene segment from T3D. The corresponding region from T1L M2, showing mismatches (shaded) within the siRNA target sequence, is also shown. M2 encodes μ1. (B) L929 cells were transfected with either control or μ1 siRNA using INTERFERin. Twenty-four hours following transfection, the cells were infected with either T1L or T1L/T3DM2 at a MOI of 10 PFU/cell. Cell lysates prepared 24 h following infection were immunoblotted for the μ1 protein using antireovirus antiserum and anti-PSTAIR mAb. The level of μ1 and μ1C, relative to PSTAIR, in control siRNA-treated cells was considered 100%. (C) L929 cells were transfected with either control or μ1 siRNA using Lipofectamine. Twenty-four hours following transfection, the cells were infected with either T1L or T1L/T3DM2, at a MOI of 10 PFU/cell, for 72 h or 24 h, respectively. Following infection, cell death was quantified by AOEB staining. Cell death for each independent infection and means are shown. Error bars indicate SDs. P values were determined by Student's t test. **, P < 0.005.
FIG 4
FIG 4
Knockdown of μ1 reduces viral yield and evokes cell death independently of σ3. (A) L929 cells were transfected with either control or μ1 siRNA using Lipofectamine. Twenty-four hours following transfection, the cells were infected with T3D at a MOI of 2 PFU/cell. Viral replication 24 h following infection was measured by plaque assay on L929 cells. Viral yield for each independent infection and means are shown. (B) L929 cells were transfected with either control or σ3 siRNA using Lipofectamine. Twenty-four hours following transfection, the cells were infected with T3D at a MOI of 10 PFU/cell. Cell lysates prepared 24 h following infection were immunoblotted for the σ3 protein using antireovirus antiserum and anti-PSTAIR mAb. The level of σ3, relative to PSTAIR, in control siRNA-treated cells was considered 100%. (C) L929 cells were transfected with either control, μ1, or both μ1 and σ3 siRNA using INTERFERin. Twenty-four hours following transfection, the cells were infected with T3D at a MOI of 10 PFU/cell for the indicated time. Following infection, cell death was quantified by AOEB staining. Mean values for three independent infections are shown. Error bars indicate SDs. P values were determined by Student's t test. **, P < 0.005; NS, not significant.
FIG 5
FIG 5
Knockdown of μ1 increases reovirus-induced necroptosis in L929 cells. (A and B) L929 cells were transfected with μ1 siRNA using Lipofectamine. Twenty-four hours following transfection, the cells were infected with T3D at a MOI of 10 PFU/cell and either were left untreated or were treated with 20 μM QVD when infection was initiated. At 30 h following infection, caspase-3/7 activity was determined by chemiluminescent assay (A) or cell death was quantified by AOEB staining (B). (C) L929 cells were transfected with control or RIP3 siRNA using INTERFERin. Cell lysates prepared 24 h following transfection were immunoblotted using anti-RIP3 and anti-PSTAIR antibodies. The level of RIP3, relative to PSTAIR, in control siRNA-treated cells was considered 100%. (D) L929 cells were cotransfected with siRNA specific to μ1 and β-galactosidase or μ1 and RIP3 using Lipofectamine. Thirty-six hours following transfection, cells were infected with T3D. At 30 h following infection, cell death was quantified by AOEB staining. Values for each independent infection and means are shown. Error bars indicate SDs. P values were determined by Student's t test. **, P < 0.005.
FIG 6
FIG 6
Reduction in μ1 levels does not affect IFN signaling following infection. L929 cells were transfected with β-galactosidase or μ1 siRNA using INTERFERin. Twenty-four hours following transfection, the cells were infected with T3D at a MOI of 10 PFU/cell. RNA extracted from infected cells, harvested 0 and 18 h postinfection, was reverse transcribed using random primers. Fold increases in levels of IFN-β (A) or ZBP1 mRNA (B), relative to GAPDH mRNA, over 18 h of infection were quantified by qPCR and comparative CT analyses. Values for each independent infection and means are shown. Error bars indicate SDs.
FIG 7
FIG 7
Knockdown of μ1 results in increased accumulation of viral RNAs following infection. L929 cells were transfected with control or μ1 siRNA using INTERFERin. Twenty-four hours following transfection, cells were infected with T3D at a MOI of 10 PFU/cell. RNA extracted from untreated infected cells, harvested 21 h postinfection (A, B, and C), or cells treated with 30 mM GuHCl at the time of infection, harvested 8 h postinfection (D), was reverse transcribed using primers specific for the minus strand or plus strand of the T3D S1 gene or GAPDH mRNA. (A, B, and D) Levels of accumulated T3D S1 minus-strand (A) or plus-strand (B and D) RNA, relative to GAPDH mRNA, were quantified by qPCR and comparative CT analysis. The ratio of T3D S1 RNA to GAPDH mRNA in control siRNA-treated cells was set to 1. (C) The level of the plus strand, relative to the minus strand, was quantified by qPCR and comparative CT analysis. Values for each independent infection and means are shown. Error bars indicate SDs. P values were determined by Student's t test. **, P < 0.005.
FIG 8
FIG 8
Knockdown of μ1 increases accumulation of other viral proteins following infection. L929 cells were transfected with control or μ1 siRNA using Lipofectamine. Twenty-four hours following transfection, cells were infected with T3D at a MOI of 10 PFU/cell. (A) Cell lysates prepared 0, 12, or 18 h postinfection (hpi) were immunoblotted for σNS protein with anti-σNS antiserum, for σ3 protein with antireovirus antiserum, and with anti-PSTAIR mAb. (B) Accumulated levels of σNS (left) and σ3 (right), relative to PSTAIR, at 18 h postinfection for each independent infection and means are shown. The ratio of viral protein to GAPDH for control siRNA-treated cells was set to 1. Error bars indicate SDs. P values were determined by Student's t test. *, P < 0.05; **, P < 0.005.
FIG 9
FIG 9
Intracellular μ1 levels affect the sensitivity of viral RNA synthesis and cell death to GuHCl. L929 cells were transfected with control or μ1 siRNA using INTERFERin. Twenty-four hours following transfection, cells were infected with T3D at a MOI of 10 PFU/cell and processed using the conditions described. Cells were left untreated or 200 μM ribavirin or GuHCl at the indicated concentrations was added when infection was initiated. (A to C) RNA extracted from cells harvested 21 h (A and B) or 6 h (C) following infection was reverse transcribed using primers specific for the minus strand or plus strand of the T3D S1 gene or GAPDH mRNA. Fractions of accumulated T3D S1 minus-strand (A) or plus-strand (B and C) RNA, relative to GAPDH mRNA, in the presence of GuHCl or ribavirin was quantified by qPCR and comparative CT analysis for three independent infections. T3D S1 accumulation in the absence of treatment was set to 1 for each siRNA-treated sample. (D) At 30 h postinfection, cell death was quantified by AOEB staining. The fraction of cell death in the presence of GuHCl was quantified for three independent infections. Cell death in the absence of GuHCl was set to 1 for each siRNA-treated sample. Error bars indicated SDs. P values were determined by Student's t test. *, P < 0.05; **, P < 0.005.
FIG 10
FIG 10
Model depicts late stages of reovirus replication following knockdown of μ1. Stages of reovirus replication proposed to be enhanced following knockdown of μ1 are indicated by double arrows.

Similar articles

Cited by

References

    1. Danthi P. 2016. Viruses and the diversity of cell death. Annu Rev Virol 3:533–553. doi:10.1146/annurev-virology-110615-042435. - DOI - PubMed
    1. Upton JW, Chan FK. 2014. Staying alive: cell death in antiviral immunity. Mol Cell 54:273–280. doi:10.1016/j.molcel.2014.01.027. - DOI - PMC - PubMed
    1. DeBiasi RL, Robinson BA, Sherry B, Bouchard R, Brown RD, Rizeq M, Long C, Tyler KL. 2004. Caspase inhibition protects against reovirus-induced myocardial injury in vitro and in vivo. J Virol 78:11040–11050. doi:10.1128/JVI.78.20.11040-11050.2004. - DOI - PMC - PubMed
    1. Oberhaus SM, Smith RL, Clayton GH, Dermody TS, Tyler KL. 1997. Reovirus infection and tissue injury in the mouse central nervous system are associated with apoptosis. J Virol 71:2100–2106. - PMC - PubMed
    1. Danthi P, Pruijssers AJ, Berger AK, Holm GH, Zinkel SS, Dermody TS. 2010. Bid regulates the pathogenesis of neurotropic reovirus. PLoS Pathog 6:e1000980. doi:10.1371/journal.ppat.1000980. - DOI - PMC - PubMed

Publication types

LinkOut - more resources