. 2019 Apr 2;116(14):6924-6931.
doi: 10.1073/pnas.1818486116. Epub 2019 Mar 20.

Exaggerated heterochiasmy in a fish with sex-linked male coloration polymorphisms

Affiliations

Exaggerated heterochiasmy in a fish with sex-linked male coloration polymorphisms

Roberta Bergero et al. Proc Natl Acad Sci U S A. .

Abstract

It is often stated that polymorphisms for mutations affecting fitness of males and females in opposite directions [sexually antagonistic (SA) polymorphisms] are the main selective force for the evolution of recombination suppression between sex chromosomes. However, empirical evidence to discriminate between different hypotheses is difficult to obtain. We report genetic mapping results in laboratory-raised families of the guppy (Poecilia reticulata), a sexually dimorphic fish with SA polymorphisms for male coloration genes, mostly on the sex chromosomes. Comparison of the genetic and physical maps shows that crossovers are distributed very differently in the two sexes (heterochiasmy); in male meiosis, they are restricted to the termini of all four chromosomes studied, including chromosome 12, which carries the sex-determining locus. Genome resequencing of male and female guppies from a population also indicates sex linkage of variants across almost the entire chromosome 12. More than 90% of the chromosome carrying the male-determining locus is therefore transmitted largely through the male lineage. A lack of heterochiasmy in a related fish species suggests that it originated recently in the lineage leading to the guppy. Our findings do not support the hypothesis that suppressed recombination evolved in response to the presence of SA polymorphisms. Instead, a low frequency of recombination on a chromosome that carries a male-determining locus and has not undergone genetic degeneration has probably facilitated the establishment of male-beneficial coloration polymorphisms.

Keywords: crossing over; genetic maps; guppies; sex chromosomes; sexual antagonism.


Conflict of interest statement

The authors declare no conflict of interest.

Figures

Fig. 1.
Fig. 1.
Genetic map distances for markers on chromosome 12 plotted against their genomic positions in the chromosome 12 female assembly available in GenBank. (A) Results from a full-sibling family from the Aripo captive population. Genetic mapping was also carried out for families from fish sampled directly from natural high-predation (B) and low-predation (C) populations from the Aripo, Guanapo, and Quare rivers (Methods and Table 1). In all families, the genetic map locations estimated in female meiosis increase almost linearly with the physical genomic positions, with R2 values for the linear regressions close to a value of 1 for all families (SI Appendix, Table S1). In male meiosis, the terminal region distant from the centromere forms a PAR with a very high recombination rate.
Fig. 2.
Fig. 2.
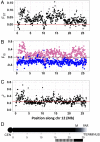
Evidence for associations between SNPs on chromosome 12 and the sex-determining region, based on population genetics analyses (FST, FIS, and LD). A total of 469,515 biallelic SNPs with genotypes for all individuals were analyzed. The positions are based on the female genome assembly. (A) FST values for males and females. The values plotted are mean values in 50-kb windows, and the horizontal line shows the genome-wide mean FST. (B) FIS values for SNPs in males (blue) and females (red) separately, showing the more negative values in males in almost all 50-kb windows across LG12, except in the PAR near 26 Mb. The line indicates a value of zero, the value expected under Hardy–Weinberg equilibrium. (C) Mean LD between SNPs in the same windows, estimated from diploid genotypes of both sexes using r2 values. The horizontal line shows the chromosomal mean r2 value. Away from the centromere end, r2 decays to a value close to 0.2. As the population studied has a history of a small size at its founding (Methods) and our sample size is small, LD is not expected to decay to very low values, even for independently segregating SNPs (76). chr, chromosome. (D) Schematic diagram of the chromosome, showing the centromere (CEN) at the left, corresponding to the region of high LD. The gray gradient of the chromosome bar indicates the very high crossover rate at male meiosis at the tip opposite the CEN (the terminus), quickly decreasing to a very low rate across the large CEN-proximal region. The presumed location of the male-determining region, based on our genotyping of one male recombinant, is indicated (M). The positions of the old and young evolutionary strata inferred by the study of Wright et al. (28) are indicated by a solid black bar and a striped black bar, respectively.
Fig. 3.
Fig. 3.
Evidence for restricted recombination on chromosome 12, based on sites with genotype patterns expected under sex linkage. A total of 344,848 nonsingleton SNPs from chromosome 12 were analyzed in windows of 1 Mb, plus SNPs from 492 unplaced scaffolds (U) with at least 100 variable sites. (A) Numbers of informative sites with genotypes consistent with sex linkage. Such sites were found across most of chromosome 12. Few sites had genotype configurations compatible with full sex-linkage (all females were homozygous, and all males were heterozygous). Most informative sites had genotypes deviating from complete sex linkage as follows: 1M, a single homozygous male; 2M, two homozygous males; 1F, one female heterozygote; and 1M, 1F, one male homozygote and one female heterozygote. (B) Percentage of sites in 10-kb windows with genotype configurations that fall into any of the five categories specified above. The pink line separates the number of windows containing more than 15% (pink dots) or less than 15% (gray dots) of sites informative for sex linkage. The blue bar under the X axis indicates the region previously suggested to be an old evolutionary stratum (28).

Comment in

References

    1. Muller HJ. Some genetic aspects of sex. Am Nat. 1932;66:118–138.
    1. Muller HJ. Genetic variability, twin hybrids and constant hybrids, in a case of balanced lethal factors. Genetics. 1918;3:422–499. - PMC - PubMed
    1. Bull JJ. Evolution of Sex Determining Mechanisms. Benjamin/Cummings; Menlo Park, CA: 1983.
    1. Blackmon H, Brandvain Y. Long-term fragility of Y chromosomes is dominated by short-term resolution of sexual antagonism. Genetics. 2017;207:1621–1629. - PMC - PubMed
    1. Scott MF, Otto SP. Haploid selection favors suppressed recombination between sex chromosomes despite causing biased sex ratios. Genetics. 2017;207:1631–1649. - PMC - PubMed

Publication types

LinkOut - more resources