. 2019 Mar 20;10(1):1264.
doi: 10.1038/s41467-019-09238-2.

A global analysis of coral bleaching over the past two decades

Affiliations

A global analysis of coral bleaching over the past two decades

S Sully et al. Nat Commun. .

Abstract

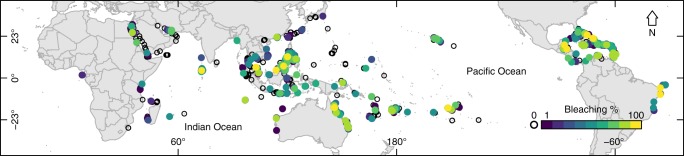
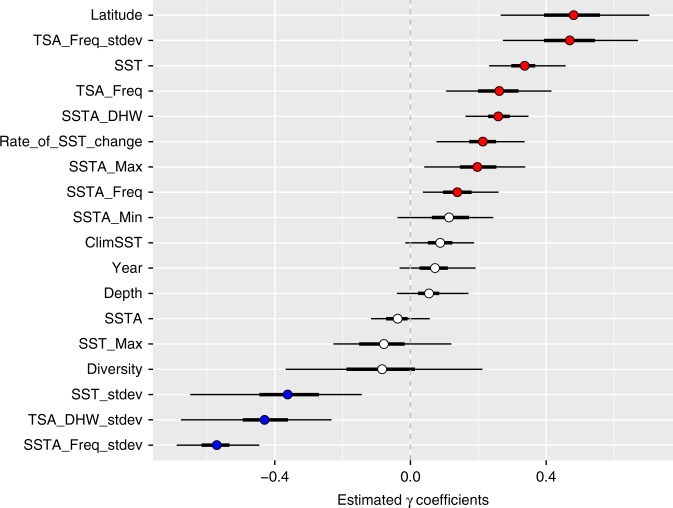
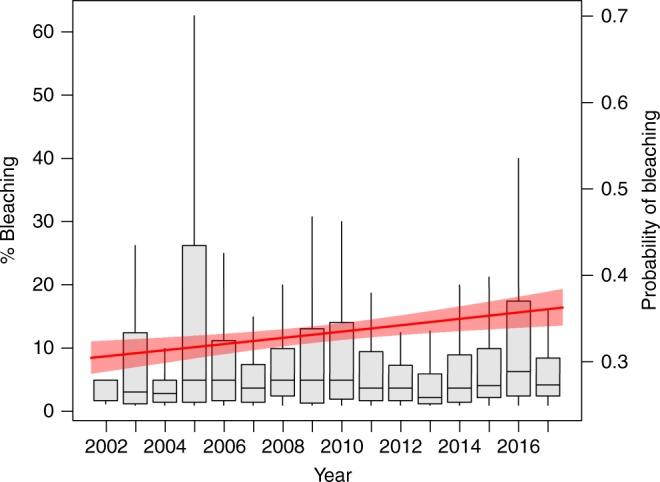
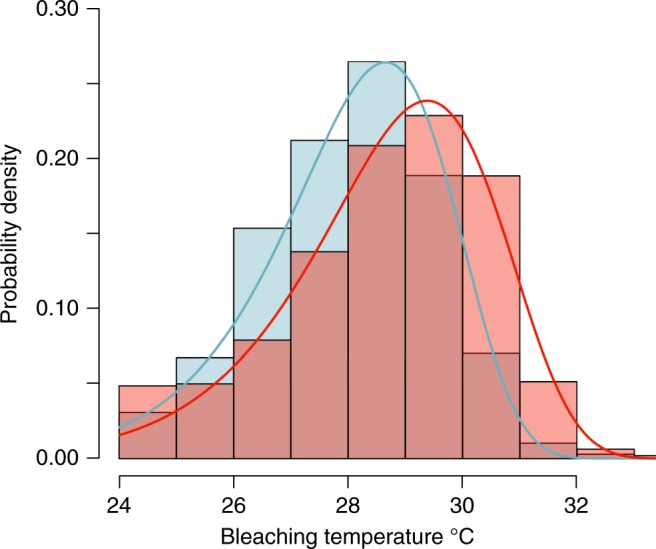
Thermal-stress events associated with climate change cause coral bleaching and mortality that threatens coral reefs globally. Yet coral bleaching patterns vary spatially and temporally. Here we synthesize field observations of coral bleaching at 3351 sites in 81 countries from 1998 to 2017 and use a suite of environmental covariates and temperature metrics to analyze bleaching patterns. Coral bleaching was most common in localities experiencing high intensity and high frequency thermal-stress anomalies. However, coral bleaching was significantly less common in localities with a high variance in sea-surface temperature (SST) anomalies. Geographically, the highest probability of coral bleaching occurred at tropical mid-latitude sites (15-20 degrees north and south of the Equator), despite similar thermal stress levels at equatorial sites. In the last decade, the onset of coral bleaching has occurred at significantly higher SSTs (∼0.5 °C) than in the previous decade, suggesting that thermally susceptible genotypes may have declined and/or adapted such that the remaining coral populations now have a higher thermal threshold for bleaching.


Conflict of interest statement

The authors declare no competing interests.

Figures

Fig. 1
Fig. 1
Coral bleaching distribution. Prevalence of coral bleaching presented as a percentage of the coral assemblage that bleached at survey, measured at 3351 sites in 81 countries, from 1998 to 2017. White circles indicate no bleaching. Colored circles indicate 1% bleaching (blue) through 100% bleaching (yellow)
Fig. 2
Fig. 2
Model parameter coefficients. Relationship between the percentage of coral colonies bleached and environmental variables across all depths within a Bayesian framework with mean values (circles) and 95% credible intervals (the thin black horizontal lines) as well as 50% credible intervals (the thick black horizontal lines) at 3351 sites in 81 countries, from 1998–2017 (all definitions are outlined in detail in Supplementary Table 1). Latitude is the number of degrees north or south of the equator at which the survey occurred. SST is the sea surface temperature during the field survey period. Freq is frequency. Min is minimum. Max is maximum. Stdev is standard deviation. DHW is degree heating weeks. A is anomaly. TS is thermal stress. Diversity is the number of species confirmed present in the ecoregion in which each survey was conducted. Rate_of_SST_change is the annual rate of SST change from 1984 to 2017 at a 1 km resolution. Year is the years of survey. Clim is climatological. Depth is the depth in meters. Red dots show a positive contribution to bleaching likelihood, blue dots show a negative contribution to the likelihood of coral bleaching, and white dots show no significant contribution to bleaching likelihood (95% credible interval crosses 0)
Fig. 3
Fig. 3
Percent and probability of coral bleaching over time. Percent of coral bleaching and probability of coral bleaching measured at 3351 sites in 81 countries, from 2002 to 2017. The boxplots are of the percent coral bleaching, which is measured on the left y axis. The center line is the mean percent bleaching, the bounds of the boxes are the interquartile range (25 and 75%), and the whiskers are the 95% range. The red line is the probability of coral bleaching over time, measured on the right y axis, and the shaded red region is the 95% confidence interval
Fig. 4
Fig. 4
Probability density distributions of coral bleaching. Probability density distributions of coral bleaching from 1998 to 2006 (blue shade) and from 2007 to 2017 (peach shade), the mauve shade is where the distributions overlap; the blue and red lines show the best-fit Weibull probability density distributions (for the 1998 to 2006 data, the Weibull shape is 18.895 and the scale is 28.622, whereas for the 2007 to 2017 data the Weibull shape is 19.346, and the shape is 29.413). The change in coral-bleaching-sea-surface temperature is significantly different (Likelihood ratio test, Pr(>χ2) = 0.001) between decades

References

    1. Costanza R, et al. Changes in the global value of ecosystem services. Glob. Environ. Change. 2014;26:152–158. doi: 10.1016/j.gloenvcha.2014.04.002. - DOI
    1. Hoegh-Guldberg O, et al. Coral reefs under rapid climate change and ocean acidification. Science. 2007;318:1737–1742. doi: 10.1126/science.1152509. - DOI - PubMed
    1. Hughes TP, et al. Spatial and temporal patterns of mass bleaching of corals in the Anthropocene. Science. 2018;359:80–83. doi: 10.1126/science.aan8048. - DOI - PubMed
    1. Thompson DM, van Woesik R. Corals escape bleaching in regions that recently and historically experienced frequent thermal stress. Proc. Biol. Sci. 2009;276:2893–2901. doi: 10.1098/rspb.2009.0591. - DOI - PMC - PubMed
    1. Pandolfi JM, Connolly SR, Marshall DJ, Cohen AL. Projecting coral reef futures under global warming and ocean acidification. Science. 2011;333:418–422. doi: 10.1126/science.1204794. - DOI - PubMed

Publication types