. 2019 Mar 20;10(1):1285.
doi: 10.1038/s41467-019-09337-0.

Computational geometry analysis of dendritic spines by structured illumination microscopy

Affiliations

Computational geometry analysis of dendritic spines by structured illumination microscopy

Yutaro Kashiwagi et al. Nat Commun. .

Abstract

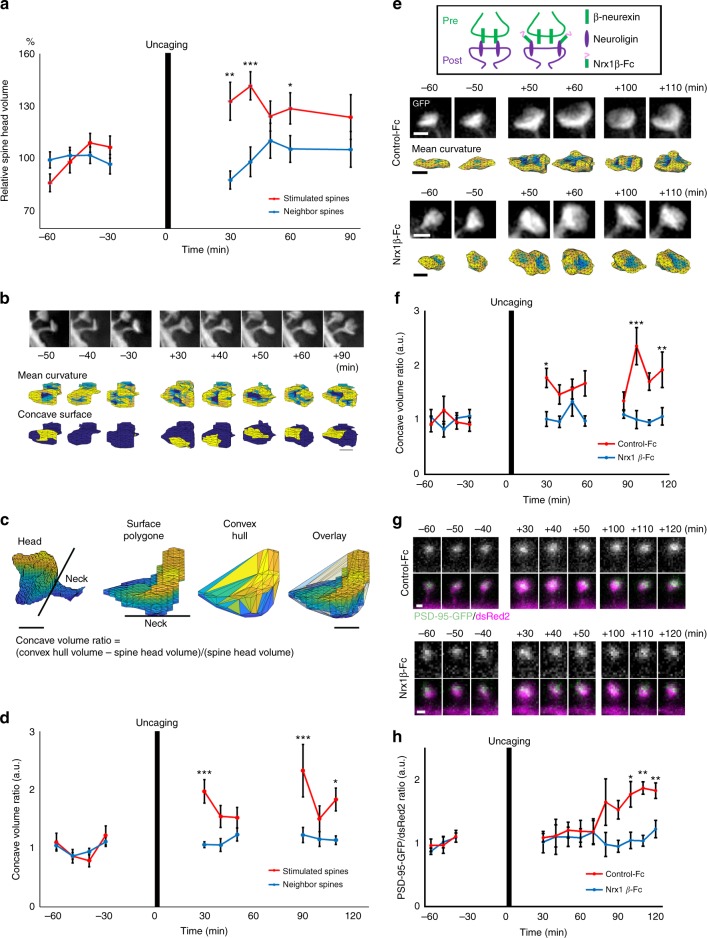
Dendritic spines are the postsynaptic sites that receive most of the excitatory synaptic inputs, and thus provide the structural basis for synaptic function. Here, we describe an accurate method for measurement and analysis of spine morphology based on structured illumination microscopy (SIM) and computational geometry in cultured neurons. Surface mesh data converted from SIM images were comparable to data reconstructed from electron microscopic images. Dimensional reduction and machine learning applied to large data sets enabled identification of spine phenotypes caused by genetic mutations in key signal transduction molecules. This method, combined with time-lapse live imaging and glutamate uncaging, could detect plasticity-related changes in spine head curvature. The results suggested that the concave surfaces of spines are important for the long-term structural stabilization of spines by synaptic adhesion molecules.


Conflict of interest statement

The authors declare no competing interests.

Figures

Fig. 1
Fig. 1
A method for measuring the surface geometry of dendritic spines. a Acquisition of 3D-SIM image of dendrites and automatic detection of dendritic spines. Arrows indicate the same dendritic spine shown in panel (b). Bar: 2 μm. b Process of spine geometry analysis. Individual spine mesh objects can be visualized as pseudocolor or shaded surface images (mesh feature extraction). Differential geometry can be calculated, and the parameters can be mapped onto the surface (differential-geometry operation). Bar: 500 nm. After calculation of multiple shape descriptors, the datasets are further analyzed by the techniques of dimensionality reduction and automatic classification using machine learning. c Comparison of 3D-SIM images and reconstruction of EM images from the identical dendritic segment. Left side column shows a lower-magnification view of a dendritic segment in a SIM projection image [SIM (proj)], a reconstructed surface view of SIM and EM data [SIM (mesh) and EM], and a reconstructed view of the dendrite with presynaptic components [EM (with axon)]. Numbers (1–20) indicate the corresponding spines. Right column shows a higher-magnification view of spine 13, with raw single plane EM (upper), reconstructed EM data with axon (middle), and reconstructed EM data with PSD (lower). Bars: 5 μm for left column, 500 nm for right column. d Comparison of spine no. 13 in panel (c), reconstructed from EM and SIM data. Surface mean curvature is shown by pseudocolor mapping. The lower image pair shows the areas with the smallest negative value of mean curvature in yellow. Bar: 500 nm. e Relationship of basic shape parameters (length, surface area, and volume) calculated from EM and SIM data. High values of coefficient of determination indicate the possibility of estimating the absolute shape parameters from SIM images after appropriate conversion (n = 20 spines in a single reconstructed volume)
Fig. 2
Fig. 2
Spine shape analysis based on dimensionality reduction and SVM-based labeling of large spine datasets. a Distribution of spines in the feature space with axes corresponding to PC1, PC2, and PC3. The right two graphs show the positions of spine examples in panel (b) (n = 1335 spines from 86 cells in four independent culture preparations). b Examples of spines in the feature space shown in panel (a). Bar: 500 nm. c Hyperparameter tuning for the SVM classifier. Accuracy was highest (88.4%) with values of C = 1 and γ = 0.1. d SIM projection images of wild-type, synGAP+/−, and CaMKIIαK42R/K42R neurons. Bar: 2 μm. e Distribution of spines with different genotypes mapped into the feature space and classified as mushroom (magenta dots) or non-mushroom (green dots) spines by SVM (n = 1095 spines from 43 neurons in three independent culture preparations for the wild-type, 1015 spines from 44 neurons in three independent culture preparations for synGAP+/−, and 1392 spines from 48 neurons in three independent culture preparations for CaMKIIαK42R/K42R). f Cumulative distribution curves of spine volume and length with different genotypes after classification into mushroom and non-mushroom spines (Kolmogorov–Smirnov test; synGAP experiments: n = 487 for wild-type mushroom spines, n = 608 for wild-type non-mushroom spines, n = 466 for synGAP+/− mushroom spines, n = 549 for synGAP+/− non-mushroom spines; CaMKII experiments: n = 549 for wild-type mushroom spines, n = 698 for wild-type non-mushroom spines, n = 424 for CaMKIIαK42R/K42R mushroom spines, n = 968 for CaMKIIαK42R/K42R non-mushroom spines)
Fig. 3
Fig. 3
Spine shape transition studied by SIM-based geometrical analysis. a Trajectories of shape transition for three examples of spines mapped into the feature space. The right images of reconstructed spine shapes are from three spines at multiple time points (0–60 min). The values of mean curvatures are mapped onto the surface. Bar: 500 nm. b Projection and 3D maps of trajectories created from a population of spines (46 spines from eight neurons in five independent culture preparations). c The direction and length of trajectories in spine shape changes, mapped into the feature space. Total lengths of trajectories are shown as the radii of yellow circles, and trajectories projected onto four orthogonal directions are shown as black arrows. The PC1–2 plane is shown. The positions of spines at different time points were also mapped after SVM-based shape classification into mushroom and non-mushroom spines (magenta and green dots). d A scheme of three types of spine behavior in the feature space. Orange, magenta, and green dots indicate spines classified in groups 1, 2, and 3, respectively. e Mapping of the most concave surface on spine heads classified in groups 1, 2, and 3. Group 2 spines maintained the concave surface, whereas the concave surface was less stable in group 1, and did not exist in group 3. f The fraction of time points when the concave surfaces can be mapped to spine heads (concave surface ratio), and the fraction of time points when the concave surfaces located in the same direction within the spine heads (concave surface stability) were measured for three groups of spines [n = 16, 10, and 7 spines for groups 1, 2, and 3, respectively; one-way ANOVA followed by Tukey–Kramer procedures for multiple comparison tests; concave surface ratio: F(2,30) = 41.57, p = 2.25 × 10−9; concave surface stability: F(2,30) = 33.78, p = 2.08 × 10−8; *p < 0.05, ***p < 0.001. Data are presented as the mean ± SEM]
Fig. 4
Fig. 4
Plasticity-related changes in spine head geometry. a Time course of changes in spine head volume after glutamate uncaging [one-way ANOVA; stimulated: n = 14 spines; neighbor: n = 14 spines; *p < 0.05, **p < 0.01, ***p < 0.001]. b Structural changes in spine head before and after glutamate uncaging. SIM projection images of spines are shown in the upper row. Surface mapping of mean curvature and detected concave surfaces are shown in the middle and lower rows. Bar: 500 nm. c Images of reconstructed spine surface polygon with or without spine neck, convex hull mesh, and their overlay. Volume difference between the spine head and the convex hull was divided by the spine head volume, and this value is presented as the concave volume ratio for the graphs in panels (d) and (f). Bar: 500 nm. d Measurement of the volume difference between entire spine heads and the convex hull before and after glutamate uncaging. The graph shows the prolonged increase in this value after glutamate uncaging. [One-way ANOVA; stimulated: n = 6 spines; neighbor: n = 10 spines; *p < 0.05, ***p < 0.001]. e Inhibition of plasticity-associated changes in spine head geometry by neurexin 1β-Fc. SIM projection images of spines are shown in the upper row for both control-Fc and neurexin 1β-Fc conditions. The images in the lower rows show surface mapping of mean curvature. Bar: 500 nm. f Measurement of the volume difference between entire spine heads and the convex hull before and after glutamate uncaging in the presence of neurexin 1β-Fc. [One-way ANOVA; control-Fc: n = 6 spines; Nrx1β-Fc: n = 6 spines; *p < 0.05, **p < 0.01, ***p < 0.001]. g Inhibition of PSD-95 accumulation in the late phase of spine structural plasticity by neurexin 1β-Fc. Images of PSD-95-GFP are shown in the upper rows, and images of PSD-95-GFP merged with dsRed2 are shown in the lower rows. Bar: 500 nm. h Inhibition of PSD-95-GFP fluorescence increase after glutamate uncaging by neurexin 1β-Fc. [One-way ANOVA; control-Fc: n = 4 spines; Nrx1β-Fc: n = 5 spines; *p < 0.05, **p < 0.01]. Details of statistics in this figure is provided in Supplementary Table 2

References

    1. Holtmaat A, Svoboda K. Experience-dependent structural synaptic plasticity in the mammalian brain. Nat. Rev. Neurosci. 2009;10:647–658. doi: 10.1038/nrn2699. - DOI - PubMed
    1. Kasai H, Fukuda M, Watanabe S, Hayashi-Takagi A, Noguchi J. Structural dynamics of dendritic spines in memory and cognition. Trends Neurosci. 2010;33:121–129. doi: 10.1016/j.tins.2010.01.001. - DOI - PubMed
    1. Arellano JI, Benavides-Piccione R, DeFelipe J, Yuste R. Ultrastructure of dendritic spines: correlation between synaptic and spine morphologies. Front. Neurosci. 2007;1:131–143. doi: 10.3389/neuro.01.1.1.010.2007. - DOI - PMC - PubMed
    1. Loewenstein Y, Kuras A, Rumpel S. Multiplicative dynamics underlie the emergence of the log-normal distribution of spine sizes in the neocortex in vivo. J. Neurosci. 2011;31:9481–9488. doi: 10.1523/JNEUROSCI.6130-10.2011. - DOI - PMC - PubMed
    1. Yuste R, Bonhoeffer T. Genesis of dendritic spines: insights from ultrastructural and imaging studies. Nat. Rev. Neurosci. 2004;5:24–34. doi: 10.1038/nrn1300. - DOI - PubMed

Publication types

MeSH terms