. 2019 Mar 20;10(1):1270.
doi: 10.1038/s41467-019-09273-z.

Gfi1b regulates the level of Wnt/β-catenin signaling in hematopoietic stem cells and megakaryocytes

Affiliations

Gfi1b regulates the level of Wnt/β-catenin signaling in hematopoietic stem cells and megakaryocytes

Peiman Shooshtarizadeh et al. Nat Commun. .

Abstract

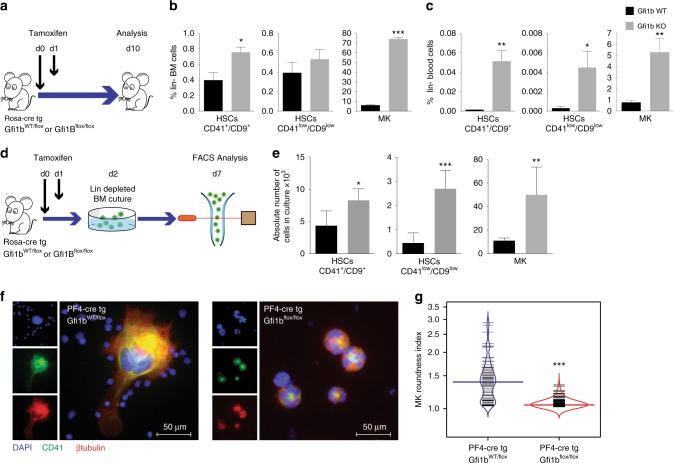
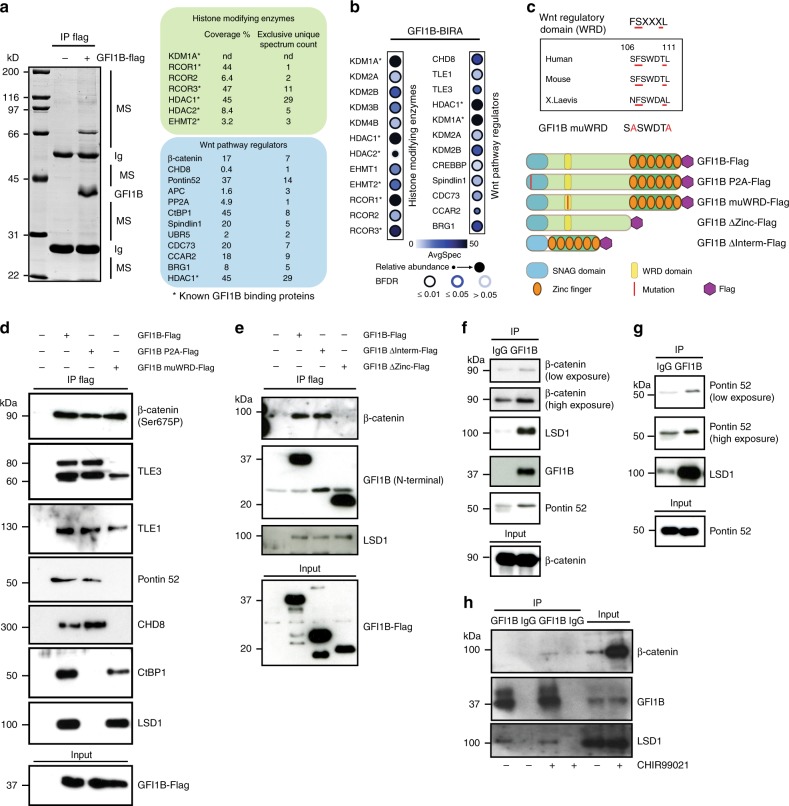
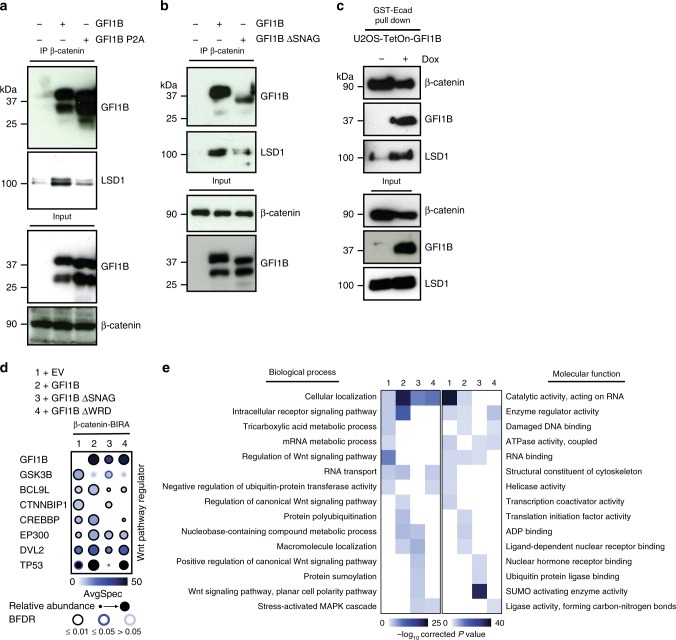
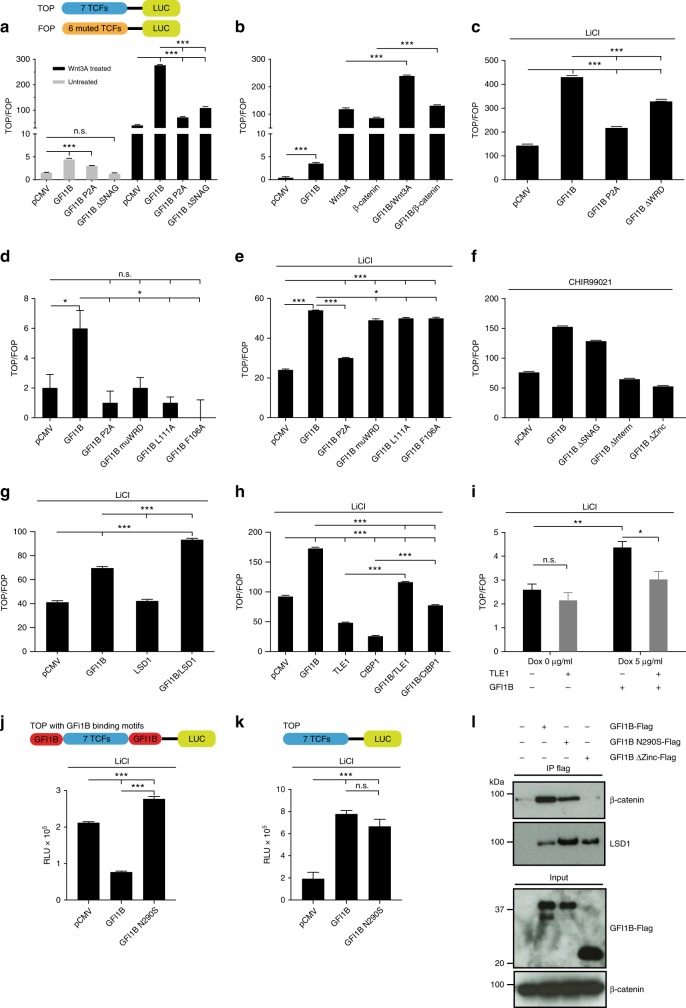
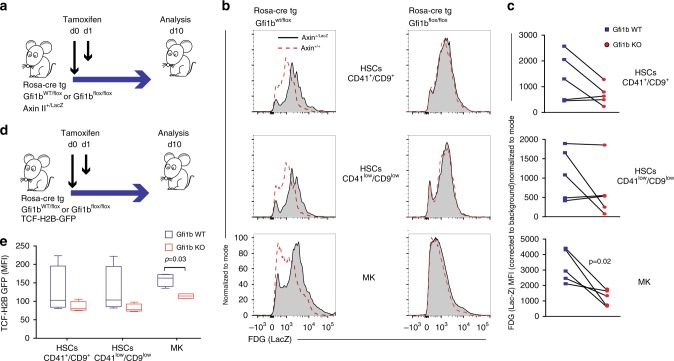
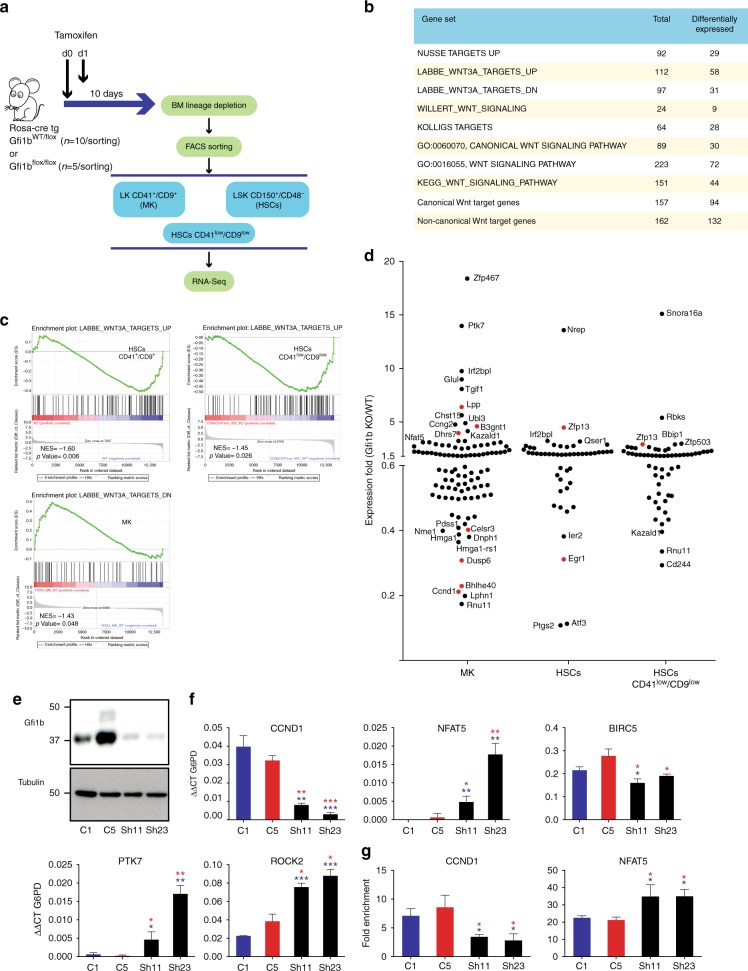
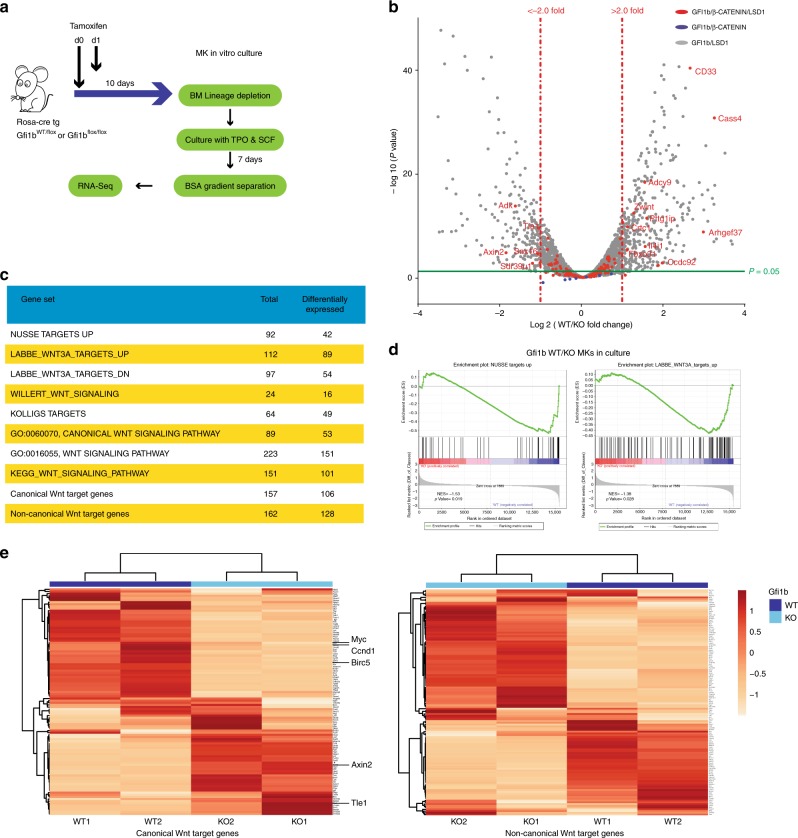
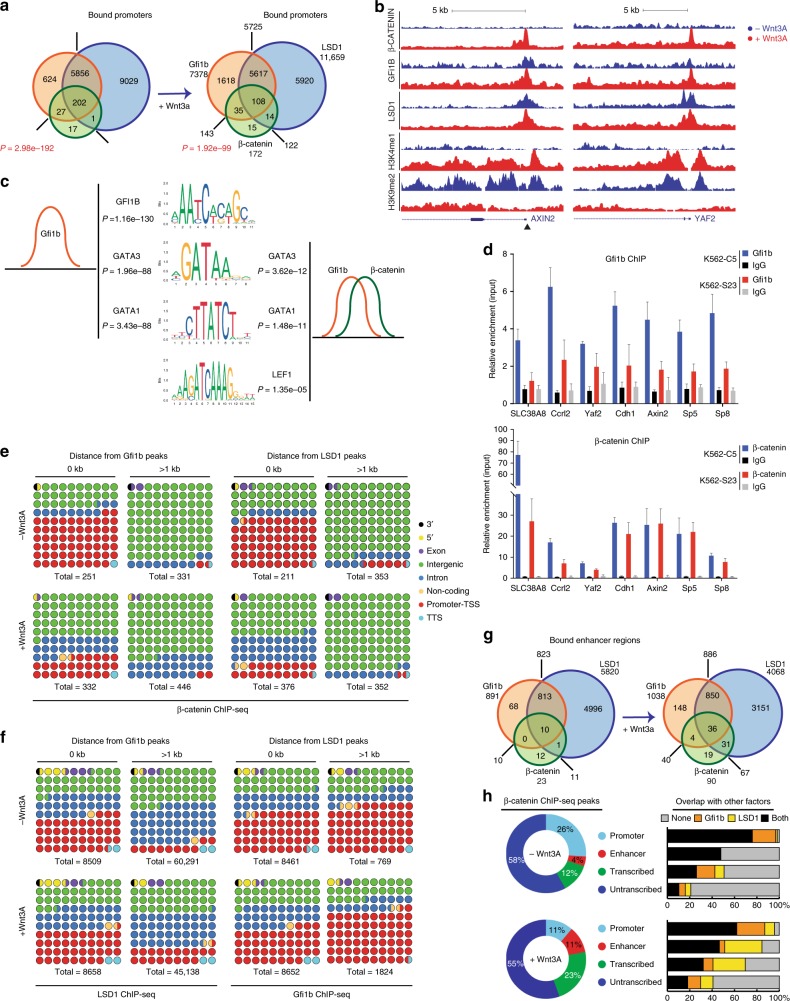
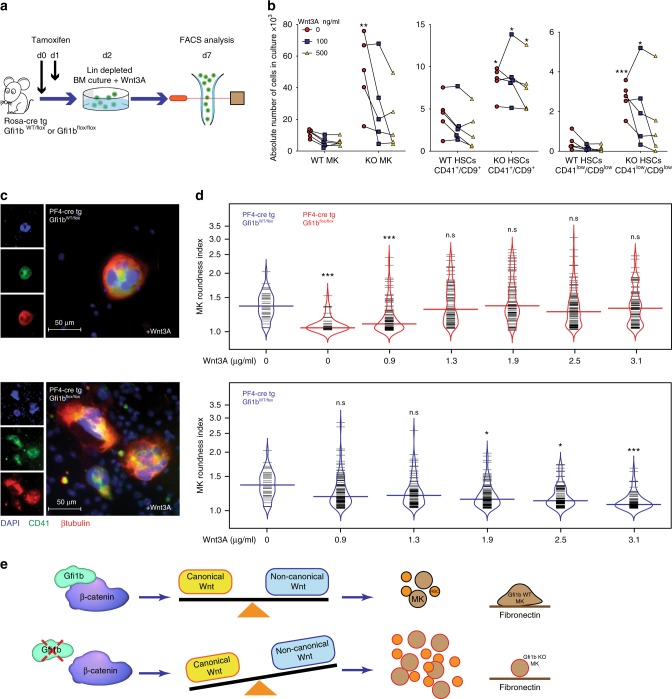
Gfi1b is a transcriptional repressor expressed in hematopoietic stem cells (HSCs) and megakaryocytes (MKs). Gfi1b deficiency leads to expansion of both cell types and abrogates the ability of MKs to respond to integrin. Here we show that Gfi1b forms complexes with β-catenin, its co-factors Pontin52, CHD8, TLE3 and CtBP1 and regulates Wnt/β-catenin-dependent gene expression. In reporter assays, Gfi1b can activate TCF-dependent transcription and Wnt3a treatment enhances this activation. This requires interaction between Gfi1b and LSD1 and suggests that a tripartite β-catenin/Gfi1b/LSD1 complex exists, which regulates Wnt/β-catenin target genes. Consistently, numerous canonical Wnt/β-catenin target genes, co-occupied by Gfi1b, β-catenin and LSD1, have their expression deregulated in Gfi1b-deficient cells. When Gfi1b-deficient cells are treated with Wnt3a, their normal cellularity is restored and Gfi1b-deficient MKs regained their ability to spread on integrin substrates. This indicates that Gfi1b controls both the cellularity and functional integrity of HSCs and MKs by regulating Wnt/β-catenin signaling pathway.


Conflict of interest statement

The authors declare no competing interests.

Figures

Fig. 1
Fig. 1
Loss of Gfi1b in MKs and HCSs causes their expansion and mobilization into the blood. a Schematic of Tamoxifen injections; mice were analyzed by FACS at day 10 following the first injection. b, c Quantification of Gfi1b WT/KO MKs and HSCs in lineage negative depleted BM and blood (n = 3 mice per group). d Schematic of in vitro analysis of Gfi1b WT/KO HSCs and MKs expansion. e MKs and HSCs (CD41low/CD9low) were taken into culture and were quantified by FACS at day six (day seven post Tamoxifen injection, n = 3 mice per group). f, g Loss of Gfi1b leads to impaired MKs spreading on Fibronectin coated matrix as quantified by calculating their roundness index (n = 70 Gfi1b wt/flox cells and 220 Gfi1b flox/flox cells). (*p < 0.05, **p < 0.001, ***p < 0.0001 on a Welch corrected t-test, error bars show s.d)
Fig. 2
Fig. 2
GFI1B interacts with β-catenin and several regulators of the Wnt/β-catenin signaling pathway. a Immune precipitation (IP) with anti Flag antibody from 293T cells overexpressing GFI1B-Flag followed by mass spectrometric analysis. b Dot Plot showing BioID interactions of GFI1B-BirA*-Flag with the indicated Histone modifying enzymes and Wnt pathway regulators in Flp-In T-REx HEK293 cells. Node color represents the average spectral counts. The edge color depicts the confidence score of the interaction (BFDR ≤ 1% as high confidence, 1% < BFDR ≤ 5% as medium confidence or 5% < BFDR as low confidence score). The relative abundance of prey across the bait is represented by the size of the circle. c A previously described Wnt regulatory domain (WRD) is present in GFI1B. The indicated Flag-tagged and mutated forms used for IP. d, e Immune precipitation with anti Flag antibodies from 293T cells overexpressing WT or the indicated mutated forms of GFI1B followed by western blot. fh Immune precipitation with an anti GFI1B antibody from K562 (f), HEL (g), and CHIR99021 treated K562 (h) cells
Fig. 3
Fig. 3
GFI1B recruits LSD1 to β-Catenin containing complexes. a, b Western blot analysis of indicated proteins after immune precipitation of endogenous β-catenin from 293T cells transfected with the indicated GFI1B constructs. c GST-E-Cadherin pull down of endogenous β-catenin in U2OS cells expressing inducible GFI1B (Tet-ON system) followed by Western blot analysis. d Dot Plot showing BioID interactions of β-catenin-BirA*-Flag coexpressing an Empty Vector (1), the wild-type form of GFI1B (2), GFI1B lacking the SNAG domain (3) or GFI1B lacking the WRD domain (4) with the indicated Wnt pathway regulators in Flp-In T-REx HEK293 cells. e Heat map illustrating biological processes and molecular functions of associated GO terms. The enrichment score of each GO term is shown as the −log10 of corrected P values, indicated by different color intensities
Fig. 4
Fig. 4
GFI1B enhances transcription of a TCF dependent promoter/reporter system. a, b TOP/FOP flash reporter assay in 293T cells. Cells were transfected with the indicated plasmids together with TOP or FOP reporter constructs 36 h before luciferase measurement. GFI1B enhances the TOP/FOP ratio at both basal levels and following activation with a 10% Wnt3A-conditioned media or b co-transfection with active form of β-catenin and/or Wnt3A expressing vectors. ce TOP/FOP flash reporter assay in 293T cells transfected with WT Gfi1b and the indicated mutated forms. Cells were treated with 25 mM LiCl (to activate canonical Wnt signaling in c and e) for 5 h before luciferase measurement. f TOP/FOP flash reporter assay in 293T cells treated with CHIR99021, a specific GSK3β inhibitor for 5 h before luciferase measurement. g, h TOP/FOP flash reporter assay in 293T cells and GFI1B-TetON-U2OS cells transfected with the indicated vectors. i TOP/FOP flash reporter assay in U2OS cells stably expressing a doxycycline inducible GFI1B (Tet-ON system) transfected or not with a construct for TLE in the presence or absence of doxycycline. j, k TOP and modified TOP (flanked by GFI1B binding motifs) reporter assay in 293T cells. l Immune precipitation with anti Flag antibodies from 293T cells overexpressing WT or the indicated mutated forms of GFI1B followed by western blot. (*p < 0.05, **p < 0.005, ***p < 0.0001 on a Welch corrected t-test, error bars show s.d, n = 3 biologically independent samples for each data point)
Fig. 5
Fig. 5
Gfi1b is required for the expression of Axin II- or TCF-dependent reporter alleles in HSCs and MKs in vivo (ac) Axin2+/LacZ Wnt-reporter mice were used. Littermates not carrying the reporter transgene (Axin2+/+) were used to correct for endogenous β-galactosidase activity. a Mice were analysed by FACS at day 10 following the first injection of tamoxifen. b FDG (LacZ staining) histograms of indicated FACS gated cells. A representative result from three independent experiments is shown. c Quantification of the mean fluorescence intensity (MFI) measured in the FDG channel (LacZ) normalized to endogenous β-galactosidase activity. Paired t-test was used for the analysis. (n = 5 mice per group) (d, e) In vivo measurement of canonical Wnt signaling activity in Gfi1b WT/KO MKs and HSCs by FACS using TCF-H2B-GFP transgene reporter mice. A Mann–Whitney U non-parametric test was used for the analysis. Boxplot Centre line shows median and bounds of box and whiskers show interquartile ranges of GFP MFI, n = 5 GFI1b WT and five GFI1B KO mice
Fig. 6
Fig. 6
Deregulation of Wnt/β-catenin target gene expression in Gfi1b-deficient MKs and HSCs. a Gene expression analysis was done on sorted Gfi1b WT/KO MKs, HSCs and HSCs CD41low/CD9low as indicated. b, c Gene set enrichment analysis (GSEA) of RNA-seq data from the sorted cells using published Wnt related gene sets (see Supplementary Table 2 for gene set references). d RNA-seq expression analysis of Gfi1b/β-catenin co-occupied genes (based on published ChIP-seq data) in the three Gfi1b WT/KO populations. Genes indicated in red also have peaks for LSD1 at their promoter. e GFI1B expression in two independent K562-derived cell lines stably expressing a scrambled control shRNA (C1, C5) and two lines expressing a GFI1B specific shRNA (Sh11, Sh23). f Expression analysis of Wnt target genes by RT-PCR in GFI1B shRNA KD and scramble shRNA stable K562 clones. g Enrichment of acetylated H3K9 at GFI1B/β-catenin target gene promoters by ChIP-qPCR in GFI1B shRNA KD and scramble shRNA stable K562 clones. (*P < 0.05, **P < 0.001, ***P < 0.0001 on a Welch corrected t-test compared to C1 (in blue) or C5 (in red), error bars show s.d, n = 3 technical replicates)
Fig. 7
Fig. 7
Canonical and non-canonical Wnt target genes are deregulated in Gfi1b KO MK in vitro. a Gfi1b WT/KO mice were taken to obtain lineage depleted BM cells, n = 2 GFI1b WT and GFI1B KO mice. Cells were taken into culture in the presence of TPO and SCF for 7 days and MK were separated using BSA gradient followed by RNA-seq analysis. b Volcano plot of expression fold change (KO/WT) over the P value of differences between WT and KO. Vertical dashed lines show the threshold of two-fold change in expression in KO samples compared to WT. The color code shows the co-occupation of promotor by indicated factors as seen in ChIP-seq data from K562 cells. c, d Gene set enrichment analysis (GSEA) of RNA-seq data from the sorted cells using published Wnt related gene sets and two new sets of Wnt target genes pooled from published data. e Unsupervised clustering of RNA-seq data using indicated gene sets
Fig. 8
Fig. 8
GFi1b, β-catenin and LSD1 co-occupy sites at enhancer regions and gene promoters. a Venn diagram showing GFI1B, β-catenin and LSD1 ChIP-seq promoter binding prior to and after Wnt3A treatment of K562 cells. P indicates statistical significance of overlap between GFI1B and β-catenin calculated using Fisher’s exact test. b Example of target genes Axin2 and Yaf2 bound by GFI1B, β-catenin and LSD1 and H3K4me1 and H3K9me2 enrichment before and after Wnt3A treatment. Arrowhead indicates the presence of Gfi1b and TCF binding motifs in the Axin 2 promoter. c Motif enrichment analysis under GFI1B peaks alone (top) and Gfi1b/β-catenin overlapped peaks (bottom). d GFI1B (top) and β-catenin (bottom) ChIP-PCR analysis in K562 stable clones expressing GFI1B (S23) or scramble (C5) shRNA (error bars show s.d, n = 3 technical replicates). e Distribution of β-catenin peaks based on their distance to GFI1B peaks (left panel) and LSD1 peaks (right panel). f Distribution of LSD1 peaks based on their distance to GFI1B peaks (left panel) and reversely (right panel). g Venn diagram showing GFI1B, β-catenin and LSD1 binding at enhancer regions prior to and after Wnt3A treatment of K562 cells. h Distribution of β-catenin peaks (left) and their overlaps with GFI1B and/or LSD1 peaks based on the genomic feature of each bound region
Fig. 9
Fig. 9
Up-regulation of canonical Wnt signaling rescues Gfi1b-deficient phenotypes in HSCs and MKs. a, b Lineage depleted Gfi1b WT/KO BM cells were taken into culture under the indicated concentrations of Wnt3A. MKs and HSCs CD41low/CD9low were quantified by FACS at day seven post Tamoxifen injection, n = 5 GFI1b WT and five GFI1B KO mice. c Gfi1b KO MKs spreading on fibronectin-coated matrices is rescued by Wnt3A treatment. d MK roundness index plotted as bean plot. Upper part: spreading of Gfi1b KO MKs on Fibronectin coated matrices is rescued by Wnt3A treatment at increasing concentrations. Lower part: spreading of WT MKs on Fibronectin coated matrices is abrogated by Wnt3A treatment at increasing concentrations. (*p < 0.05, **p < 0.001, ***p < 0.0001 on a Mann–Whitney U-test, colored horizontal line shows median, n values for upper part are, in order from left to right: 39, 46, 95, 83, 91, 111, and 87. n values for lower part are, in order from left to right: 39, 120, 89, 108, 86, and 81). Each horizontal short line represents one individual cell. e Proposed model: Gfi1b interacts with β-catenin and regulates Wnt signaling in HSCs and MKs. Deletion of Gfi1b alters the balance between canonical and non-canonical Wnt signaling leading to expansion of HSCs and MKs and impaired MKs spreading on Fibronectin coated matrix

References

    1. Fiolka K, et al. Gfi1 and Gfi1b act equivalently in haematopoiesis, but have distinct, non-overlapping functions in inner ear development. EMBO Rep. 2006;7:326–333. doi: 10.1038/sj.embor.7400618. - DOI - PMC - PubMed
    1. Vassen L, Okayama T, Moroy T. Gfi1b:green fluorescent protein knock-in mice reveal a dynamic expression pattern of Gfi1b during hematopoiesis that is largely complementary to Gfi1. Blood. 2007;109:2356–2364. doi: 10.1182/blood-2006-06-030031. - DOI - PubMed
    1. Chowdhury AH, et al. Differential transcriptional regulation of meis1 by Gfi1b and its co-factors LSD1 and CoREST. PLoS. One. 2013;8:e53666. doi: 10.1371/journal.pone.0053666. - DOI - PMC - PubMed
    1. Saleque S, Kim J, Rooke HM, Orkin SH. Epigenetic regulation of hematopoietic differentiation by Gfi-1 and Gfi-1b is mediated by the cofactors CoREST and LSD1. Mol. Cell. 2007;27:562–572. doi: 10.1016/j.molcel.2007.06.039. - DOI - PubMed
    1. Upadhyay G, Chowdhury AH, Vaidyanathan B, Kim D, Saleque S. Antagonistic actions of Rcor proteins regulate LSD1 activity and cellular differentiation. Proc. Natl Acad. Sci. USA. 2014;111:8071–8076. doi: 10.1073/pnas.1404292111. - DOI - PMC - PubMed

Publication types

MeSH terms