. 2019 Mar 18;9(1):4738.
doi: 10.1038/s41598-019-40959-y.

Disturbed flow induces a sustained, stochastic NF-κB activation which may support intracranial aneurysm growth in vivo

Affiliations

Disturbed flow induces a sustained, stochastic NF-κB activation which may support intracranial aneurysm growth in vivo

Daniel C Baeriswyl et al. Sci Rep. .

Abstract

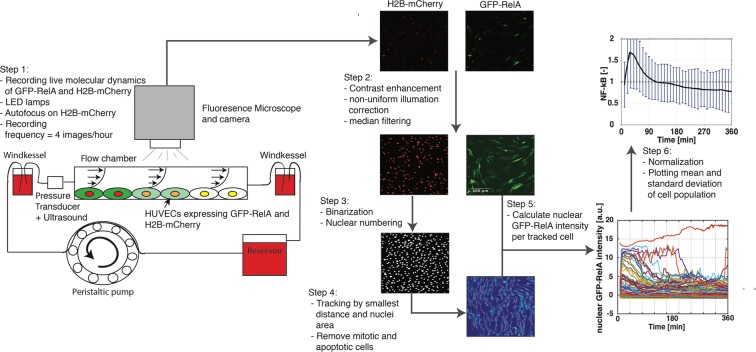
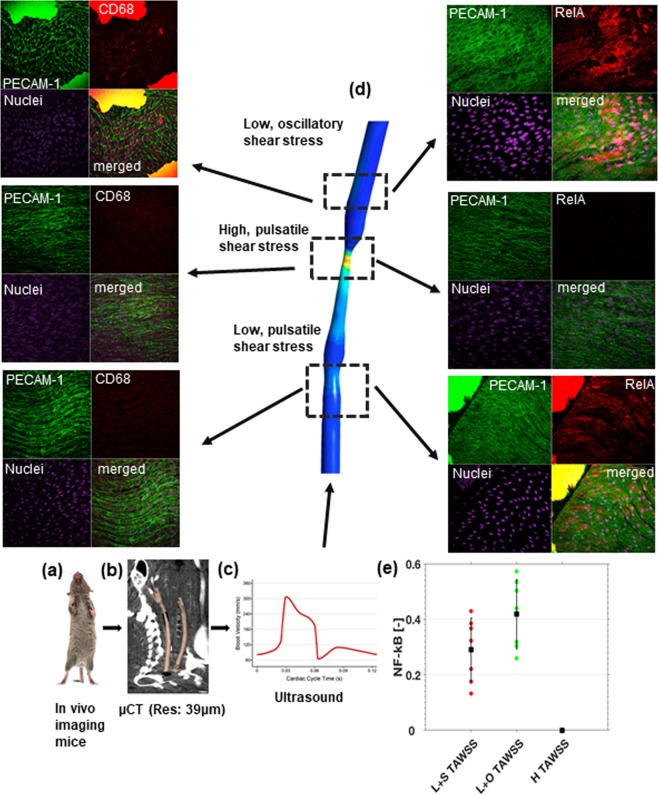
Intracranial aneurysms are associated with disturbed velocity patterns, and chronic inflammation, but the relevance for these findings are currently unknown. Here, we show that (disturbed) shear stress induced by vortices is a sufficient condition to activate the endothelial NF-kB pathway, possibly through a mechanism of mechanosensor de-activation. We provide evidence for this statement through in-vitro live cell imaging of NF-kB in HUVECs exposed to different flow conditions, stochastic modelling of flow induced NF-kB activation and induction of disturbed flow in mouse carotid arteries. Finally, CFD and immunofluorescence on human intracranial aneurysms showed a correlation similar to the mouse vessels, suggesting that disturbed shear stress may lead to sustained NF-kB activation thereby offering an explanation for the close association between disturbed flow and intracranial aneurysms.


Conflict of interest statement

The authors declare no competing interests.

Figures

Figure 1
Figure 1
Schematic diagram of the experimental pipeline: Step 1: Perfusion system including flow chamber, two windkessels, medium reservoir and a peristaltic pump. Cells within the flow chamber were recorded with the fluorescence microscope using LED lamps. Step 2: The raw image of H2B-mCherry and GFP-RelA were processed by enhancing the contrast, correcting non-uniform illumination and removing noise with a median filter. Step 3: H2B-mCherry image was made binary and the nuclei were numbered. Step 4: The numbered nuclei were tracked throughout all time frames. Step 5: The coordinates from the tracked nuclei were used to calculate the nuclear GFP-RelA intensity in the corrected GFP-RelA image. Step 6: nuclear GFP-RelA intensity in each cell was normalized by the time average GFP-RelA intensity. The population mean of the normalized nuclear GFP-RelA intensity including standard deviation was plotted as the result.
Figure 2
Figure 2
TNF-α stimulated nuclear translocation of NF-κB in HUVECs. HUVECs transfected with GFP-RelA and H2B-mCherry were stimulated with 10 ng/mL TNF-α (ac). A time series of GFP-RelA shows strong nuclear concentration at 30 minutes and empty nuclei at 0 and 360 minutes (a), the population mean of approximate 600 single cell measurements (b), projected view of the entire cell population (c). Immunohistochemistry of non-transfected HUVECs treated with 10 ng/mL TNF-α fixed and stained (p65-AF488) at different time points point normalized to unstimulated cells (*p < 0.05 = significant change to unstimulated cells, +p < 0.05 = significant change to previous time point) (d). The population mean of approximately 600 single untreated cells (e) and projected view of the entire population (f) of untreated GFP-RelA and H2B-mCherry transfected HUVECs recorded for 360 minutes.
Figure 3
Figure 3
Effect of a spatial gradient on NF-κB: The velocity profile of the gradient channel obtained from CFD simulations. The ramp like structure creates a linear increasing shear stress (depicted with an arbitrary plot) at the bottom wall of the channel. The nuclear GFP-RelA intensity at six different shear stress magnitude positions (a - 2 dyne/cm2, b - 5 dyne/cm2, c - 8 dyne/cm2, d - 11 dyne/cm2, e - 13 dyne/cm2, f - 16 dyne/cm2) indicated on the velocity profile were recorded with an average cell count of 300 per position in three repeats.
Figure 4
Figure 4
The effect of shear stress on the distribution of nuclear NF-κB peaks. The maximum peak probability distribution of NF-κB time series measured in HUVECs exposed to: uniform low shear stress (2 dyne/cm2) (1312 cells) (a), uniform high shear stress (22 dyne/cm2) (1789 cells) (b), shear stress gradient (2–16 dyne/cm2, measured at 2, 5, 8, 11, 13, and 16 dyne/cm2) (1676 cells) (c), static conditions (554 cells) (d), and after 6 hours of 10 ng/mL TNF-α (594 cells) (e). Plots were generated by calculating the normal distribution in time and intensity of all single cell peaks of the normalised NF-kB value for each experimental condition. Peak refers to the highest value of the normalised NF-kB time serie of a single cell. The colour indicates the NF-kB peak distribution density of the population in time and intensity. Finally, we display the ratio of peak probability distribution of each intervention to static conditions. TNF-α resulted in a low negative correlation, while under flow, high shear stress affected the distribution of peaks the most (f).
Figure 5
Figure 5
Kmeans clustering identifies groups of endothelial cells with specific NF-κB dynamics. Kmeans cluster map of the nuclear GFP-RelA intensity time series normalized by time average of HUVECs exposed to a shear stress gradient of 2–16 dyne/cm2. (a) Means of the cluster groups (Gr.1 = blue, Gr.2 = red, Gr.3 = yellow, Gr.4 = violet, Gr.5 = green) are displayed in time. (b) The change in population percentages of each cluster group at different shear stress positions within the gradient channel fitted to a linear regression. P-value is calculated with an ANOVA. Same colors as in plot b (c).
Figure 6
Figure 6
Flow induces NF-κB activation: Cluster map of the predicted temporal nuclear NF-κB concentration (a) of a cell population exposed to a shear stress gradient of 2–16 dyne/cm2. Means of the predicted temporal nuclear NF-κB concentration (b) of each cluster group. The shear stress profile of the bottom wall after a sudden expansion (detailed CFD model description in Sup. Material) is depicted (c) and next to it, the temporal nuclear NF-κB changes in a cell population of 50,000 cells (d) exposed to the stationary shear stress profile from panel c.
Figure 7
Figure 7
In vivo experiments showing that sustained vortex formation is sufficient for NF-κB activation. The carotid arteries of a mouse are imaged with an ultrahigh resolution uCT (a,b), and segmented (b). The doppler signal of the mouse carotid artery is recorded (c) and fed in as boundary conditions for the CFD simulation of the geometry reconstructed from the carotid artery uCT (b). Displayed is the time average wall shear stress (TAWSS) from the cuffed vessel (d). Panel d shows experiments where CFD is coupled to endothelial cells exposed to low pulsatile shear stress, high pulsatile shear stress, and low oscillatory shear stress. The stains on the right shows PECAM1 for endothelial cell boundaries in the upper left corner, RelA for NF-κB in the upper right corner, a nuclear stain in the lower left corner and all 3 merged in the lower right corner. It is clearly shown that RelA is high in the disturbed velocity region, which indicates high NF-κB activity. Stains on the left are similar to those on the right with the exception that RelA has been changed to CD68 to identify macrophages. For the analysis, five animals with >30 region of interest per animal were analyzed (e). NF-κB activity in regions of low shear stress and low disturbed shear stress were both significantly increased with respect to high shear stress regions (p < 0.05). All measurements were normalized to the high shear stress regions. Note that endothelial cells are rounded in the disturbed flow region and elongated in the high shear region. The low shear region shows more aligned but shorter endothelial cells. The picture of the mouse was made by SachaBurkhard@shutterstock.
Figure 8
Figure 8
Illustrative example of histology sample locations on the aneurysm of Patient C, stained for RelA (green), PECAM-1 (red) and nucleus (blue) (a), and corresponding in-silico distributions of TAWSS (b) and OSI (c). Comparison of sample NF-κB intensities [n = 18] across all three aneurysms with corresponding means and standard deviations indicated in (d) for High(H) [n = 6] and Low(L) [n = 12] TAWSS; (e) for Stationary(S) [n = 11] and Oscillatory(O) [n = 7] TAWSS; and (f) for Low and Stationary(L + S) [n = 6], Low and Oscillatory(L + O) [n = 6], and High(H) [n = 6] TAWSS. Where “High” TAWSS corresponds to TAWSS > 10 Pa and “Oscillatory” TAWSS corresponds to OSI>0.01. Statistical analysis was performed with a t-test (panel d and e) or an ANOVA (panel f) after Shapiro-Wilk tests confirmed no significant departure from a normal distribution (p = 0.05).
Figure 9
Figure 9
Representative examples of aligned (ac) and dis-aligned (df) endothelial cells covering the intraluminal regions of a human intracranial aneurysm. Endothelial cells have been immunolabeled for NF-κB (RelA, in green) and nuclei were counterstained with DAPI (in blue). (a,d) Are confocal images obtained from one plane. (b,c,e,f) Images are maximal projections of combined confocal z-stacks. Scale bar represents 20 mm.

References

    1. Yurdagul A, Jr., Finney AC, Woolard MD, Orr AW. The arterial microenvironment: the where and why of atherosclerosis. Biochem J. 2016;473(10):1281–95. doi: 10.1042/BJ20150844. - DOI - PMC - PubMed
    1. Andreou I, et al. “How do we prevent the vulnerable atherosclerotic plaque from rupturing? Insights from in vivo assessments of plaque, vascular remodeling, and local endothelial shear stress”. J Cardiovasc Pharmacol Ther. 2015;20(3):261–75. doi: 10.1177/1074248414555005. - DOI - PubMed
    1. Xiao L, Liu Y, Wang N. New paradigms in inflammatory signaling in vascular endothelial cells. Am J Physiol Heart Circ Physiol. 2014;306(3):H317–25. doi: 10.1152/ajpheart.00182.2013. - DOI - PubMed
    1. Dabek J, Kulach A, Gasior Z. Nuclear factor kappa-light-chain-enhancer of activated B cells (NF-kappaB): a new potential therapeutic target in atherosclerosis? Pharmacol Rep. 2010;62(5):778–83. doi: 10.1016/S1734-1140(10)70338-8. - DOI - PubMed
    1. Robbesyn F, Salvayre R, Negre-Salvayre A. Dual role of oxidized LDL on the NF-kappaB signaling pathway. Free Radic Res. 2004;38(6):541–51. doi: 10.1080/10715760410001665244. - DOI - PubMed

Publication types