. 2019 Mar 20;9(1):4924.
doi: 10.1038/s41598-019-40567-w.

Genetic differences in host infectivity affect disease spread and survival in epidemics

Affiliations

Genetic differences in host infectivity affect disease spread and survival in epidemics

Osvaldo Anacleto et al. Sci Rep. .

Abstract

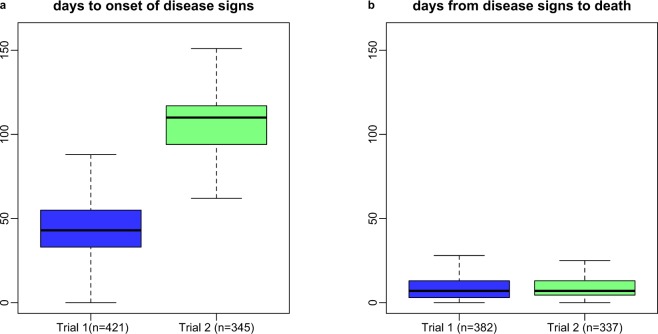
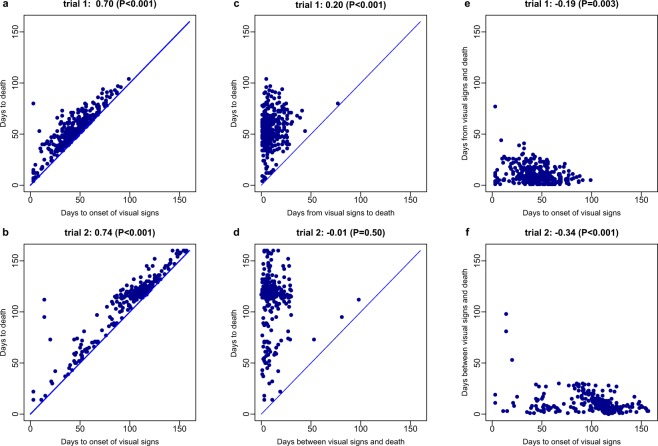
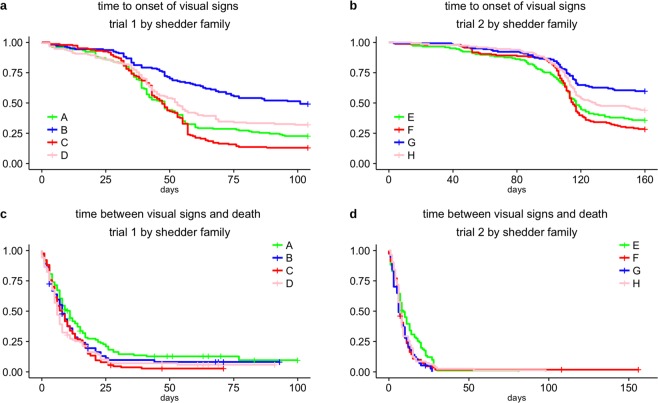
Survival during an epidemic is partly determined by host genetics. While quantitative genetic studies typically consider survival as an indicator for disease resistance (an individual's propensity to avoid becoming infected or diseased), mortality rates of populations undergoing an epidemic are also affected by endurance (the propensity of diseased individual to survive the infection) and infectivity (i.e. the propensity of an infected individual to transmit disease). Few studies have demonstrated genetic variation in disease endurance, and no study has demonstrated genetic variation in host infectivity, despite strong evidence for considerable phenotypic variation in this trait. Here we propose an experimental design and statistical models for estimating genetic diversity in all three host traits. Using an infection model in fish we provide, for the first time, direct evidence for genetic variation in host infectivity, in addition to variation in resistance and endurance. We also demonstrate how genetic differences in these three traits contribute to survival. Our results imply that animals can evolve different disease response types affecting epidemic survival rates, with important implications for understanding and controlling epidemics.


Conflict of interest statement

The authors declare no competing interests.

Figures

Figure 1
Figure 1
Transmission experimental design to detect genetic differences in host resistance, infectivity and tolerance. (a) Tank composition in our transmission experiment. Each of the 72 tanks comprised five artificially inoculated (shedder) fish from a single family and 20 susceptible (recipient) fish from four families. (b) Transmission experimental design in one of the trials. Each grey circle corresponds to one tank and a unique symbol-colour combination is assigned to each recipient (Ri) or shedder (Si) family in 36 tanks in one of the two trials of our experiment. The 4 shedder families (S1 to S4) were distributed across nine tanks each. Recipient families were housed in tanks such that nine recipient family combinations were created, which in turn were housed with each of four shedder families. Each recipient family was allocated in two recipient family compositions.
Figure 2
Figure 2
Turbot might have a short lifespan following infection by Philasterides dicentrarchi. (a) Box plots of time to disease signs for recipient fish that displayed these signs in the two trials of our experiment. (b) Box plots of time from signs to death for recipient fish considered in (a) that died before the end of the experiment.
Figure 3
Figure 3
Turbot survival during disease outbreaks caused by Philasterides dicentrarchi appear to be strongly influenced by time to infection but weakly correlated with time from infection to death. Scatterplots and Kendall correlations between time-to-event measurements collected for recipient fish that showed disease signs and died during trials 1 (n = 382) and 2 (n = 337) of the transmission experiment. (a,b) Time to death vs time to signs (distance between dots and diagonal line represents time from signs to death). (c,d) Time to death vs time from signs to death (distance between dots and diagonal line represents time to signs). (e and f) Time from signs to death vs time to signs. P-values were calculated using Kendall’s tau statistic (two-tailed).
Figure 4
Figure 4
Family differences in onset of visual signs and survival post disease. Evolution of disease caused by Philasterides dicentrarchi (a,b) and survival post disease (c,d) in all families of recipient fish in trials 1 and 2 of the transmission experiment. The curves were obtained through family-based Kaplan-Meier plots for time to signs (a,b) and time from signs to death (c,d). P-values were calculated using the two tailed log-rank test for detecting family differences in Kaplan-Meier estimates. Number of fish per family for each of the graphs are presented in Supplementary Tables 1 and 2.
Figure 5
Figure 5
Effect of shedder fish family on recipient infection and survival post infection. Evolution of the epidemics and survival post infection in recipient fish pooled by families of shedder fish shared across recipients. (a,b) Kaplan-Meier curves for time to signs of recipient fish from trials 1 (T1) and 2 (T2) by shedder family. (c,d) Kaplan-Meier curves for time from signs to death for recipient fish by shedder family, also for both trials of the experiment. Number of recipient fish by shedder family for each of the graphs are presented in Supplementary Table 3.

References

    1. Bishop, S. C., Axford, R. F. E., Nicholas, F. W. & Owen, J. B. Breeding for Disease Resistance in Farm Animals. (CABI, 2010).
    1. Bishop SC, Woolliams JA. Genomics and disease resistance studies in livestock. Livest. Sci. 2014;166:190–198. doi: 10.1016/j.livsci.2014.04.034. - DOI - PMC - PubMed
    1. Bishop SC, Morris CA. Genetics of disease resistance in sheep and goats. Small Rumin. Res. 2007;70:48–59. doi: 10.1016/j.smallrumres.2007.01.006. - DOI
    1. Yáñez, J. M., Houston, R. D. & Newman, S. Genetics and genomics of disease resistance in salmonid species. Front. Genet. 5 (2014). - PMC - PubMed
    1. Lewin HA. Disease resistance and immune response genes in cattle: strategies for their detection and evidence of their existence. J. Dairy Sci. 1989;72:1334–1348. doi: 10.3168/jds.S0022-0302(89)79241-9. - DOI - PubMed

Publication types

MeSH terms