. 2019 Mar 20;9(1):4898.
doi: 10.1038/s41598-019-41113-4.

Diminished apoptosis in hypoxic porcine retina explant cultures through hypothermia

Affiliations

Diminished apoptosis in hypoxic porcine retina explant cultures through hypothermia

Ana M Maliha et al. Sci Rep. .

Abstract

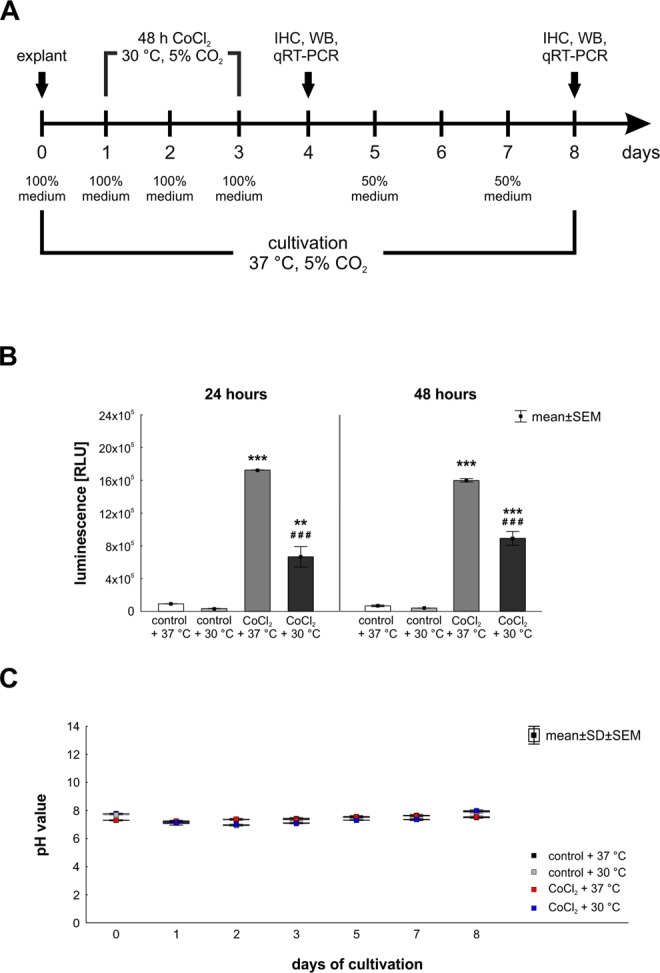
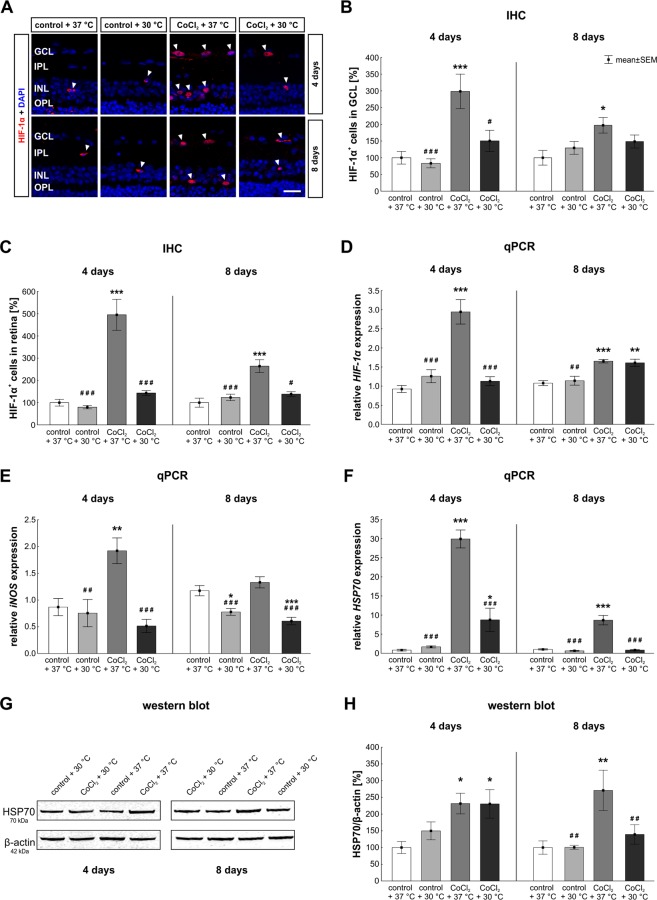
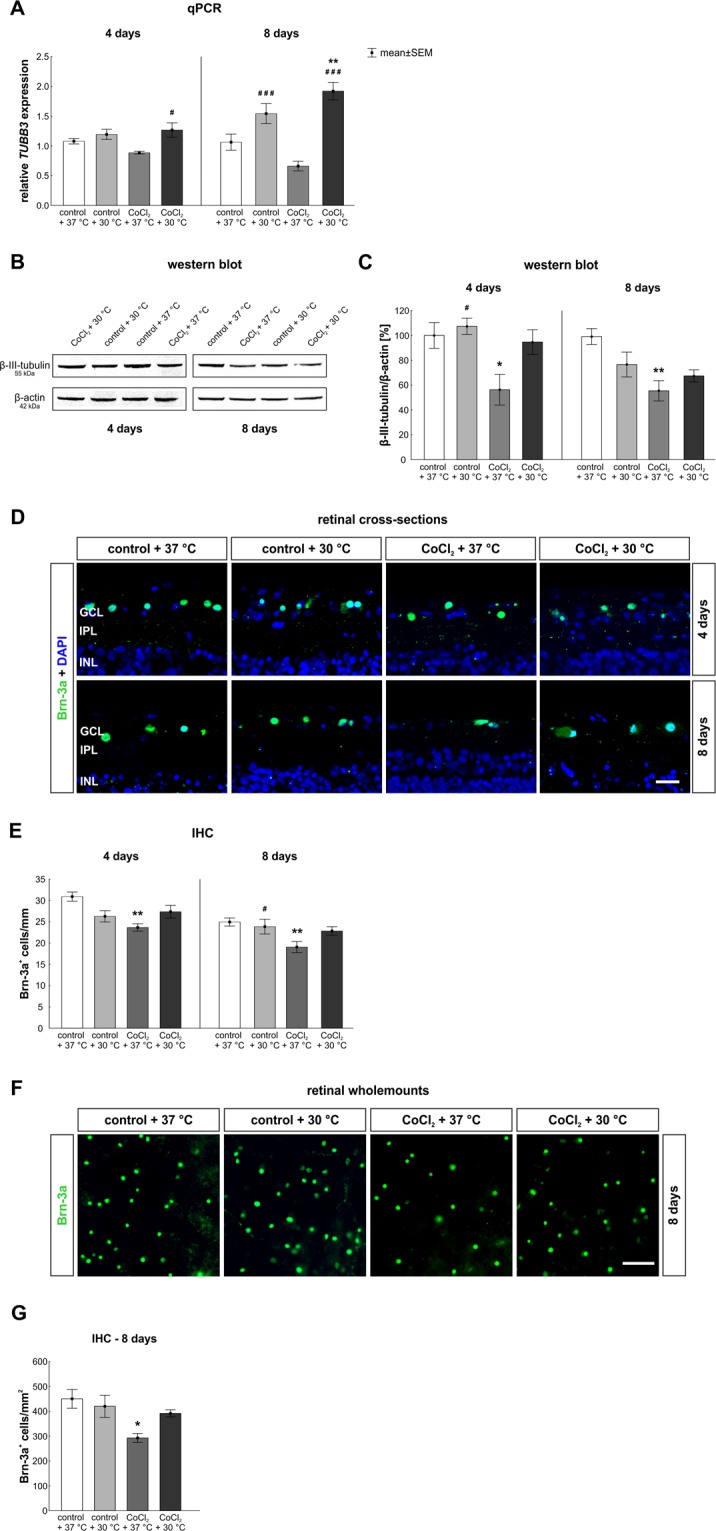
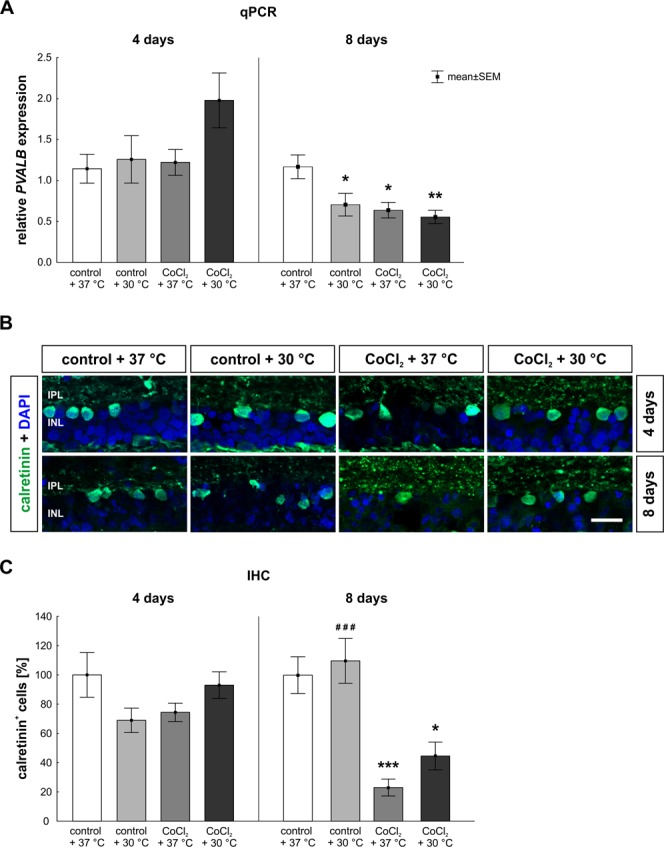
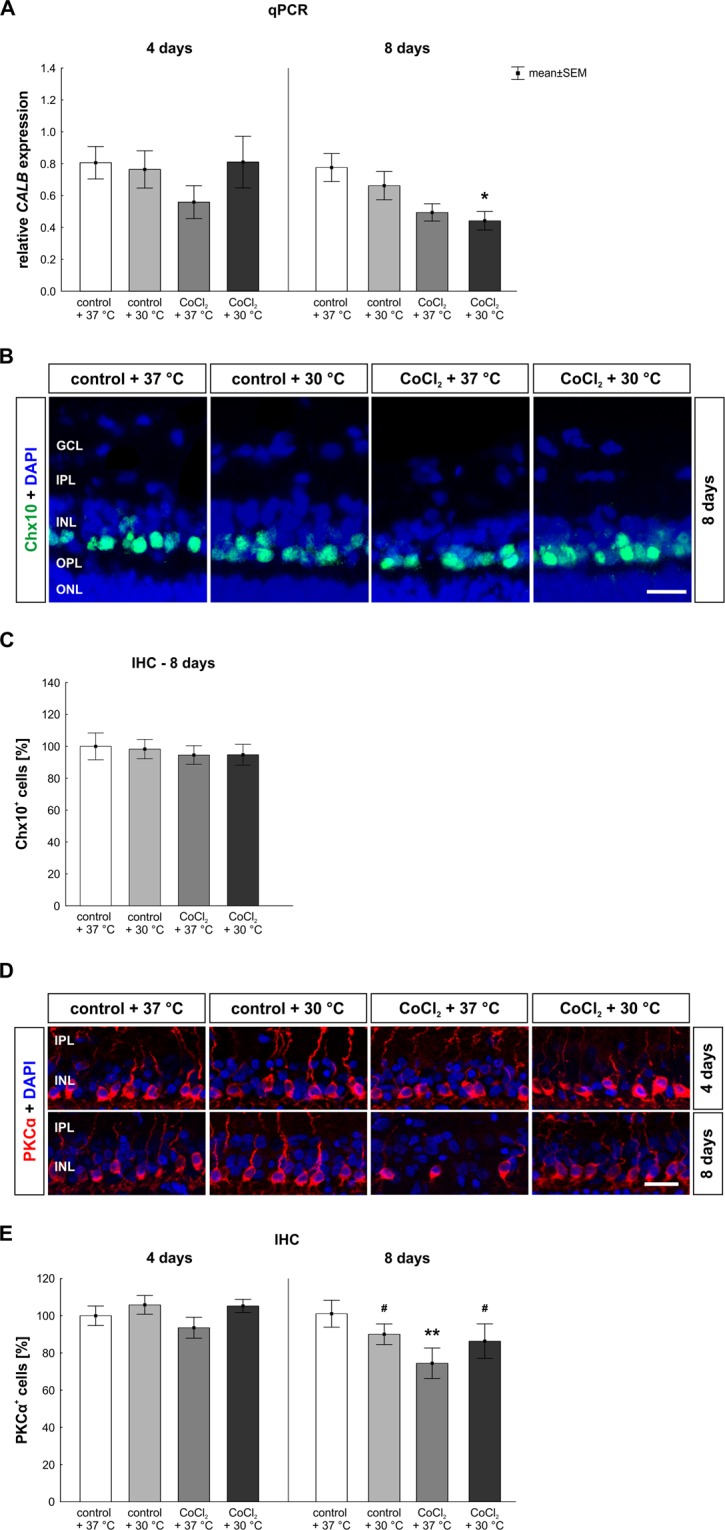
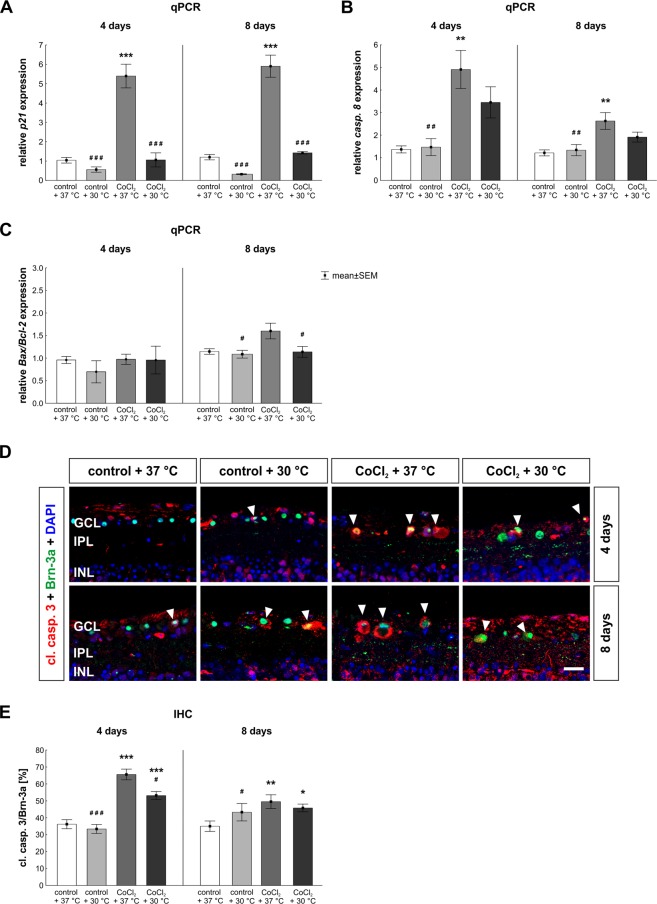
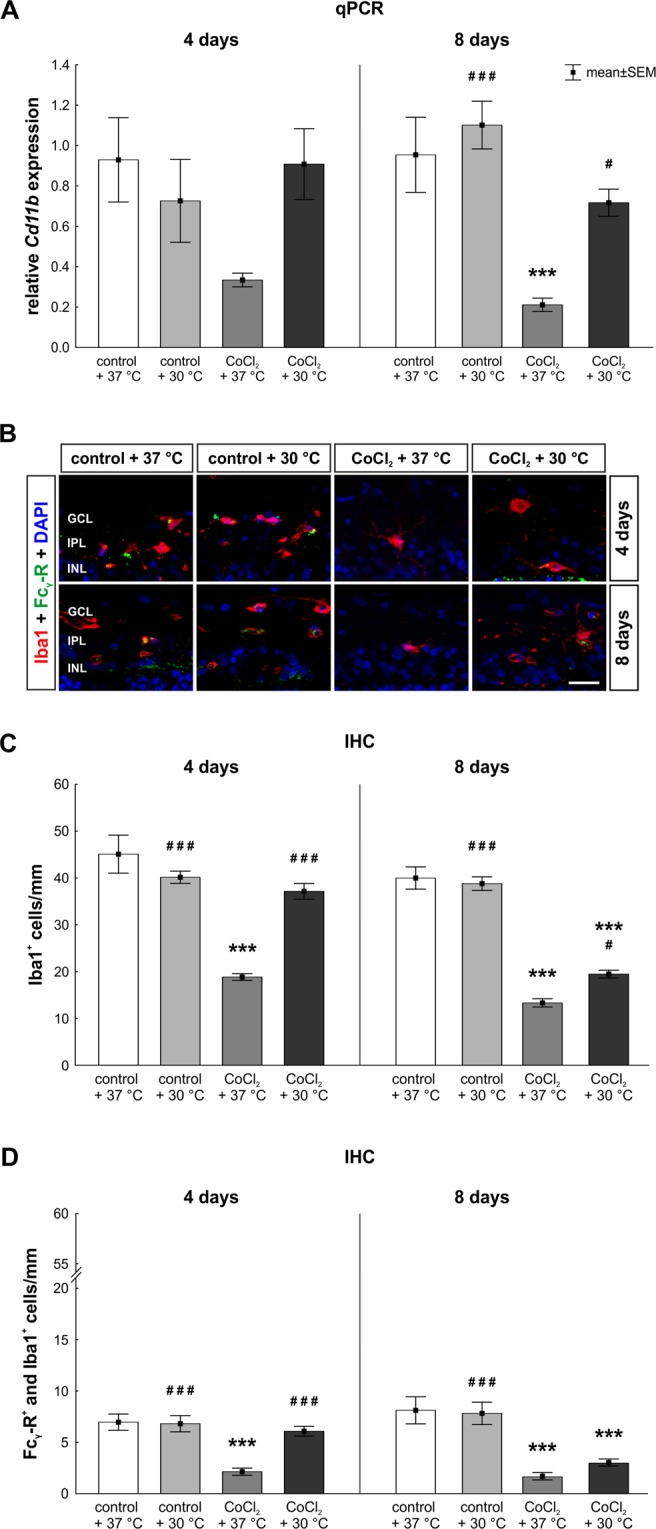
Simulation of hypoxic processes in vitro can be achieved through cobalt chloride (CoCl2), which induces strong neurodegeneration. Hypoxia plays an important role in the progression of several retinal diseases. Thus, we investigated whether hypoxia can be reduced by hypothermia. Porcine retinal explants were cultivated for four and eight days and hypoxia was mimicked by adding 300 µM CoCl2 from day one to day three. Hypothermia treatment (30 °C) was applied simultaneously. Retinal ganglion, bipolar and amacrine cells, as well as microglia were evaluated via immunohistological and western blot analysis. Furthermore, quantitative real-time PCR was performed to analyze cellular stress and apoptosis. In addition, the expression of specific marker for the previously described cell types were investigated. A reduction of ROS and stress markers HSP70, iNOS, HIF-1α was achieved via hypothermia. In accordance, an inhibition of apoptotic proteins (caspase 3, caspase 8) and the cell cycle arrest gene p21 was found in hypothermia treated retinae. Furthermore, neurons of the inner retina were protected by hypothermia. In this study, we demonstrate that hypothermia lowers hypoxic processes and cellular stress. Additionally, hypothermia inhibits apoptosis and protects neurons. Hence, this seems to be a promising treatment for retinal neurodegeneration.


Conflict of interest statement

The authors declare no competing interests.

Figures

Figure 1
Figure 1
(A) Study timeline. Explants of porcine retinae were prepared at day zero and cultivated for four and eight days. Degeneration processes were induced by adding CoCl2 (300 µM) from day one to day three. Hypothermia treatment (30 °C) was applied simultaneously. Four groups were compared: control + 37 °C, CoCl2 + 37 °C, hypothermia treated control + 30 °C and CoCl2 + 30 °C. At days four and eight retina samples were prepared for immunohistological (IHC), western blot (WB) and qPCR analyses. (B) Hypothermia reduced the ROS-production in cultivated retina. ROS-level was measured 24 and 48 hours after CoCl2-induction. For both points in time, the ROS-level was strongly elevated after CoCl2-treatment. Hypothermia reduced the ROS-production significantly in CoCl2-treated retinae. However, it was still higher than in control + 37 °C retinae. (C) pH-value was measured to assure that degenerative effects were induced by CoCl2 and not by cultivation effects. pH-value was stable at any day of cultivation. B: n = 3/group. C: n = 10/group. **p < 0.01; ###,***p < 0.001.
Figure 2
Figure 2
Reduced hypoxic processes and cellular stress through hypothermia. (A) Representative pictures of hypoxic cells in retinae. Hypoxic cells were stained with anti-HIF-1α (red, arrowheads). DAPI was used to visualize cell nuclei (blue). (B) Statistical evaluation of HIF-1α cell counts showed, that CoCl2 led to a strongly elevated number of HIF-1α+ cells located in the GCL after four and eight days. Hypothermia inhibited hypoxic processes and lowered hypoxia in most of the cells located in the GCL. (C) In regard to the number of hypoxic cells in the whole retina, CoCl2 again led to an increased hypoxia, whereas hypothermia alleviated hypoxic processes. (D) mRNA levels of HIF-1α were evaluated via qPCR. Analyses revealed an increased HIF-1α mRNA expression in the CoCl2 + 37 °C group at both days compared to the control + 37 °C group. At day four, hypothermia led to a control-like HIF-1α expression. (E) mRNA levels of iNOS were analyzed with qPCR. The iNOS mRNA expression was significantly increased by CoCl2 after four days. This effect was counteracted by hypothermia. At day eight, CoCl2 had no effect on iNOS expression, whereas both hypothermia treated groups, showed a reduced iNOS mRNA expression in comparison to the control group. (F) qPCR analysis regarding HSP70. CoCl2 strongly elevated the HSP70 mRNA expression level at days four and eight. At both points in time, hypothermia lowered HSP70 mRNA expression in the CoCl2 stressed retinae. (G) Protein levels of HSP70 (70 kDa) were measured via western blot and normalized against β-actin (42 kDa). (H) At day four, a significantly increased signal intensity of HSP70 was noted in both CoCl2 treated group, irrespectively of the temperature. Hypothermia treatment decreased the HSP70 signal intensity after eight days, causing no difference between the CoCl2 + 30 °C and the control + 37 °C group. Abbreviations: GCL = ganglion cell layer; IPL = inner plexiform layer; INL = inner nuclear layer; OPL = outer plexiform layer; IHC = immunohistochemistry; qPCR = quantitative real-time PCR. Values are mean ± SEM. B, C: n = 9–10/group; D-H: n = 6–7/group. Statistical differences to control + 37 °C group are marked with * and differences to CoCl2 + 37 °C group with #. #,*p < 0.05; ##,**p < 0.01; ###,***p < 0.001. Scale bar = 20 µm.
Figure 3
Figure 3
Protection of neurons, especially of retinal ganglion cells (RGCs), after hypothermia. (A) qPCR analysis regarding TUBB3. At day eight, a higher TUBB3 mRNA expression was found in both hypothermia treated groups. (B) Protein levels of β-III-tubulin, at 55 kDA, were measured via western blot and normalized against β-actin, at 42 kDa. (C) A significantly reduced β-III-tubulin protein level was observed after four and eight days via western blot analyses in the CoCl2 + 37 °C group. This effect was counteracted by hypothermia treatment. (D) Representative pictures of the ganglion cell layer. RGCs were stained in retinal cross-sections with anti-Brn-3a (green) at days four and eight. Cell nuclei were labelled with DAPI (blue). (E) Quantification revealed that CoCl2 at 37 °C induced a RGC loss after four and eight days. Degenerative effects of CoCl2 were counteracted via hypothermia treatment at both points in time. (F) Representative images depict RGCs stained in wholemount retinae at eight days using anti-Brn-3a (green). (G) Also in wholemounts, a significant loss was noted in the CoCl2 treated retinae at 37 °C, whereas hypothermia treatment protected RCGs. Abbreviations: GCL = ganglion cell layer; IPL = inner plexiform layer; INL = inner nuclear layer. qPCR = quantitative real-time PCR; IHC = Immunohistochemistry. Values are mean ± SEM. A: n = 6–7/group, B,C : n = 4/group; E,G: n = 10/group. Statistical differences to control + 37 °C group are marked with * and differences to CoCl2 + 37 °C group with #. #,*p < 0.05, **p < 0.01, ###p < 0.001. Scale bar = 20 µm (D); scale bar = 50 µm (F).
Figure 4
Figure 4
Late loss of amacrine cells. (A) qPCR analysis of PVALB. After eight days, a significantly reduced mRNA expression of PVALB was observed in all groups when compared to the control + 37 °C. (B) Representative pictures of the inner layers. Amacrine cells were stained with anti-calretinin (green) at four and eight days of cultivation. DAPI was used to visualize the cell nuclei (blue). (C) At day eight, a significant loss of amacrine cells was detected in the CoCl2 + 37 °C group. Hypothermia treatment did not rescue the amacrine cells. Abbreviations: IPL = inner plexiform layer; INL = inner nuclear layer; qPCR = quantitative real-time PCR; IHC = immune-histochemistry. Values are mean ± SEM. A: n = 6–7/group, B, C: n = 9–10/group. Statistical differences to control + 37 °C group are marked with * and differences to CoCl2 + 37 °C group with #. *p < 0.05; **p < 0.01; ###,***p < 0.001. Scale bar = 20 µm.
Figure 5
Figure 5
Late loss of bipolar cells was counteracted by hypothermia. (A) CALB mRNA expression was measured via qPCR. After eight days, a significantly decreased CALB mRNA expression was seen in the hypothermia treated CoCl2 + 30 °C retinae. (B) Representative images of bipolar cells stained with anti-Chx10 (green) at eight days. DAPI was used for the visualization of cell nuclei (blue). (C) After eight days, all groups had a similar number of Chx10+ cells. (D) Representative pictures of the inner layers are given. Rod bipolar cells (red) were stained immunohistochemically at days four and eight using an anti-PKCα antibody. Cell nuclei are shown in blue. (E) At day eight, a significant loss of bipolar cells was noted in the CoCl2 + 37 °C. A rescue of PKCα+ cells was achieved by hypothermia. Abbreviations: GCL = ganglion cell layer; IPL = inner plexiform layer; INL = inner nuclear layer; OPL = outer plexiform layer; ONL = outer nuclear layer; qPCR = quantitative real-time PCR; IHC = immunohistochemistry. Values are mean ± SEM. A: n = 6–7/group; C,E: n = 9–10/group. Statistical differences to control + 37 °C group are marked with * and differences to CoCl2 + 37 °C group with #. #,*p < 0.05; **p < 0.01 Scale bar = 20 µm.
Figure 6
Figure 6
Inhibition of apoptotic processes via hypothermia. (A) Expression of the cell arrest gene p21 was evaluated via qPCR. Analysis revealed that p21 gene expression was strongly increased after four and eight days in the CoCl2 + 37 °C group. Hypothermia reduced the expression significantly at both points in time. (B) qPCR analyses of caspase 8. CoCl2 led to a strongly elevated expression of caspase 8 in the CoCl2 + 37 °C group after four and eight days. Again, hypothermia treatment counteracted that effect. (C) Ratio of Bax/Bcl-2 mRNA was measured via qPCR. After eight days, the Bax/Bcl-2 ratio in the CoCl2 + 37 °C group tended to be increased. Hypothermia reduced the Bax/Bcl-2 ratio in the CoCl2 + 30 °C group and no differences were seen in comparison to the control + 37 °C group. (D) Representative apoptotic retinal ganglion cells. RGCs were stained at four and eight days with anti-Brn-3a (RGCs; green) and cl. casp. 3 (apoptosis; red; arrowheads). Cell nuclei were visualized with DAPI (blue). (E) After four and eight days, the amount of apoptotic RGCs was significantly increased in the CoCl2 + 37 °C group. Interestingly, the number of apoptotic RGCs was reduced through hypothermia at four days. However, at eight days, no effects of hypothermia were detectable in the CoCl2 + 30 °C group compared to the CoCl2 + 37 °C. Abbreviation: GCL = ganglion cell layer; IPL = inner plexiform layer; INL = inner nuclear layer; qPCR = quantitative real-time PCR; IHC = immunohistochemistry. Values are mean ± SEM, A-C: n = 6–7/group; E: n = 10/group. Statistical differences to control + 37 °C group are marked with * and differences to CoCl2 + 37 °C group with #. #,*p < 0.05; ##,**p < 0.01; ###,***p < 0.001. Scale bar = 20 µm.
Figure 7
Figure 7
Hypothermia protected microglia. (A) Relative mRNA expression of Cd11b, a gene that is expressed by microglia, was analyzed via qPCR. At day four, a slightly decreased expression of CD11b was noted in the CoCl2 + 37 °C retinae, which was counteracted via hypothermia. After eight days, a significant reduction of CD11b was observed in the CoCl2 + 37 °C group. The damaging effect of CoCl2 was again counteracted by hypothermia in the CoCl2 + 30 °C group. (B) Representative pictures of microglia stained with anti-Iba1 (red) after four and eight days are shown. Anti-Fcγ-R was used as an activity marker for microglia (green). Fcγ-R+ and Iba1+ cells were counted as active microglia. Cell nuclei were visualized with DAPI (blue). (C) The significant loss of microglia due to CoCl2 was counteracted through hypothermia at both points in time. (D) CoCl2 led to a significantly reduced number of active microglia. Hypothermia treatment rescued active microglia at four days, but not at eight days. Abbreviations: GCL = ganglion cell layer; IPL = inner plexiform layer, INL = inner nuclear layer; qPCR = quantitative real-time PCR; IHC = immunohistochemistry. Values are mean ± SEM. A: n = 6–7/group; C, E: n = 10/group. Statistical differences to control + 37 °C group are marked with * and differences to CoCl2 + 37 °C group with #. #p < 0.05; ###,***p < 0.001. Scale bar = 20 µm.

References

    1. Tezel G, Wax MB. Hypoxia-inducible factor 1alpha in the glaucomatous retina and optic nerve head. Archives of ophthalmology. 2004;122:1348–1356. doi: 10.1001/archopht.122.9.1348. - DOI - PubMed
    1. Ziello JE, Jovin IS, Huang Y. Hypoxia-Inducible Factor (HIF)-1 regulatory pathway and its potential for therapeutic intervention in malignancy and ischemia. The Yale journal of biology and medicine. 2007;80:51–60. - PMC - PubMed
    1. Lopez-Hernandez B, Cena V, Posadas I. The endoplasmic reticulum stress and the HIF-1 signalling pathways are involved in the neuronal damage caused by chemical hypoxia. British journal of pharmacology. 2015;172:2838–2851. doi: 10.1111/bph.13095. - DOI - PMC - PubMed
    1. Hellwig-Burgel T, Stiehl DP, Wagner AE, Metzen E, Jelkmann W. Review: hypoxia-inducible factor-1 (HIF-1): a novel transcription factor in immune reactions. Journal of interferon & cytokine research: the official journal of the International Society for Interferon and Cytokine Research. 2005;25:297–310. doi: 10.1089/jir.2005.25.297. - DOI - PubMed
    1. Huang LE, Gu J, Schau M, Bunn HF. Regulation of hypoxia-inducible factor 1alpha is mediated by an O2-dependent degradation domain via the ubiquitin-proteasome pathway. Proceedings of the National Academy of Sciences of the United States of America. 1998;95:7987–7992. doi: 10.1073/pnas.95.14.7987. - DOI - PMC - PubMed

Publication types

MeSH terms