. 2019 Mar 20;9(1):4836.
doi: 10.1038/s41598-019-41235-9.

In situ 10-cell RNA sequencing in tissue and tumor biopsy samples

Affiliations

In situ 10-cell RNA sequencing in tissue and tumor biopsy samples

Shambhavi Singh et al. Sci Rep. .

Abstract

Single-cell transcriptomic methods classify new and existing cell types very effectively, but alternative approaches are needed to quantify the individual regulatory states of cells in their native tissue context. We combined the tissue preservation and single-cell resolution of laser capture with an improved preamplification procedure enabling RNA sequencing of 10 microdissected cells. This in situ 10-cell RNA sequencing (10cRNA-seq) can exploit fluorescent reporters of cell type in genetically engineered mice and is compatible with freshly cryoembedded clinical biopsies from patients. Through recombinant RNA spike-ins, we estimate dropout-free technical reliability as low as ~250 copies and a 50% detection sensitivity of ~45 copies per 10-cell reaction. By using small pools of microdissected cells, 10cRNA-seq improves technical per-cell reliability and sensitivity beyond existing approaches for single-cell RNA sequencing (scRNA-seq). Detection of low-abundance transcripts by 10cRNA-seq is comparable to random 10-cell groups of scRNA-seq data, suggesting no loss of gene recovery when cells are isolated in situ. Combined with existing approaches to deconvolve small pools of cells, 10cRNA-seq offers a reliable, unbiased, and sensitive way to measure cell-state heterogeneity in tissues and tumors.


Conflict of interest statement

The authors declare no competing interests.

Figures

Figure 1
Figure 1
A revised transcriptomic pipeline for in situ 10-cell RNA sequencing. Substantive changes are indicated in green and gray.
Figure 2
Figure 2
Fresh cryoembedding preserves tandem-dimer Tomato (tdT) fluorescence and localization better than snap-frozen alternatives. Brain samples from Cspg4-CreER;Trp53F/F;Nf1F/F;Rosa26-LSL-tdT animals were (A) freshly cryoembedded in Neg-50 medium with dry ice-isopentane (−40 °C), (B) snap-frozen in dry ice-isopentane and then cryoembedded, or (C) snap-frozen and slowly cryoembedded in a cryostat (−24 °C). Low- and high-magnification images were captured with the factory-installed color camera on the Arcturus XT LCM instrument. Images were exposure matched and are displayed with a gamma compression of 0.67. Insets have been rescaled to emphasize tdT diffusion away from the cell body. Scale bar is 25 µm. Brightfield images from the same sections are shown in Supplementary Fig. S3.
Figure 3
Figure 3
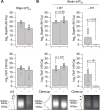
A blend of Taq–Phusion polymerases improves selective poly(A) amplification of cDNA and reduces AL1 primer requirements. Cells were obtained by LCM from a human breast biopsy and split into 10-cell equivalent amplification replicates. (A) Poly(A) PCR was performed with 15 µg of AL1 primer with Taq alone (10 units), Phusion alone (4 units) or Taq/Phusion combination (3.75 units/1.5 units). (B) Poly(A) PCR was performed with either 25, 5, 2.5, or 0.5 µg of AL1 primer and the Taq–Phusion blend from (A). Above—Relative abundance for the indicated genes and preamplification conditions was measured by quantitative PCR (qPCR). Data are shown as the median inverse quantification cycle (40–Cq) ± range from n = 3 amplification replicates and were analysed by two-way (A) or one-way (B) ANOVA with replication. Below—Preamplifications were analysed by agarose gel electrophoresis to separate poly(A)-amplified cDNA from nonspecific, low molecular-weight concatemer (n.s.). Qualitatively similar results were obtained separately three times. Lanes were cropped by poly(A) PCR cycles for display but were electrophoresed on the same agarose gel and processed identically. The uncropped image is shown in Supplementary Fig. S13A.
Figure 4
Figure 4
Optimized ERCC spike-in dilutions assess poly(A) PCR sensitivity and dynamic range without suppressing cDNA amplification of endogenous transcripts. (A) 100 pg RNA was supplemented with ERCC Mix 1 at the indicated dilutions and amplified via optimized poly(A) PCR. ERCC and endogenous gene abundances were measured by qPCR, and data are shown in grayscale as the inverse quantification cycle (40–Cq) from n = 4 amplification replicates. Negative effects of the ERCC spike-ins on endogenous genes (lower) were assess by two-way ANOVA with replication. (B) ERCC Mix 1 (6.23 × 104 copies) was spiked into 100 pg RNA and amplified via optimized poly (A) PCR. Proportional abundance of ERCC standards was estimated with a seven-log dilution series from purified qPCR end products. Data are shown as the median 40–Cq (black) for 22 ERCC spike-in standards from n = 8 amplification replicates (gray) with undetected “dropouts” reported below (circles).
Figure 5
Figure 5
Poly(A) amplification of murine sequences without reverse transcription is eliminated with 5′-biotin-modified oligo(dT)24 and streptavidin bead cleanup. (A) Reverse transcription-free preamplification of genomic DNA confounds accurate quantification of some mRNAs. (B) Bead cleanup eliminates nonspecific preamplification of genomic DNA. Above—Data are shown as the median inverse quantification cycle (40–Cq, gray) of n = 3 independent experiments (three amplification replicates per experiment). Differences with and without bead cleanup were assessed by Wilcoxon rank sum test. Below—Preamplifications were analysed by agarose gel electrophoresis to separate poly(A)-amplified cDNA and genomic amplification. Electrophoretic traces were analysed by densitometry to the left of the image, with genomic amplicons highlighted (arrows). Lanes were cropped by the indicated conditions for display but were electrophoresed on the same agarose gel and processed identically. The uncropped image is shown in Supplementary Fig. S13D.
Figure 6
Figure 6
Iterative SPRI bead purification eliminates low molecular-weight contaminants before tagmentation. (A) Poly(A) PCR reamplifications of 10-cell human breast cancer samples were analysed by gel electrophoresis without purification or after one (1×) or two (2×) rounds of purification with 70% (vol/vol) SPRI beads. The uncropped image is shown in Supplementary Fig. S13E. (B) Contaminating low molecular-weight concatemers are significantly reduced after two rounds of SPRI bead purification. Data are shown as the mean (gray) of n = 3 independent reamplifications (circles) each purified three times (+). Differences were assessed by two-way ANOVA with replication. The uncropped gel image used for concatemer densitometry is shown in Supplementary Fig. S13F (upper).
Figure 7
Figure 7
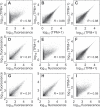
Paired comparison of 10-cell transcriptomes profiled by BeadChip microarray and 10cRNA-seq. (A–I) Three pool-and-split 10-cell replicates from before were reamplified, purified, and tagmented for RNA-seq. Inter-replicate correlations among BeadChip microarray triplicates (D,G,H) and 10cRNA-seq triplicates (B,C,F) as well as intra-replicate correlations between platforms (A,E,I) are shown together with the log-scaled Pearson correlation (R).
Figure 8
Figure 8
Increased gene detection and improved exonic alignment rates for 10cRNA-seq compared to scRNA-seq. (A) Detection of murine Ensembl genes for mouse oligodendrocyte precursor cells (OPCs) and lung neuroendocrine-derived cells. (B) Detection of human Ensembl genes for MCF-10A cells and human breast cells. (C) Exonic alignment rate comparison for OPCs and lung neuroendocrine-derived cells. (D) Exonic alignment rate comparison for MCF-10A cells and human breast cells. Public scRNA-seq data were obtained from the indicated accession numbers: sc1 = GSE75330, sc2 = GSE60361, sc3a = GSE103354 (plate-based), sc3b = GSE103354 (droplet-based), sc4 = GSE66357, sc5 = GSE113197, sc6 = PRJNA396019. 10cRNA-seq data were aggregated from independent 10-cell samples (circles) and 10-cell equivalents from pool-and-split controls. Pool-and-split controls from the same day are indicated with non-circular markers corresponding to the shared day. Pairwise differences between 10-cell and single-cell methods were assessed by permutation test.

Similar articles

Cited by

References

    1. Fidler IJ. Tumor heterogeneity and the biology of cancer invasion and metastasis. Cancer Res. 1978;38:2651–2660. - PubMed
    1. Allinen M, et al. Molecular characterization of the tumor microenvironment in breast cancer. Cancer Cell. 2004;6:17–32. doi: 10.1016/j.ccr.2004.06.010. - DOI - PubMed
    1. Sorlie T, et al. Gene expression patterns of breast carcinomas distinguish tumor subclasses with clinical implications. Proc. Natl. Acad. Sci. USA. 2001;98:10869–10874. doi: 10.1073/pnas.191367098. - DOI - PMC - PubMed
    1. Alizadeh AA, et al. Distinct types of diffuse large B-cell lymphoma identified by gene expression profiling. Nature. 2000;403:503–511. doi: 10.1038/35000501. - DOI - PubMed
    1. Ramaswamy S, Ross KN, Lander ES, Golub TR. A molecular signature of metastasis in primary solid tumors. Nat. Genet. 2003;33:49–54. doi: 10.1038/ng1060. - DOI - PubMed

Publication types